-
Datathon - Beginner Challenge
-

Check out our YT Demo Playlist Below in the "Try it Out" links!
-

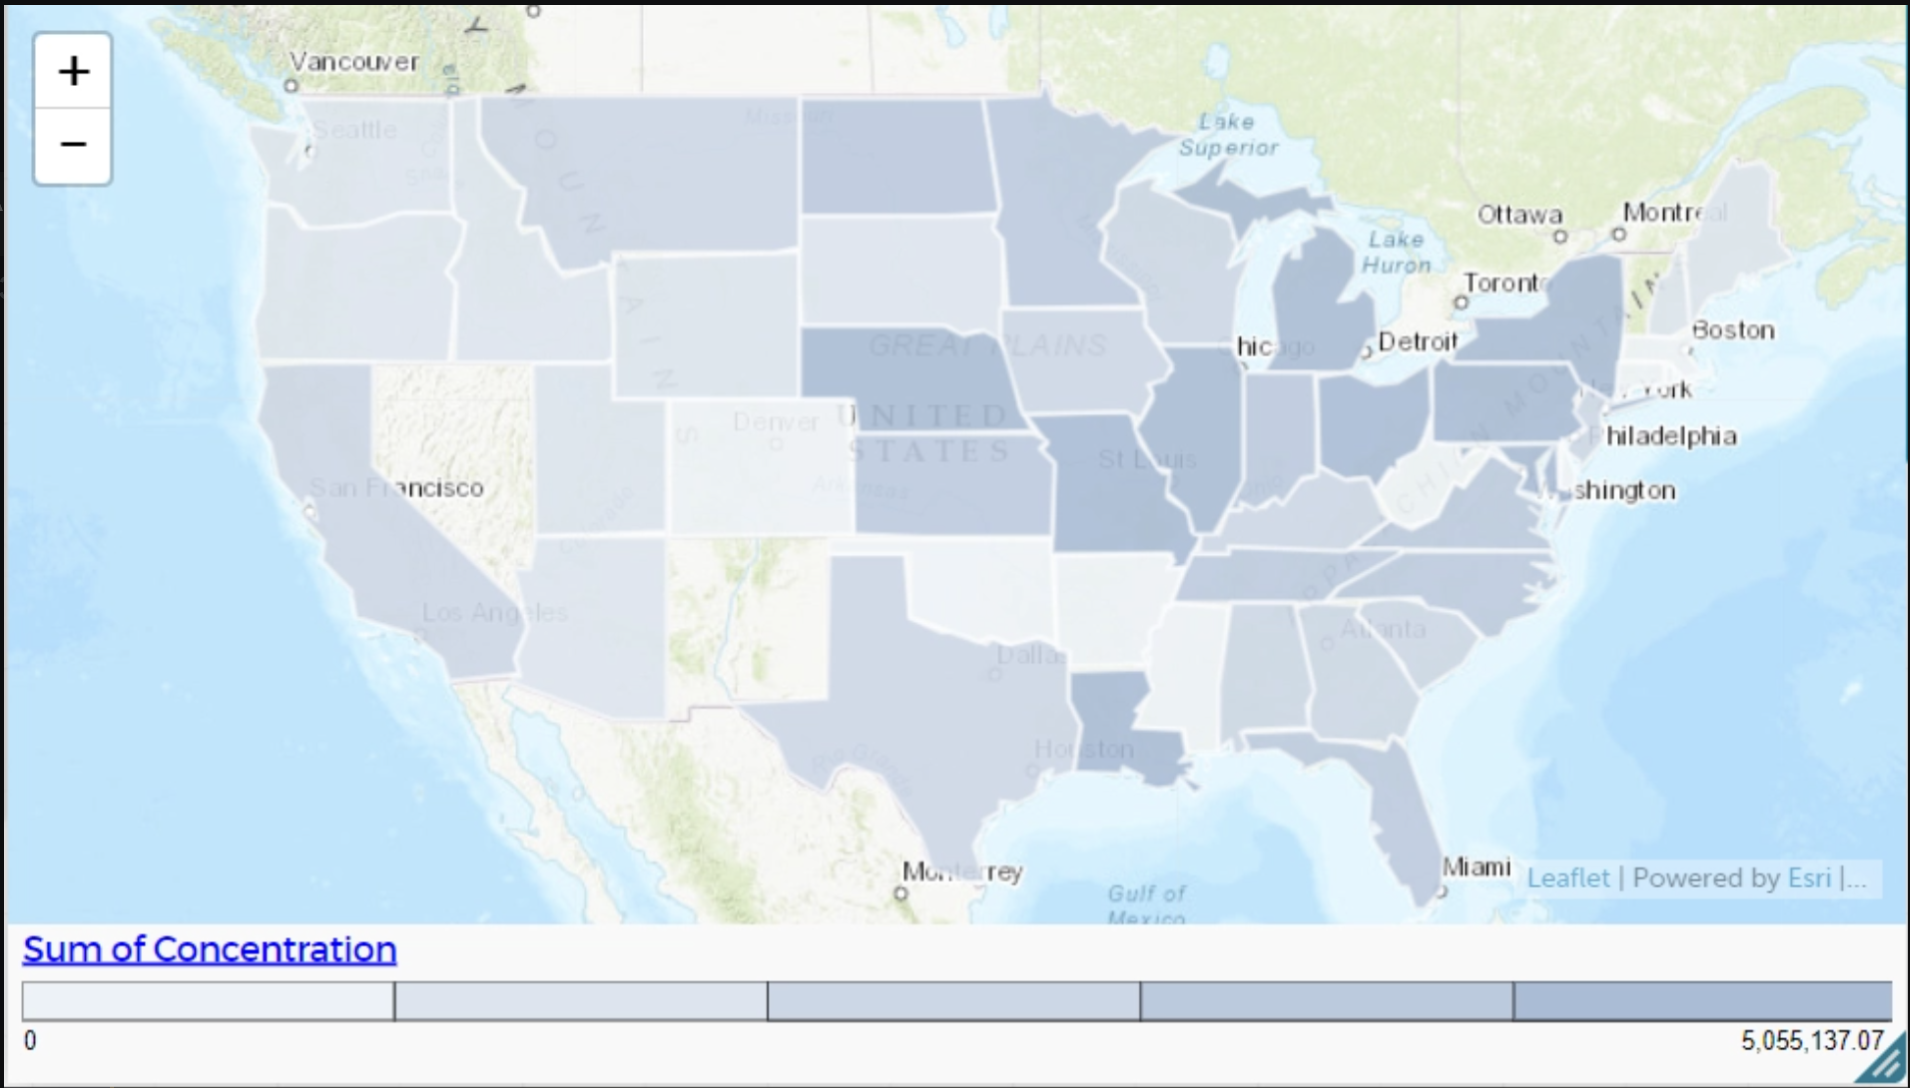
Pesticides with the highest concentrations per state


Inspiration
As we entered our first hackathon, we wanted to learn as much as possible about data analysis. When we saw the topic about the decline of pollinators, it reminded us of the PBS Kids show Wild Kratts from our childhood. This connection motivated us to dive deeper into our project and do more than just the basic analysis.
What it does
Our project examines the impact of pesticide concentration on milkweed, a crucial plant for the monarch butterfly population. The decline in milkweed availability directly affects the survival and reproduction of monarchs, leading to a significant decrease in their population and egg production. This analysis is supported by a variety of sources and presented through dynamic GIFs to illustrate the data effectively.
How we built it
We built our project through teamwork and by splitting tasks among our group members. After discussing our goals, we decided who would focus on which parts of the project based on everyone’s strengths and interests. This made it easier for us to work efficiently and stay organized. We also created a Google site linked below with all our GIFs, information on pesticide concentration, and behind-the-scenes. We used the google site to document our work throughout the datathon.
A big part of our work was gathering data. We used Python and a tool called Beautiful Soup to scrape information about monarch butterfly sightings and pesticide use from websites. This experience not only helped us improve our coding skills but also taught us how important it is to have accurate data. After collecting the data, we spent time cleaning it up and making sure everything was in order. We used Pandas, a powerful data manipulation library, to fix any issues we found.
Once we had clean data, we analyzed it to look for patterns and connections between pesticide levels and the decline in monarch butterfly populations. We created visuals using Matplotlib and Seaborn, including graphs and GIFs, to make our findings easy to understand. We also built a simple predictive model to see how changes in pesticide use could impact butterfly sightings in the future.
Throughout the project, we made sure to communicate openly and help each other out. Regular check-ins allowed us to share updates, solve problems, and learn from one another. In the end, we put together a presentation that highlighted our methods, visualizations, and conclusions, making it clear and engaging for our audience. By working together and supporting each other, we created a project that not only achieved our goals but also helped us learn and grow.
Challenges we ran into
Throughout our project, we encountered several errors and dead ends while attempting to build an AI predictor to assess how the continued changes in pesticide variation impact the butterfly population year by year. Initially, processing the data was overwhelming, leaving us feeling lost. However, we overcame this challenge by dividing our team into two groups: one focused on web scraping and the other on graphing the maps. This division of labor provided us with a significant advantage, boosting our confidence and enabling us to rapidly enhance our skills in Excel and Python.
Accomplishments that we're proud of
Our entire team is proud of every moment we experienced during this datathon. We gained invaluable knowledge and skills that we will carry forward in our future endeavors. From mastering web scraping techniques in Python to successfully visualizing our data with informative graphs, each step of the process has been a significant learning opportunity.
One of our key accomplishments was how we effectively collaborated as a team. By splitting our tasks evenly, we maximized our efficiency and ensured that every aspect of the project received the attention it deserved. While some team members focused on web scraping and gathering data, others concentrated on analyzing and visualizing that data through engaging maps and graphs. This division of labor not only made our workflow smoother but also allowed us to learn from each other's strengths.
Moreover, we developed a deeper understanding of the critical role that pesticides play in the decline of the monarch butterfly population. Collaborating effectively under pressure strengthened our teamwork and communication skills, which are essential in any group setting.
Ultimately, we transformed our initial confusion into clarity, emerging not only with a robust analysis of our findings but also with newfound confidence in our data analysis and programming abilities. This experience has not only broadened our technical skill set but also reinforced our commitment to raising awareness about the environmental issues affecting pollinators.
What we learned
Walking into our team's first-ever in-person hackathon, we were initially overwhelmed. It took us some time to fully grasp the project and understand the tasks ahead. However, we utilized the resources, guidance, and information, which helped us gain new skills. We learned how to web scrape using Python, create and analyze pivot tables in Excel, manually generate monthly GIFs for data visualization, embed websites for better accessibility, and use CODAP to graph and interpret our data.
What's Next for Unveiling the Flight of Monarchs and Pesticide Threats
Looking ahead, we aim to expand our data collection and present our findings more comprehensively on Google Sites. Additionally, we plan to raise awareness in our community about the harmful effects of pesticide overuse, which significantly contributes to the decline of pollinators like monarch butterflies.
Our reports, resources, findings, and results are published on our Google Sites and GitHub Repo. Please check that out for our data analysis! Thank you!


Log in or sign up for Devpost to join the conversation.