-

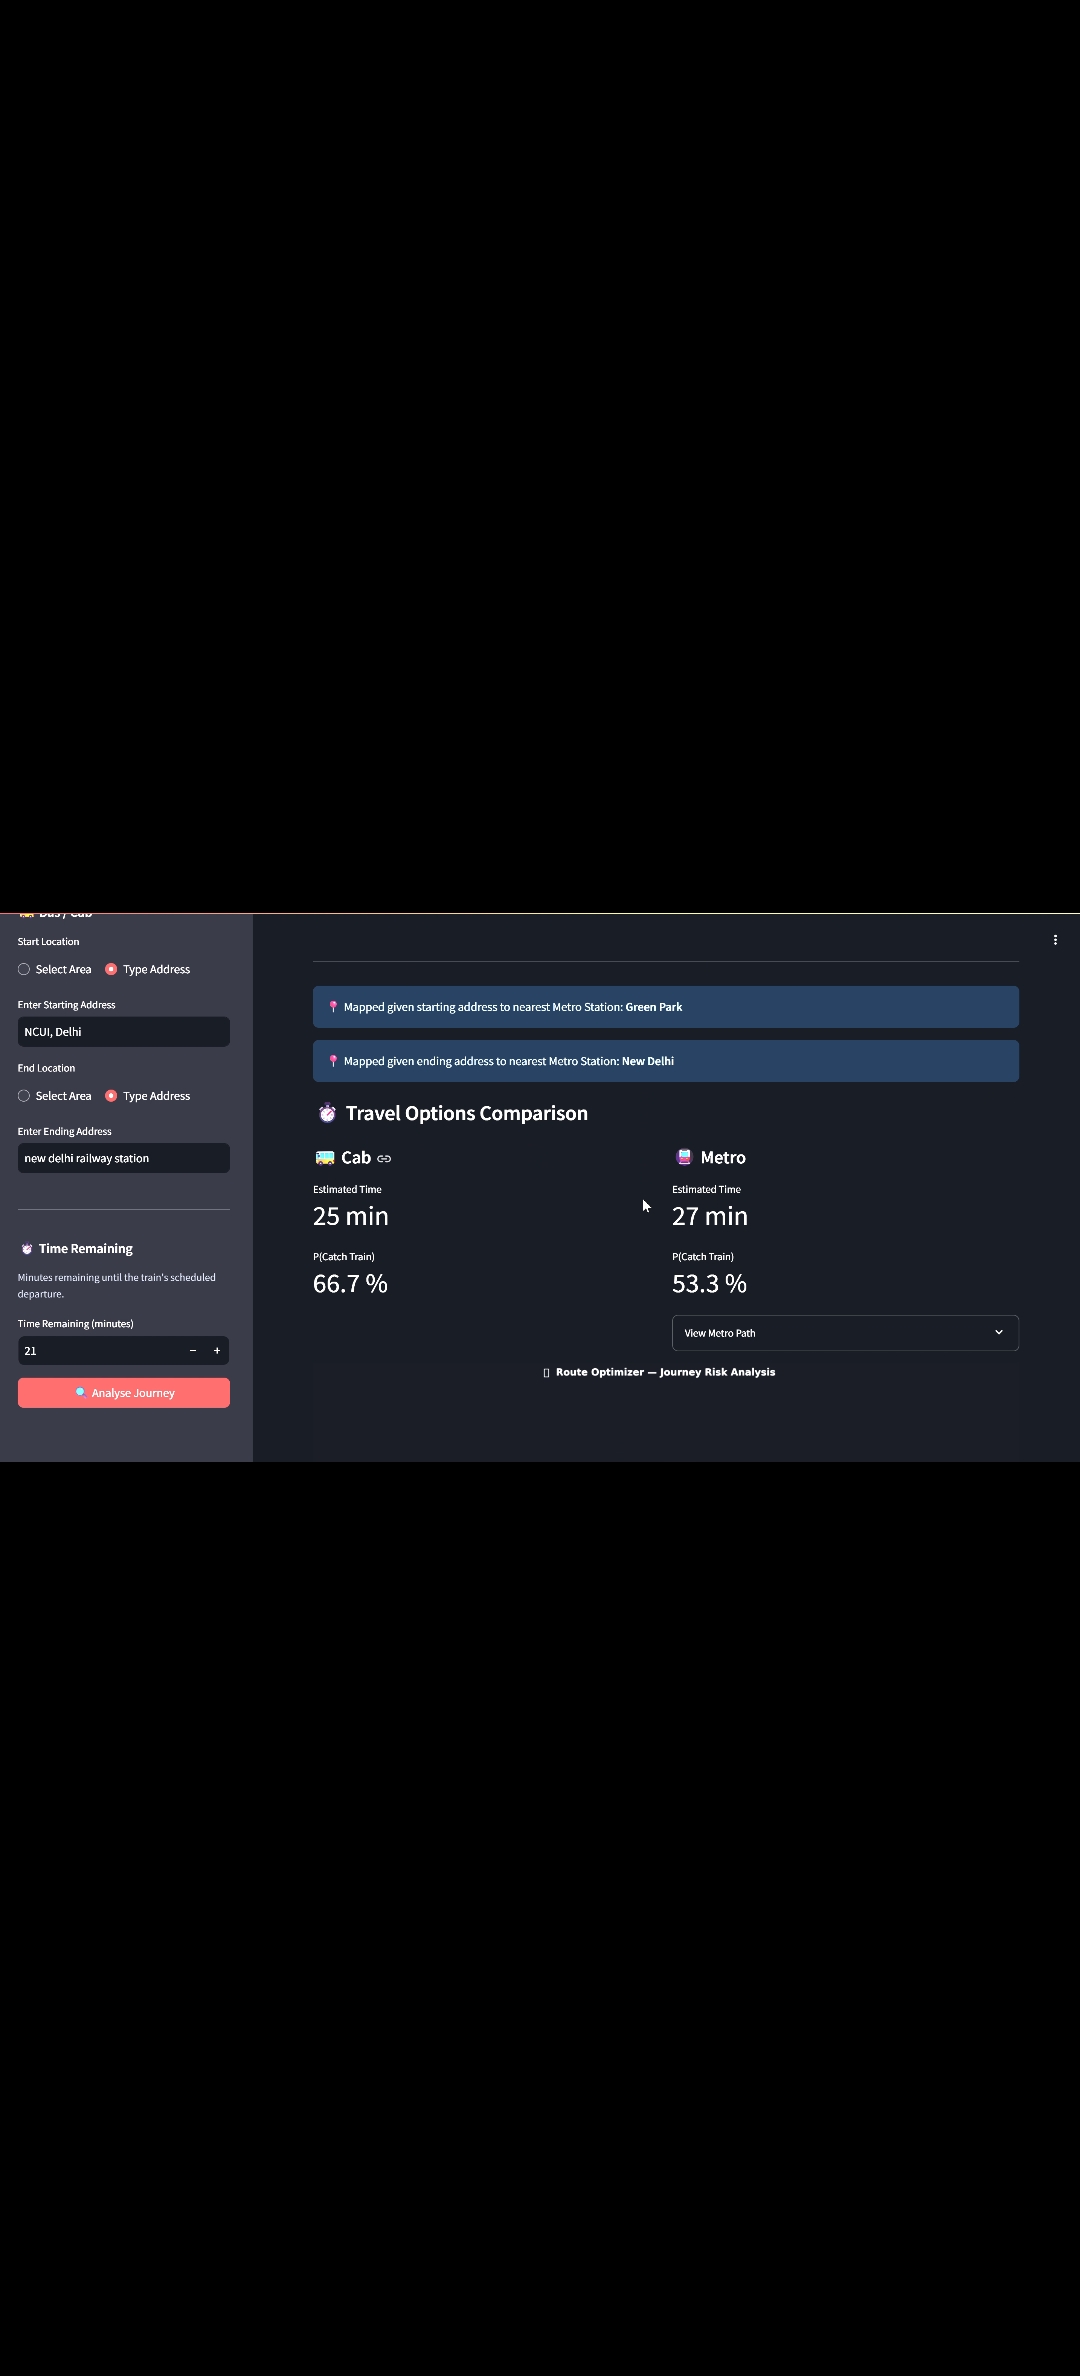
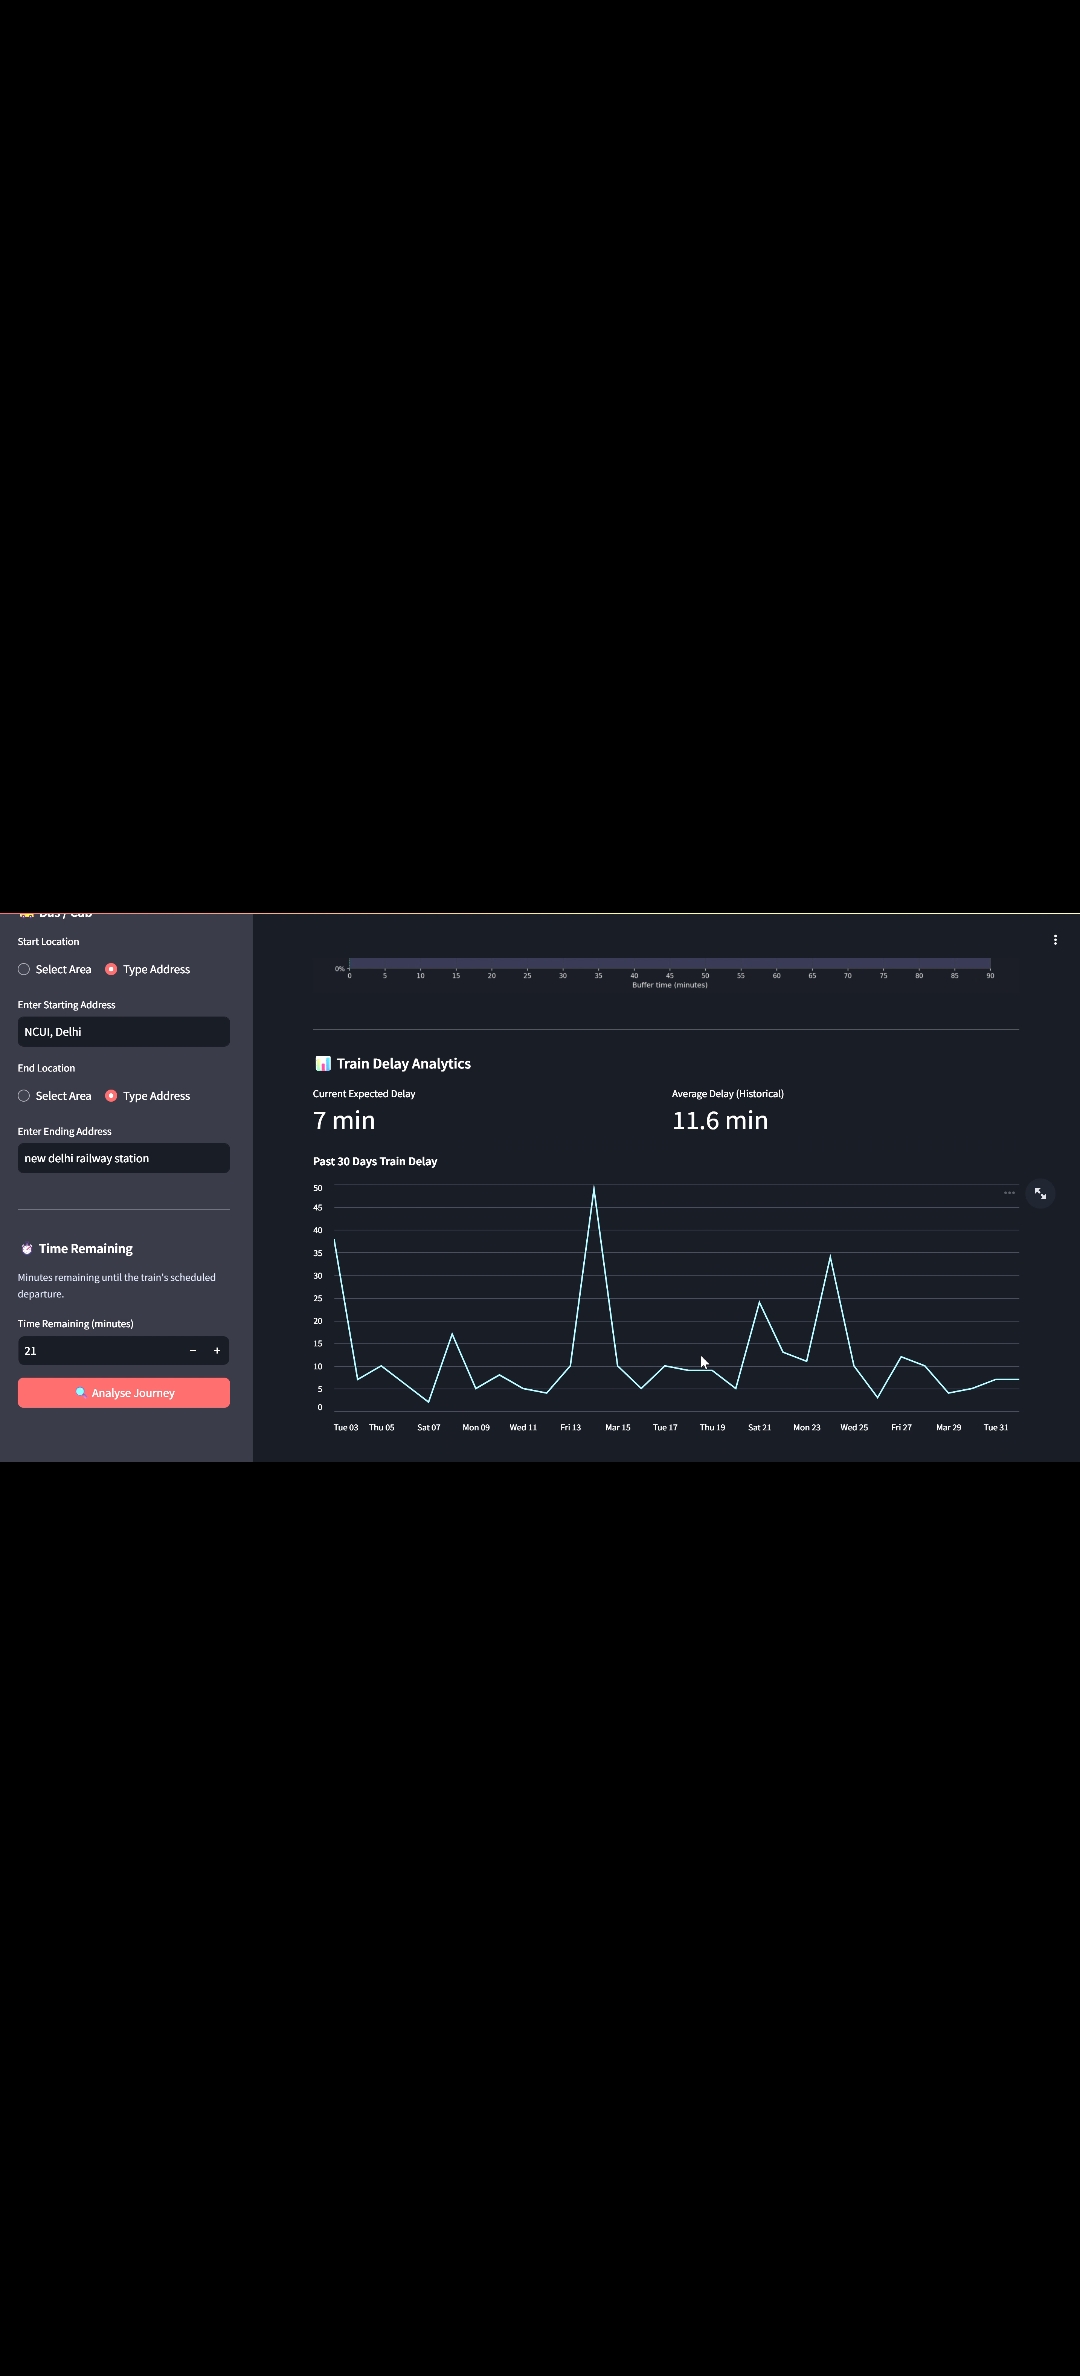
Sidebar input: user searches by station (NDLS), selects train 11077, then enters start and end locations for last-mile routing.
-
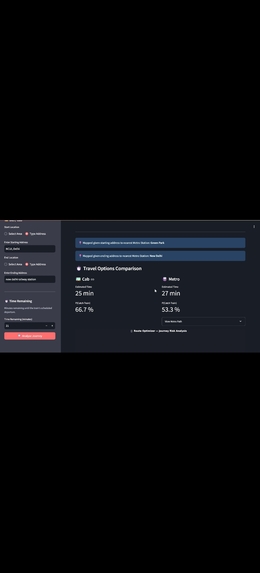
Final recommendation panel: cab wins at 66.7% vs metro at 53.3%, with the metro path expander showing the Green Park → New Delhi routing
-
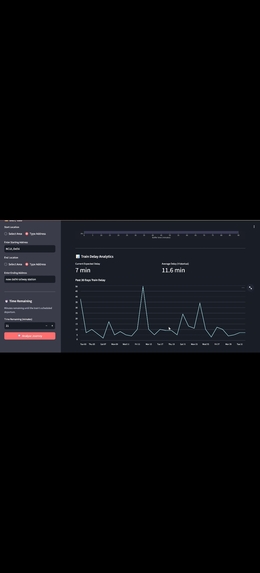
Train delay analytics for the selected train
-
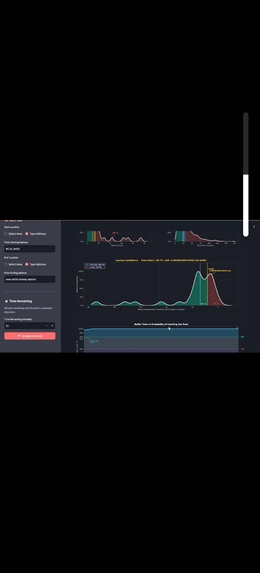
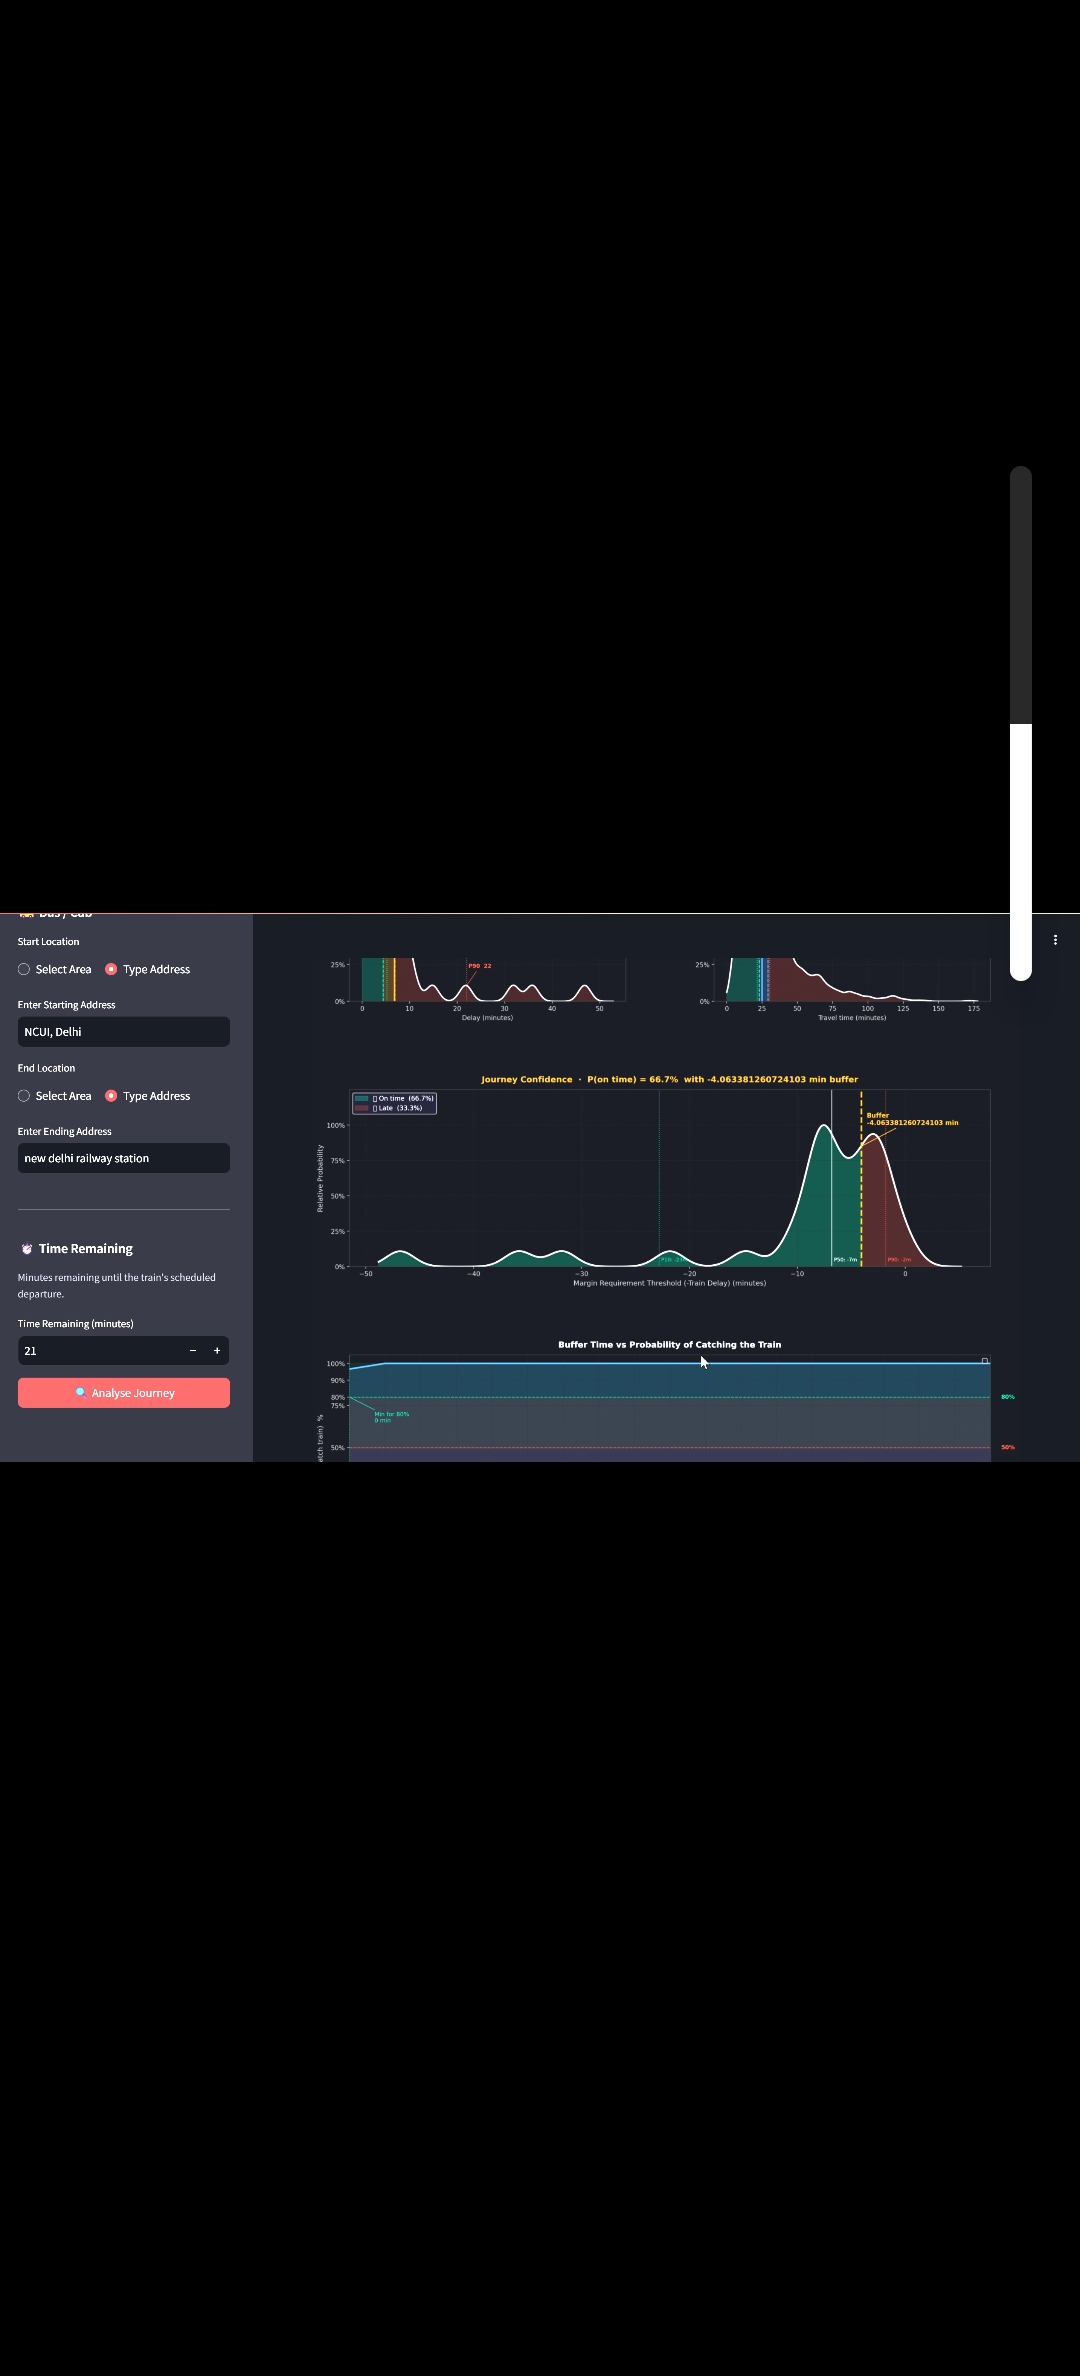
The core output: individual KDEs for train delay.

Inspiration
It started with a missed class.
Coming back from Day 1 of the hackathon, I had a 6:40 PM attendance deadline. Rapido showed 6:37. I booked it. I arrived at 6:45.
That gap wasn't bad luck — it was systematic. Cab apps quote optimistic ETAs. Train delay data is buried in obscure portals. There is no single place that tells you honestly whether you will make it. Every traveller is guessing.
We decided to stop guessing and start computing.
What it does
Rail-Drishti tells you how likely you are to catch your train — not an ETA, but a probability.
It computes:
P(on time via cab)
P(on time via metro)
and recommends the higher-confidence option.
How we built it
This is not a routing problem — it is an uncertainty propagation problem.
Instead of point estimates, every step has a distribution.
We compute:
T_combined = D_train + D_cab
P(on time) = P(T_combined ≤ B)
Where B is your buffer (time remaining minus travel time).
We estimate this using Monte Carlo simulation:
P(on time) ≈ (1/N) Σ [ d_train(i) + d_cab(i) ≤ B ]
with N = 50,000 simulations
Train delay model
- Data from data.gov.in
- Quantile regression at 10%, 25%, 50%, 75%, 90%
- Features:
- Day of week
- Recent delay trends (3-day rolling lag)
- Day of week
We shift historical distributions using predicted median so they reflect tomorrow, not the past.
Routing
- Metro: Dijkstra on Delhi Metro graph
- Nearest station via Haversine distance
- Cab: real-time API
Challenges
The naive approach is wrong
We first tried:
P1 × P2 × P3 ...
This destroys variance.
A train that is late by 2 minutes vs 45 minutes behaves completely differently — multiplication cannot capture this.
Convolution can.
KDE calibration
Historical data ≠ future prediction.
We fixed this by shifting distributions using predicted median.
Compute constraints
- No GPU (Databricks free tier)
- Used:
- lightweight models
- vectorized NumPy simulation
- lightweight models
What we’re proud of
- 50,000 simulation-based probability (not heuristic)
- Real metro routing engine (no API)
- Honest uncertainty modelling
When we say 73%, it actually means something.
What we learned
Uncertainty is the product.
All travel apps give a number.
We give a distribution.
Also:
Recent delays (last 3 days) are the strongest predictor.
What's next
Live train data
Real-time updates to collapse uncertainty
Insurance
If probability < 50%, offer ticket protection
More transport modes
Autos, buses, etc.
Expansion
Mumbai, Bangalore, Chennai

Log in or sign up for Devpost to join the conversation.