-
-
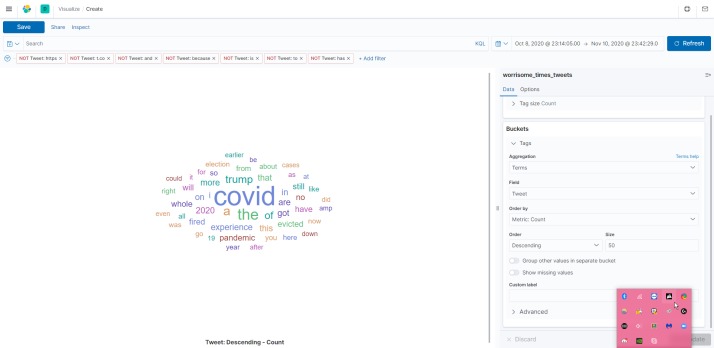
fun in the sun
-
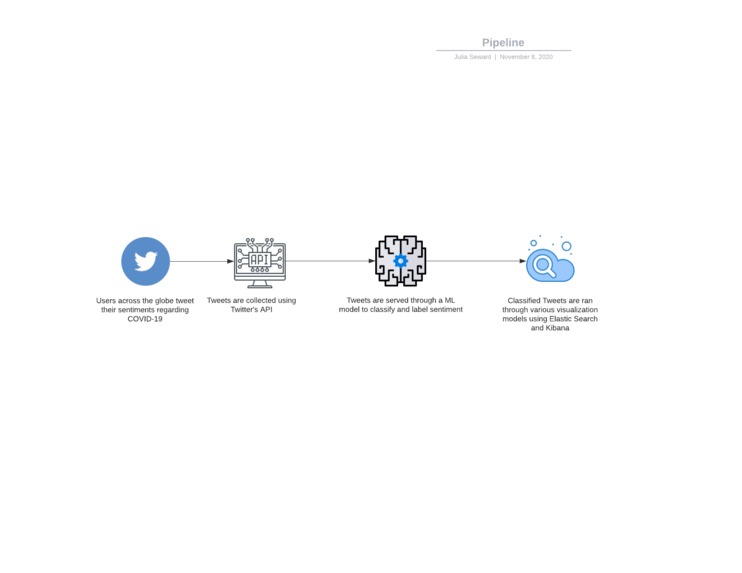
pipeline
-

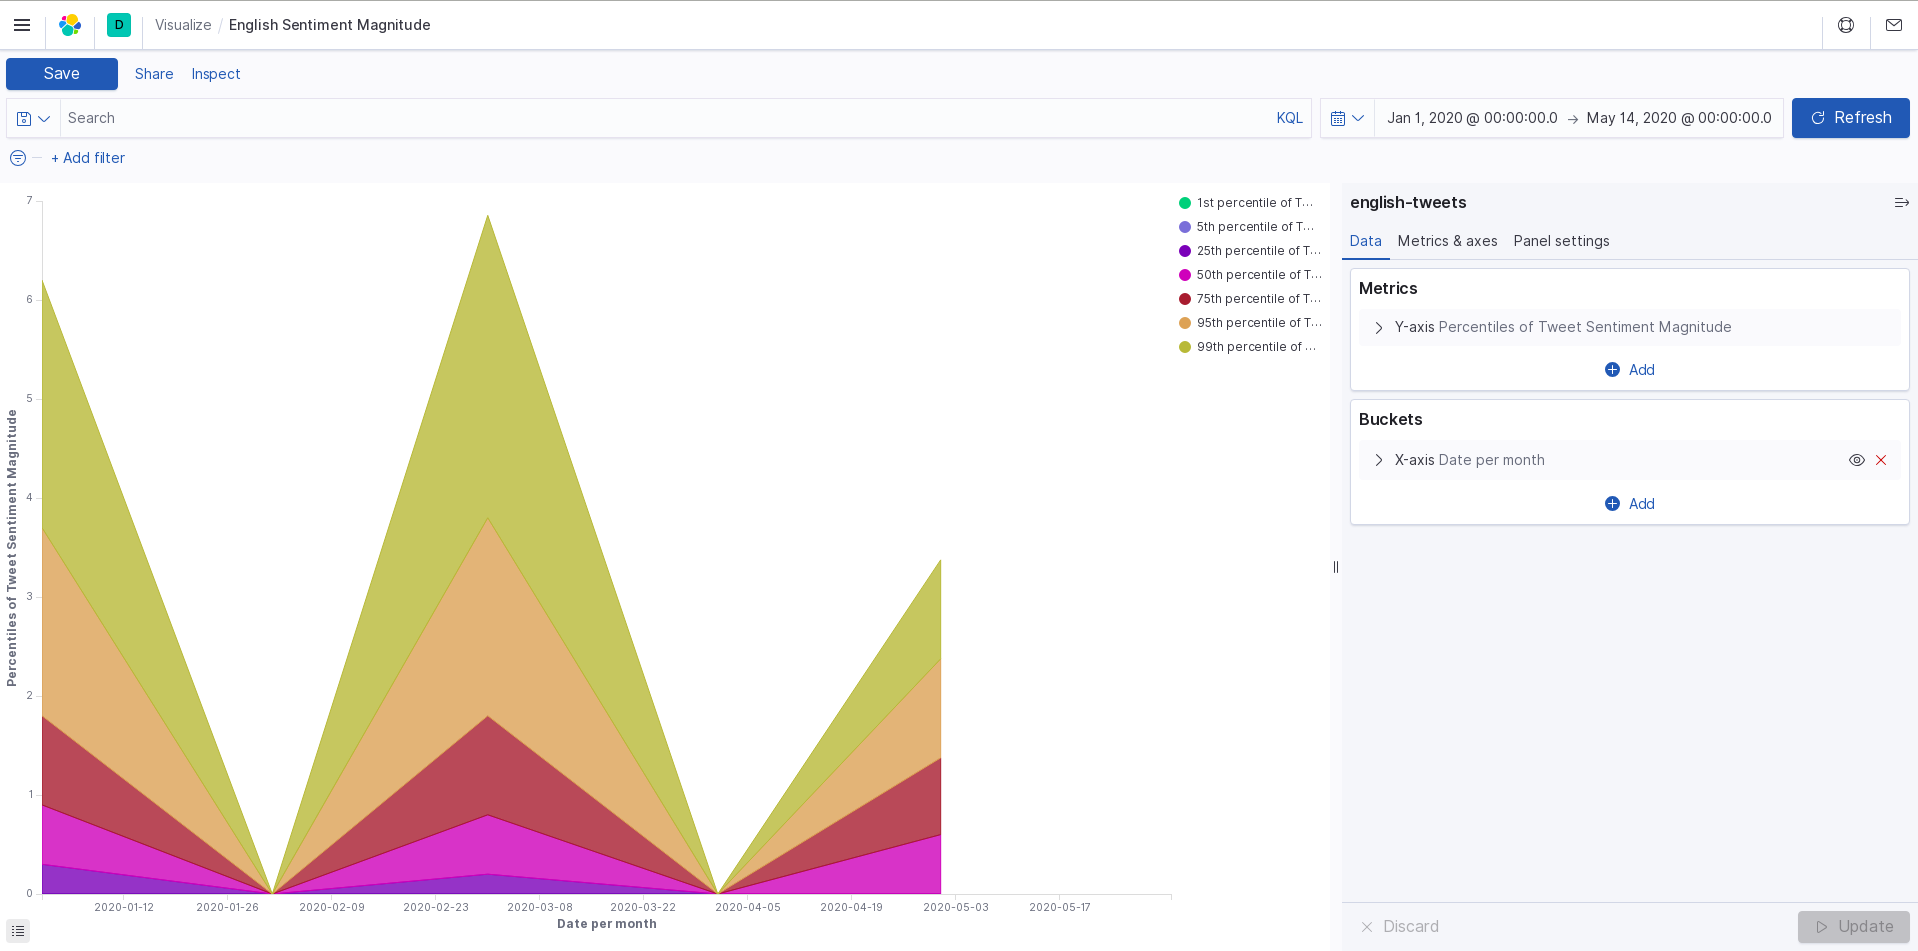
english magnitude
-

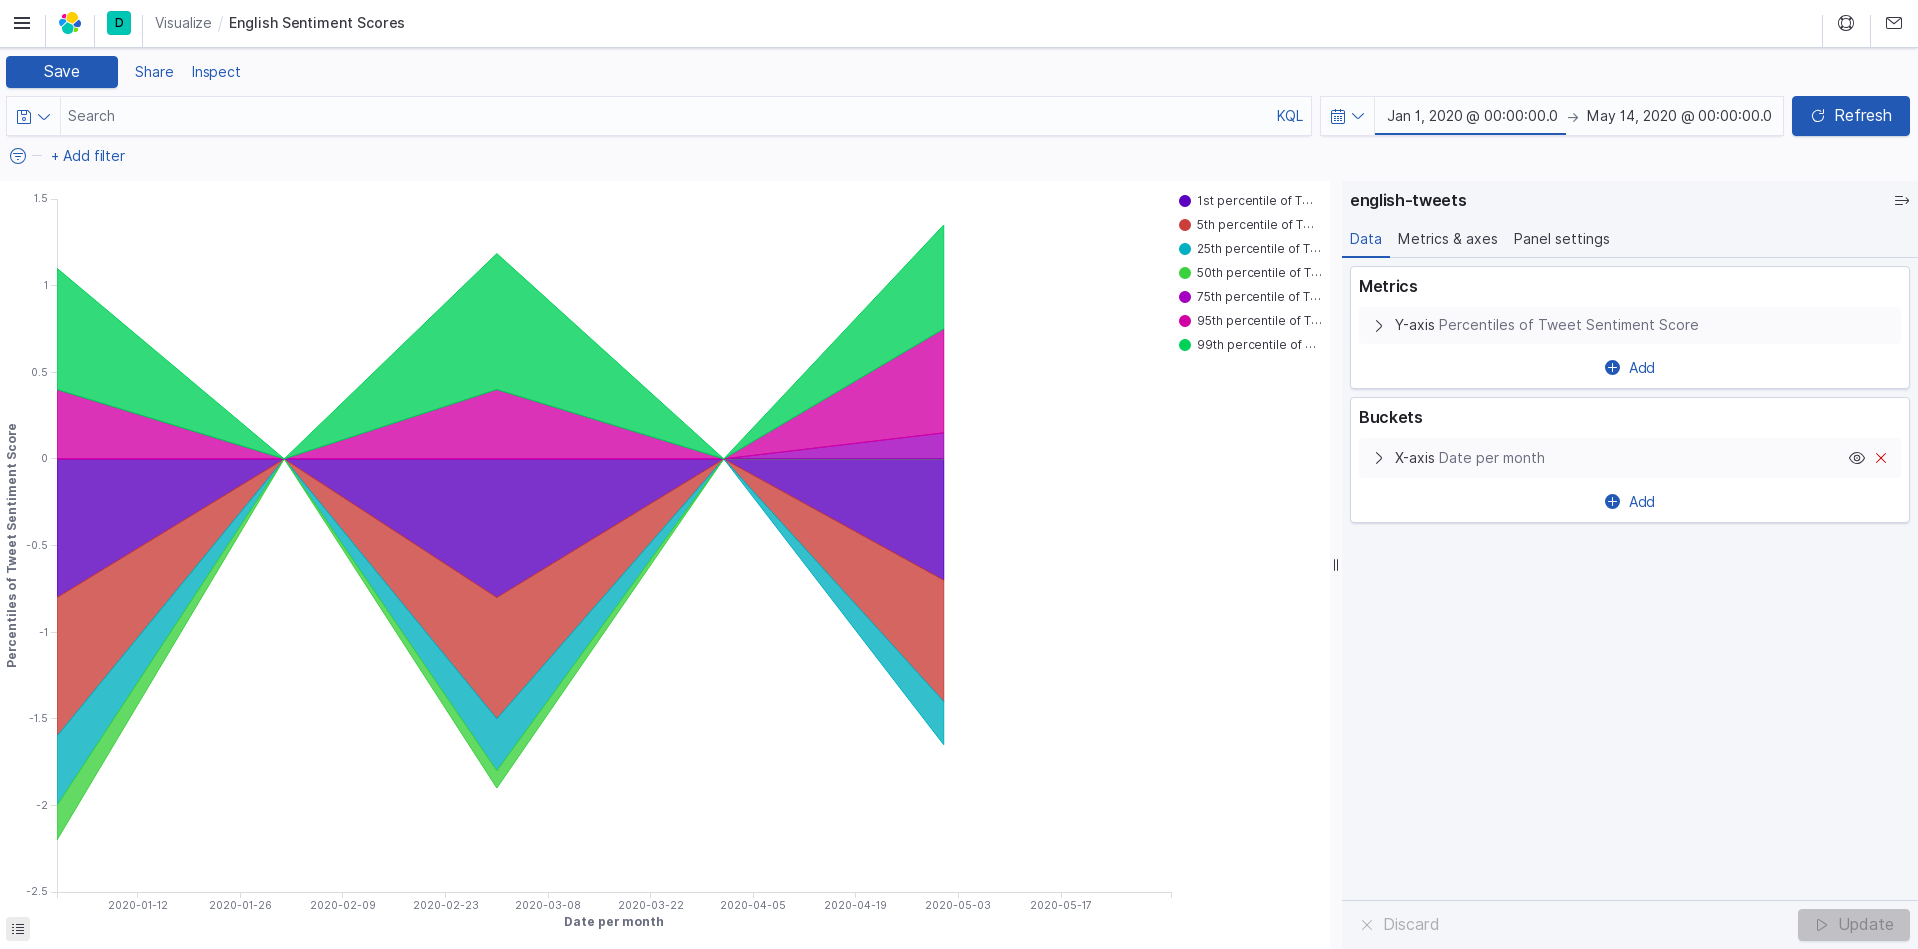
english sentiment
-
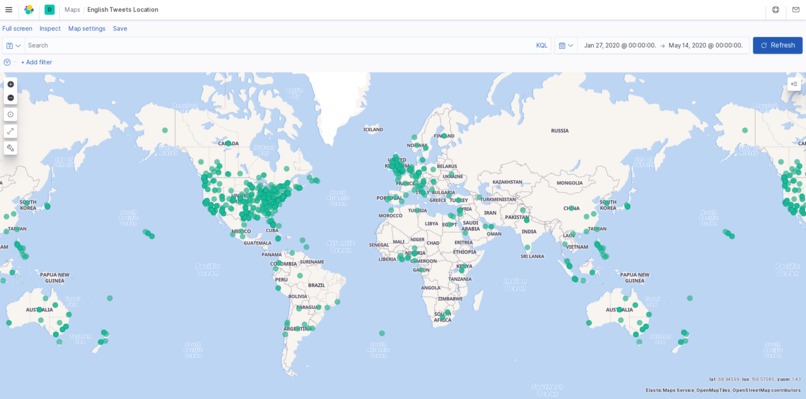
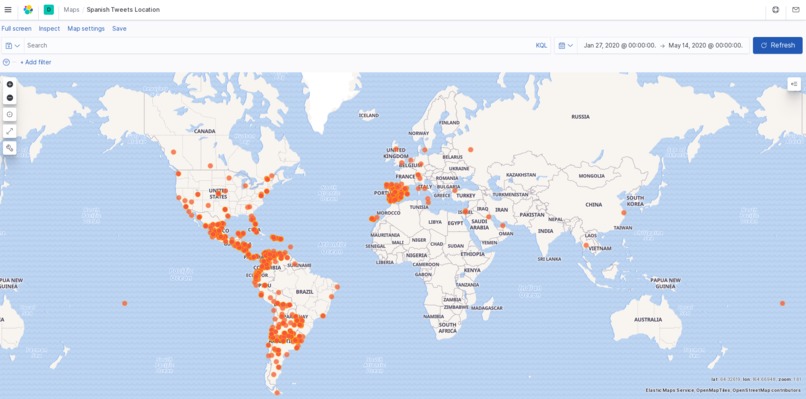
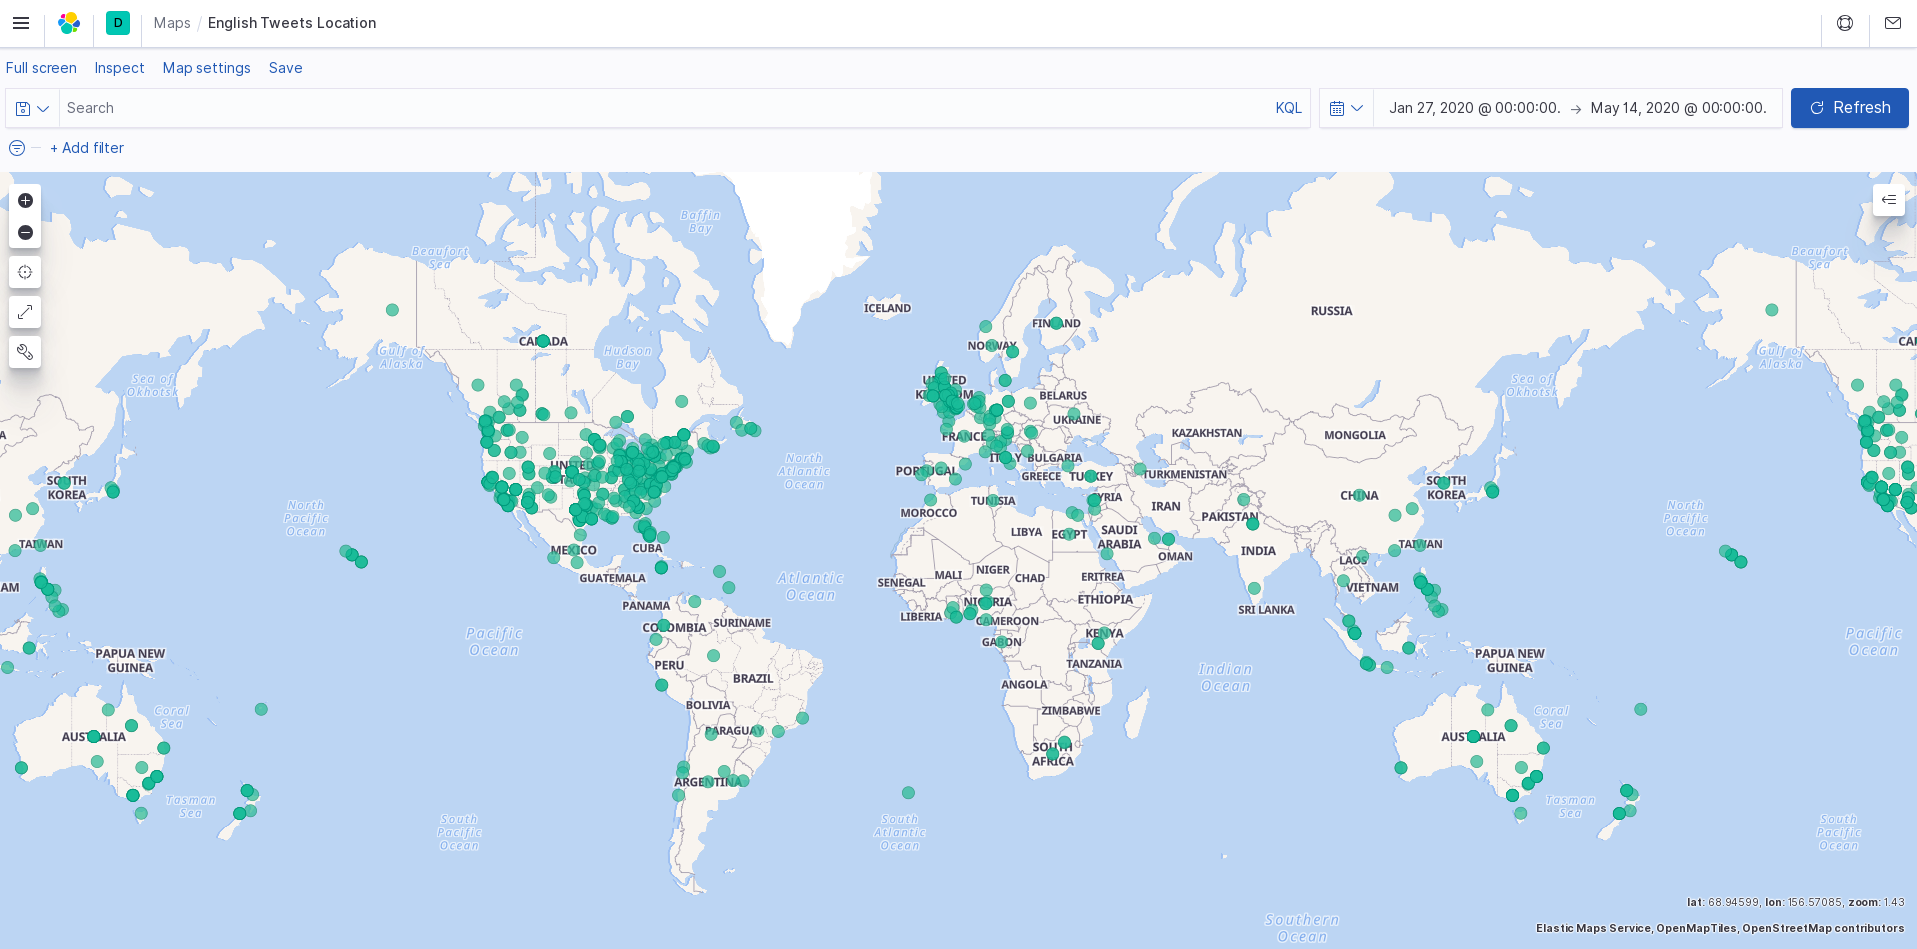
english tweet map
-
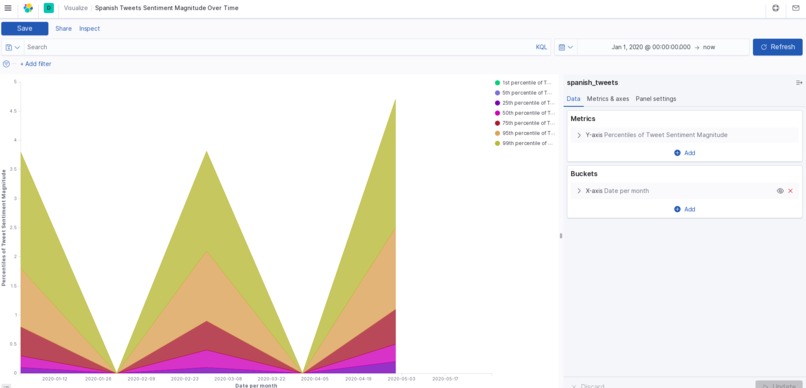
spanish magnitude
-

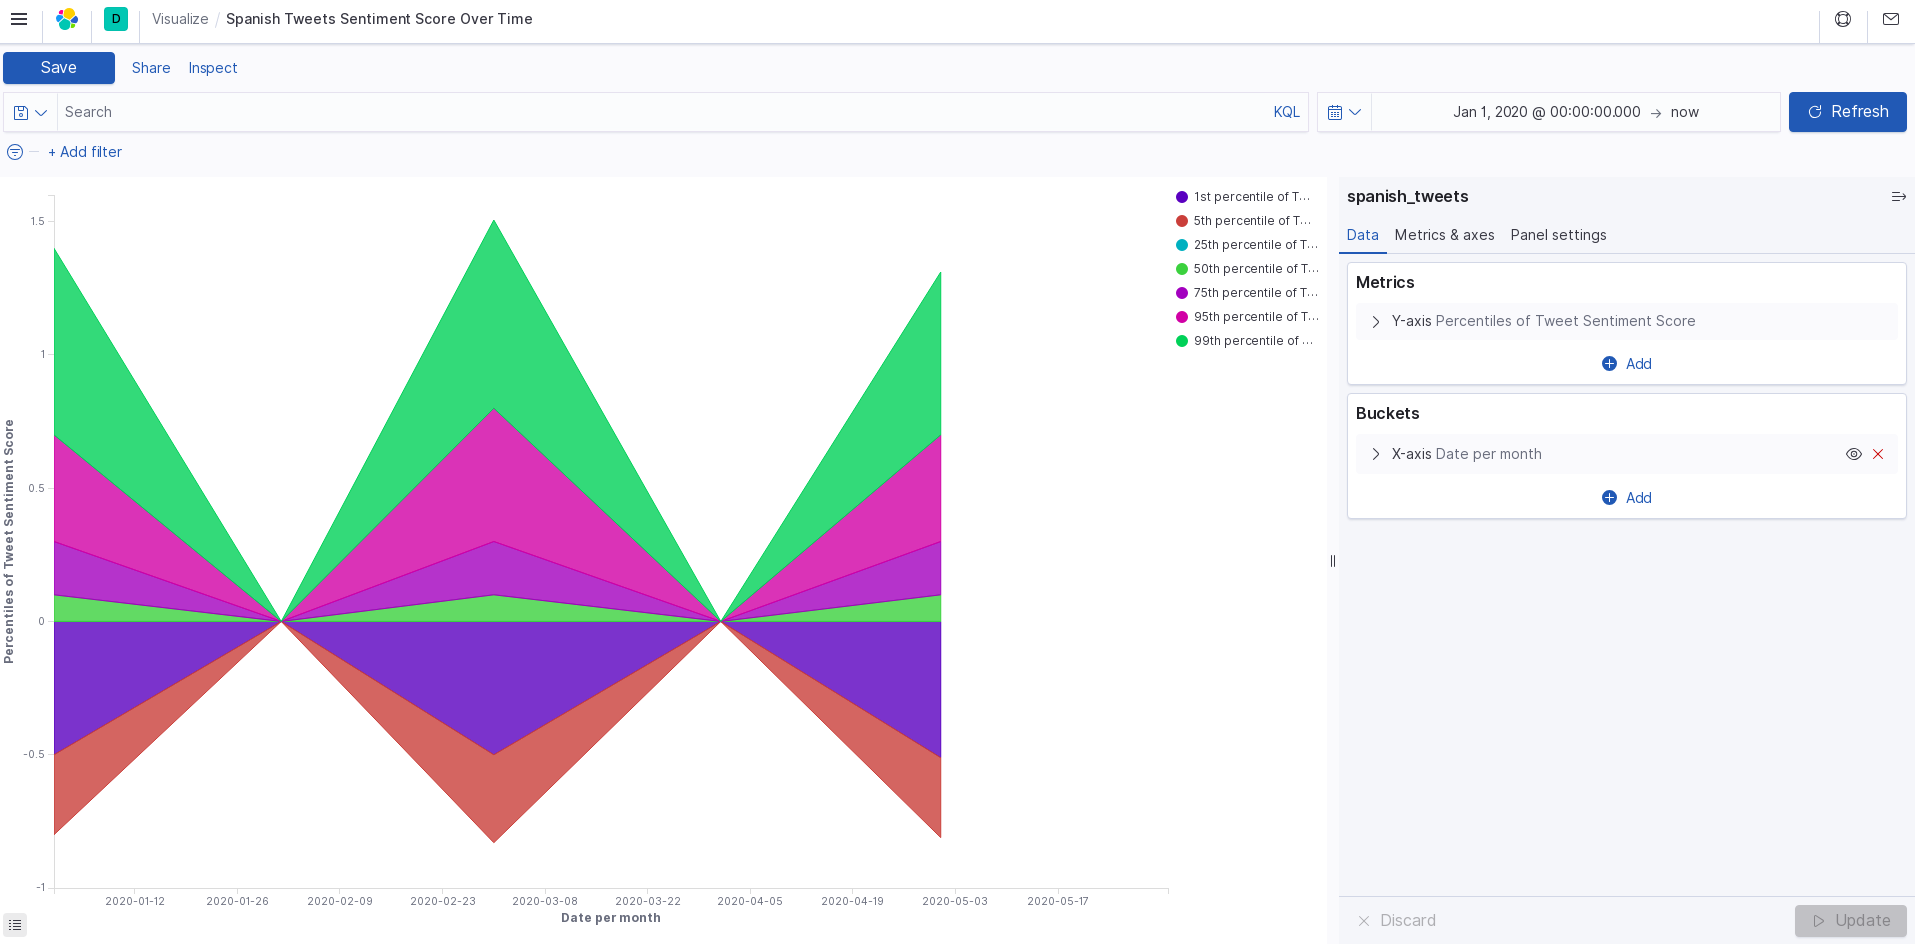
spanish sentiment
-
spanish tweet map


Inspiration
We were interested to see how the conversation about covid-19 has changed throughout the world since January. Twitter is one of the more common places people come together and talk about it. We know that the USA has had a very poor response to the pandemic, and people in the US have a different perspective of the virus as compared to people from other regions and cultures. We thought it could be interesting and useful to have some visualization around how people speaking in many languages have responded to the pandemic.
What it does
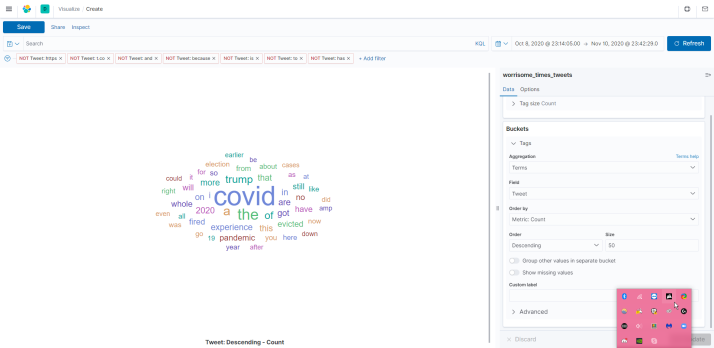
Using the Twitter API and Google Cloud, we search tweets based on keywords relating to the coronavirus, and categorize them by date, location, and language. This data is all exported to a CSV file (one file per language). The tweet text is analyzed for sentiment and magnitude values to score each tweet's overall feeling towards the pandemic. From this data, we use Kibana to create a visualization of the response data.
How We built it
We split up the teamwork so that Rachel was querying for the tweets, and Julia was building the visualization model. The code itself is written in python. Rachel created one script which will collect a current stream of tweets, then looks into older data from January, March, and May. Then this data is sent to Julia whose script will score the sentiment and magnitude values of each tweet. With these numbers, we needed a way to visualize it which is where Kibana would come in.
Challenges We ran into
We discovered halfway through the project that the Twitter API cannot query for tweets older than 7 days. So while we had recent tweet data, we struggled to find older tweets. After much research, we found a python library that can scrape social networks for data via specific query. Rachel found out that Twitter's advanced search feature provided the format for the query string that could be used in the script. We also had some challenges with learning how to use Kibana and understand the sentiment scoring in machine learning.
Accomplishments that We're proud of
We are proud to have worked on a project together. Even if this isn't Best in Show we had a good time with it. We created a gameplan and worked together to solve the problem. We're proud of everything we learned and the fact that we kept our heads together.
What We learned
We learned a lot about the Twitter API (what it can and can't do) and about the sentiment scoring system. As a result, we were able to think of a bunch of new applications for the project we made.
What's next for Unprecedented Tweets
There's a lot of different directions we could take this. With more time, we could expand this data query to many different languages, scoring their text values the same way as we did for English and Spanish. From that, we could make a worldwide graph of peoples' responses to the pandemic. We can also expand this project into new territory. We discussed using this as a way to analyze a user's tweets and see how friendly or open that person may be. People could use something like that to easily avoid or block users who are racist, sexist, homophobic, etc without having to manually analyze a person's twitter account themselves. Also, depending on what other social media's API's are capable of, this same technology could be expanded to Facebook, Reddit, Instagram, etc.
Built With
- elasticsearch
- google-cloud
- google-places
- kibana
- powershell
- python
- textblob


Log in or sign up for Devpost to join the conversation.