-

State of the Taco Address
-
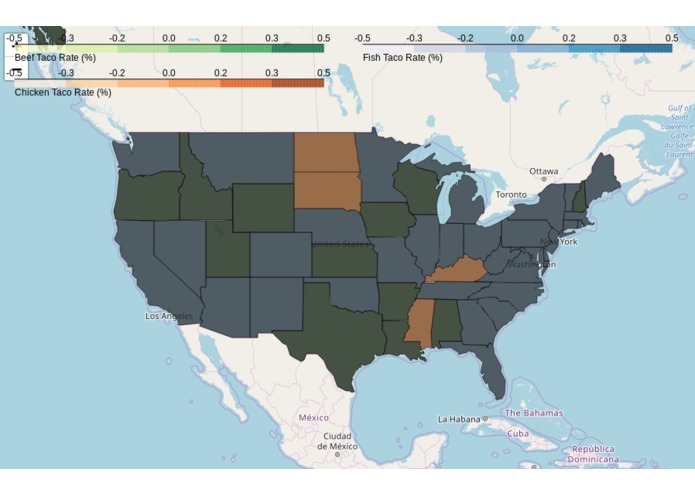
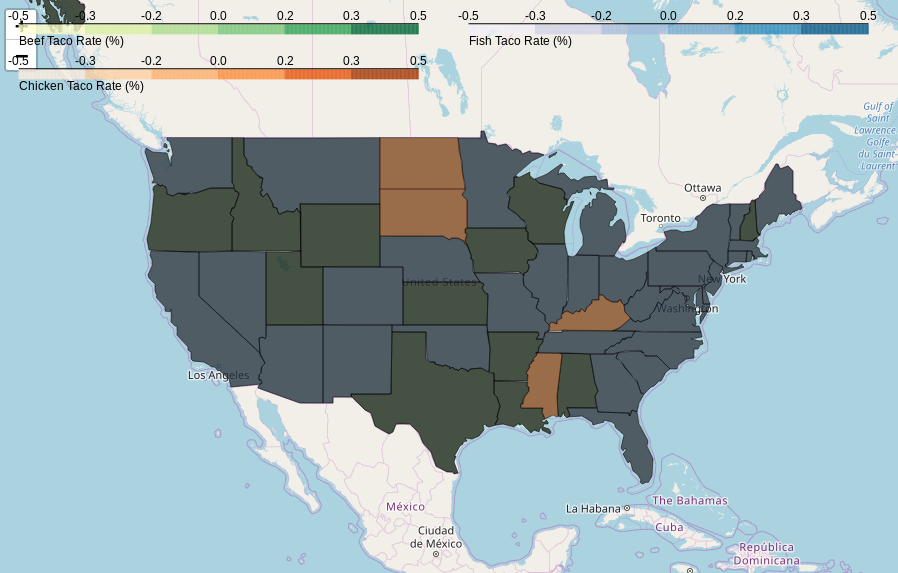
States by Taco Protein
-
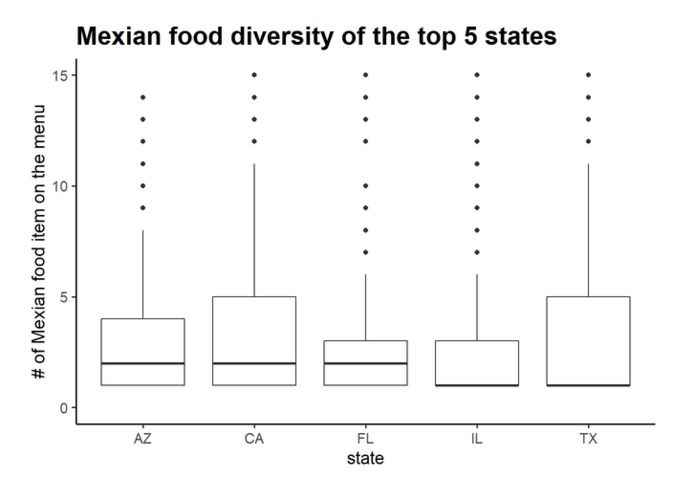
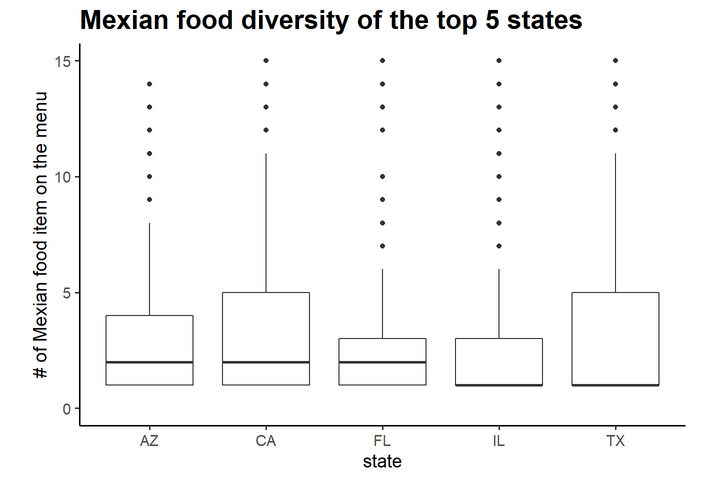
Variety of Mexican food of the top 5 states
-
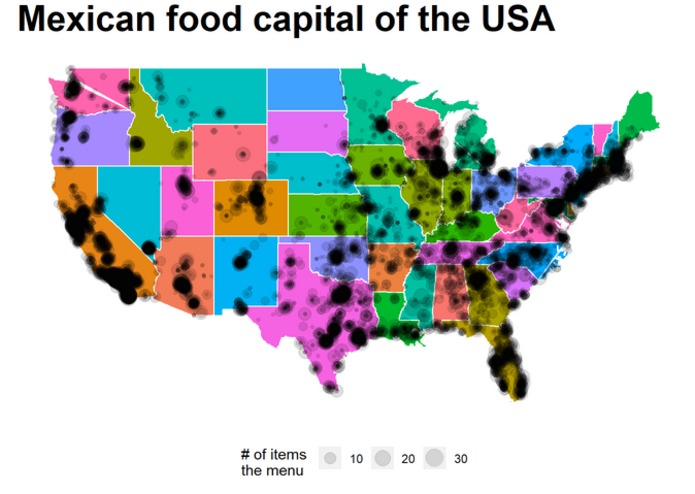
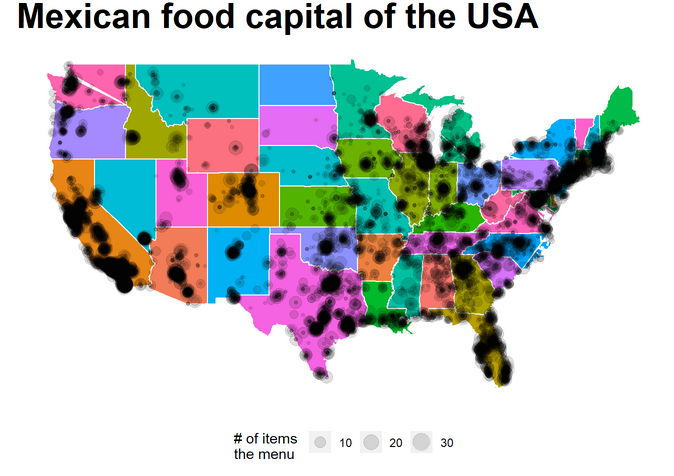
Mexican food capitals of the USA

Inspiration
We all love tacos and Mexican Food. Seeing the taco dataset inspired us to delve deeper into the state of the taco culture in the United States
What it does
Our statistical analysis gives us the answer to what states are the best to go to for each type of protean based on how many taco items are available from our dataset. We also included thhe diversity of food items in metropolitan areas, and a statistical analysis of Mexican Food diversity in the top 5 taco states.
How we built it
We used a data filtering and enhancement pipeline written in python as well as R to interpret and clean the data we were provided.
Challenges we ran into
We ran into numerous problems with the structure of the data that we were able to get past with programmatic analysis.

Log in or sign up for Devpost to join the conversation.