Inspiration
If you are a store owner / manager you probably want to get some insights on your customers, stock or revenue. We would like to give you some of these, but we don't want you to have to look at boring and overloaded tables, we want you to look at nice, clean, animated data stories which show you just the important information at a glance.
What it does
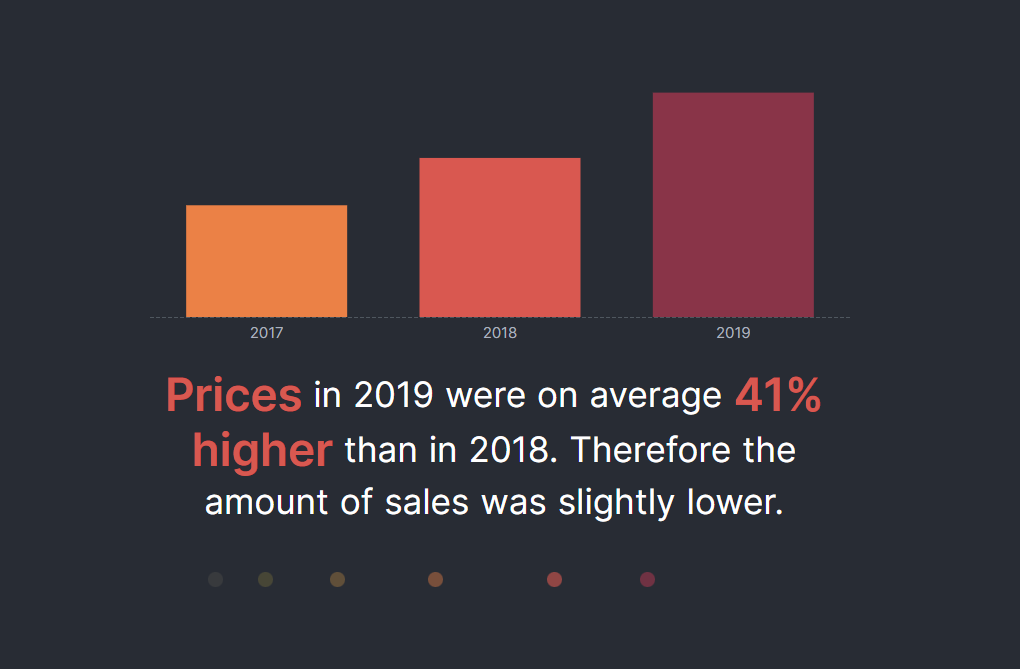
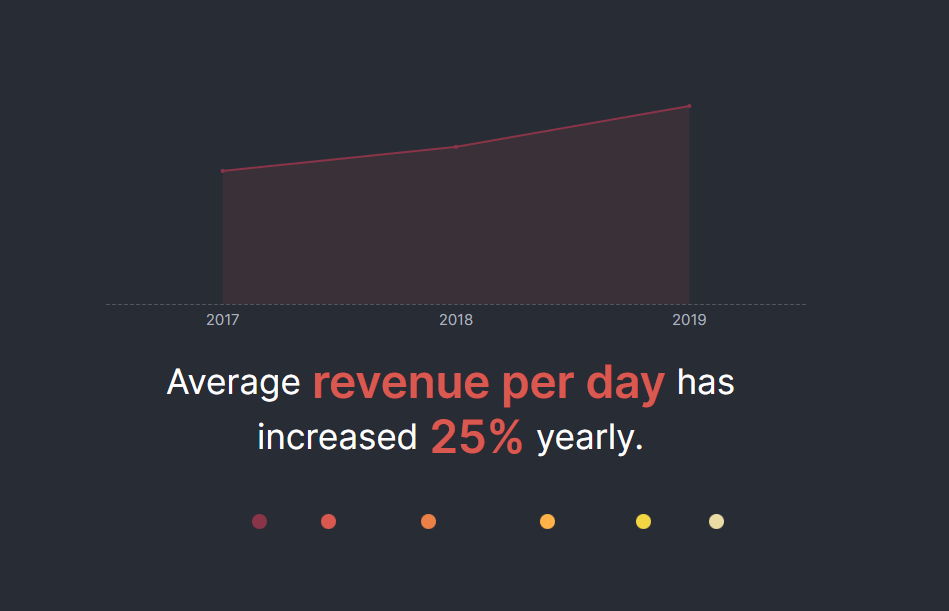
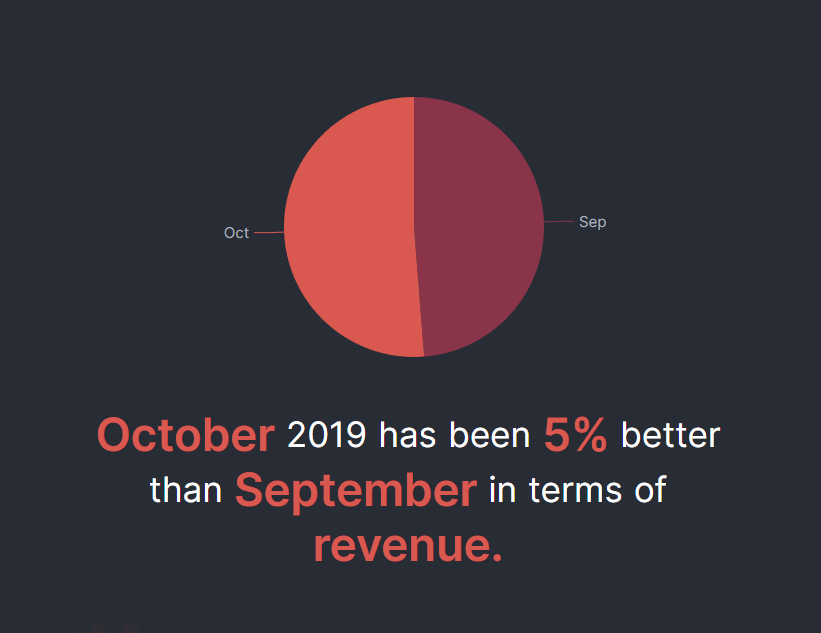
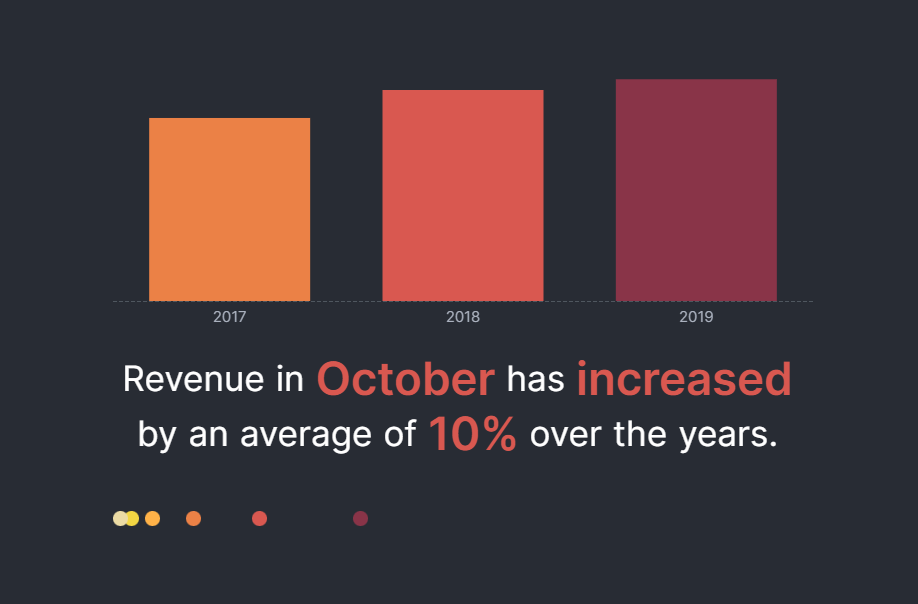
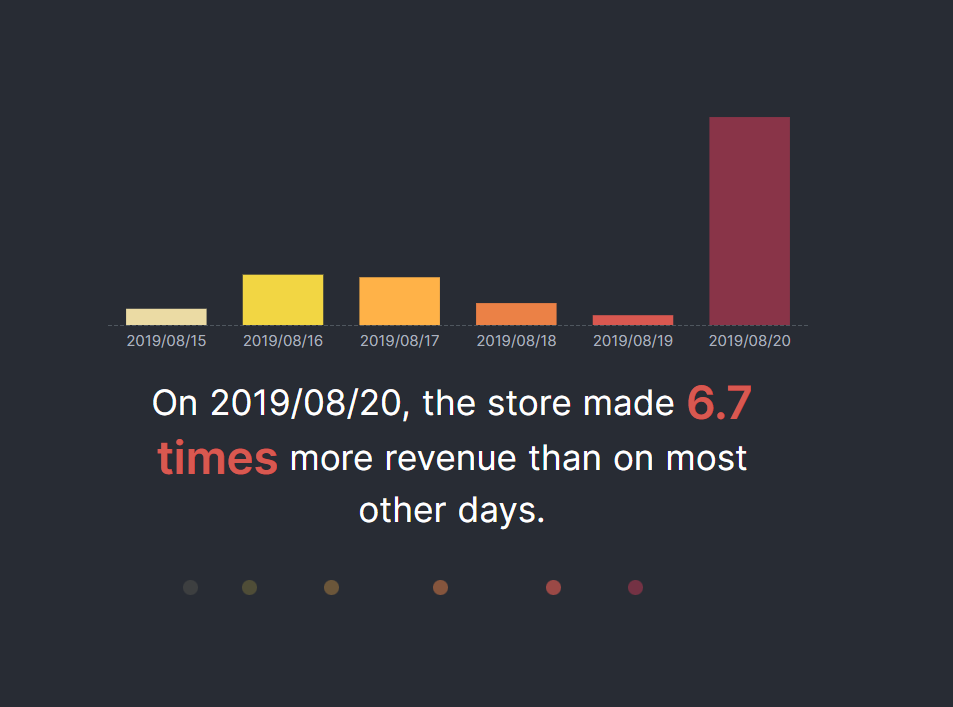
We try to find helpful and meaningful insights based on the stores sales data and present it in a few animated data stories. A story is reduced to a statement combined with a heavily reduced chart containing data for context. All of this should help you as a store owner / manager / employee to see and understand the important information in just a few seconds.
How we built it
We take the CSV tables and analyze them with python to extract the most important and interesting parts of the information out of it. For that, we had to rearrange, combine and isolate information to get the interesting parts. Then we use the findings to create animated data stories which you can access easily on our website.
Challenges we ran into
The first challenge for a few team members was the fact, that we never really worked with python before. Fortunately though, we also had team members with more experience in that field. Another challenge we run into is the part where you try to extract interesting and meaningful information out of huge datasets. It’s a lot of testing how you could arrange the information so that you get an interesting new understanding.
What we learned
We all improved our python skills and got an insight into data analysis and how you work with large datasets.


Log in or sign up for Devpost to join the conversation.