-
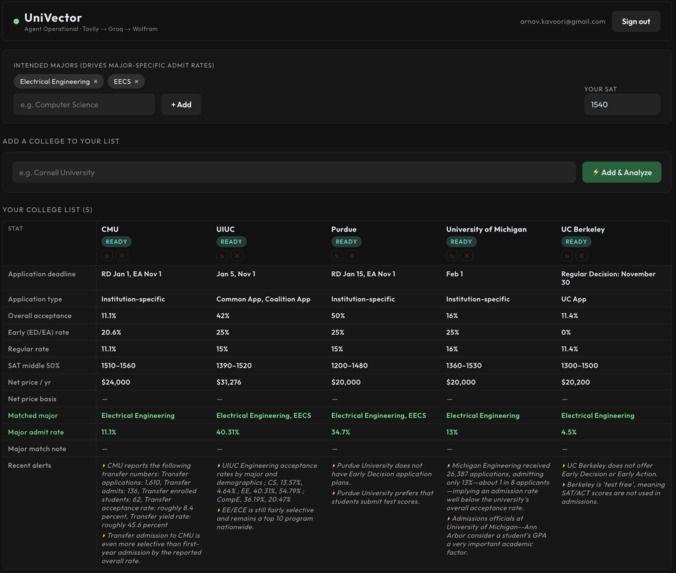
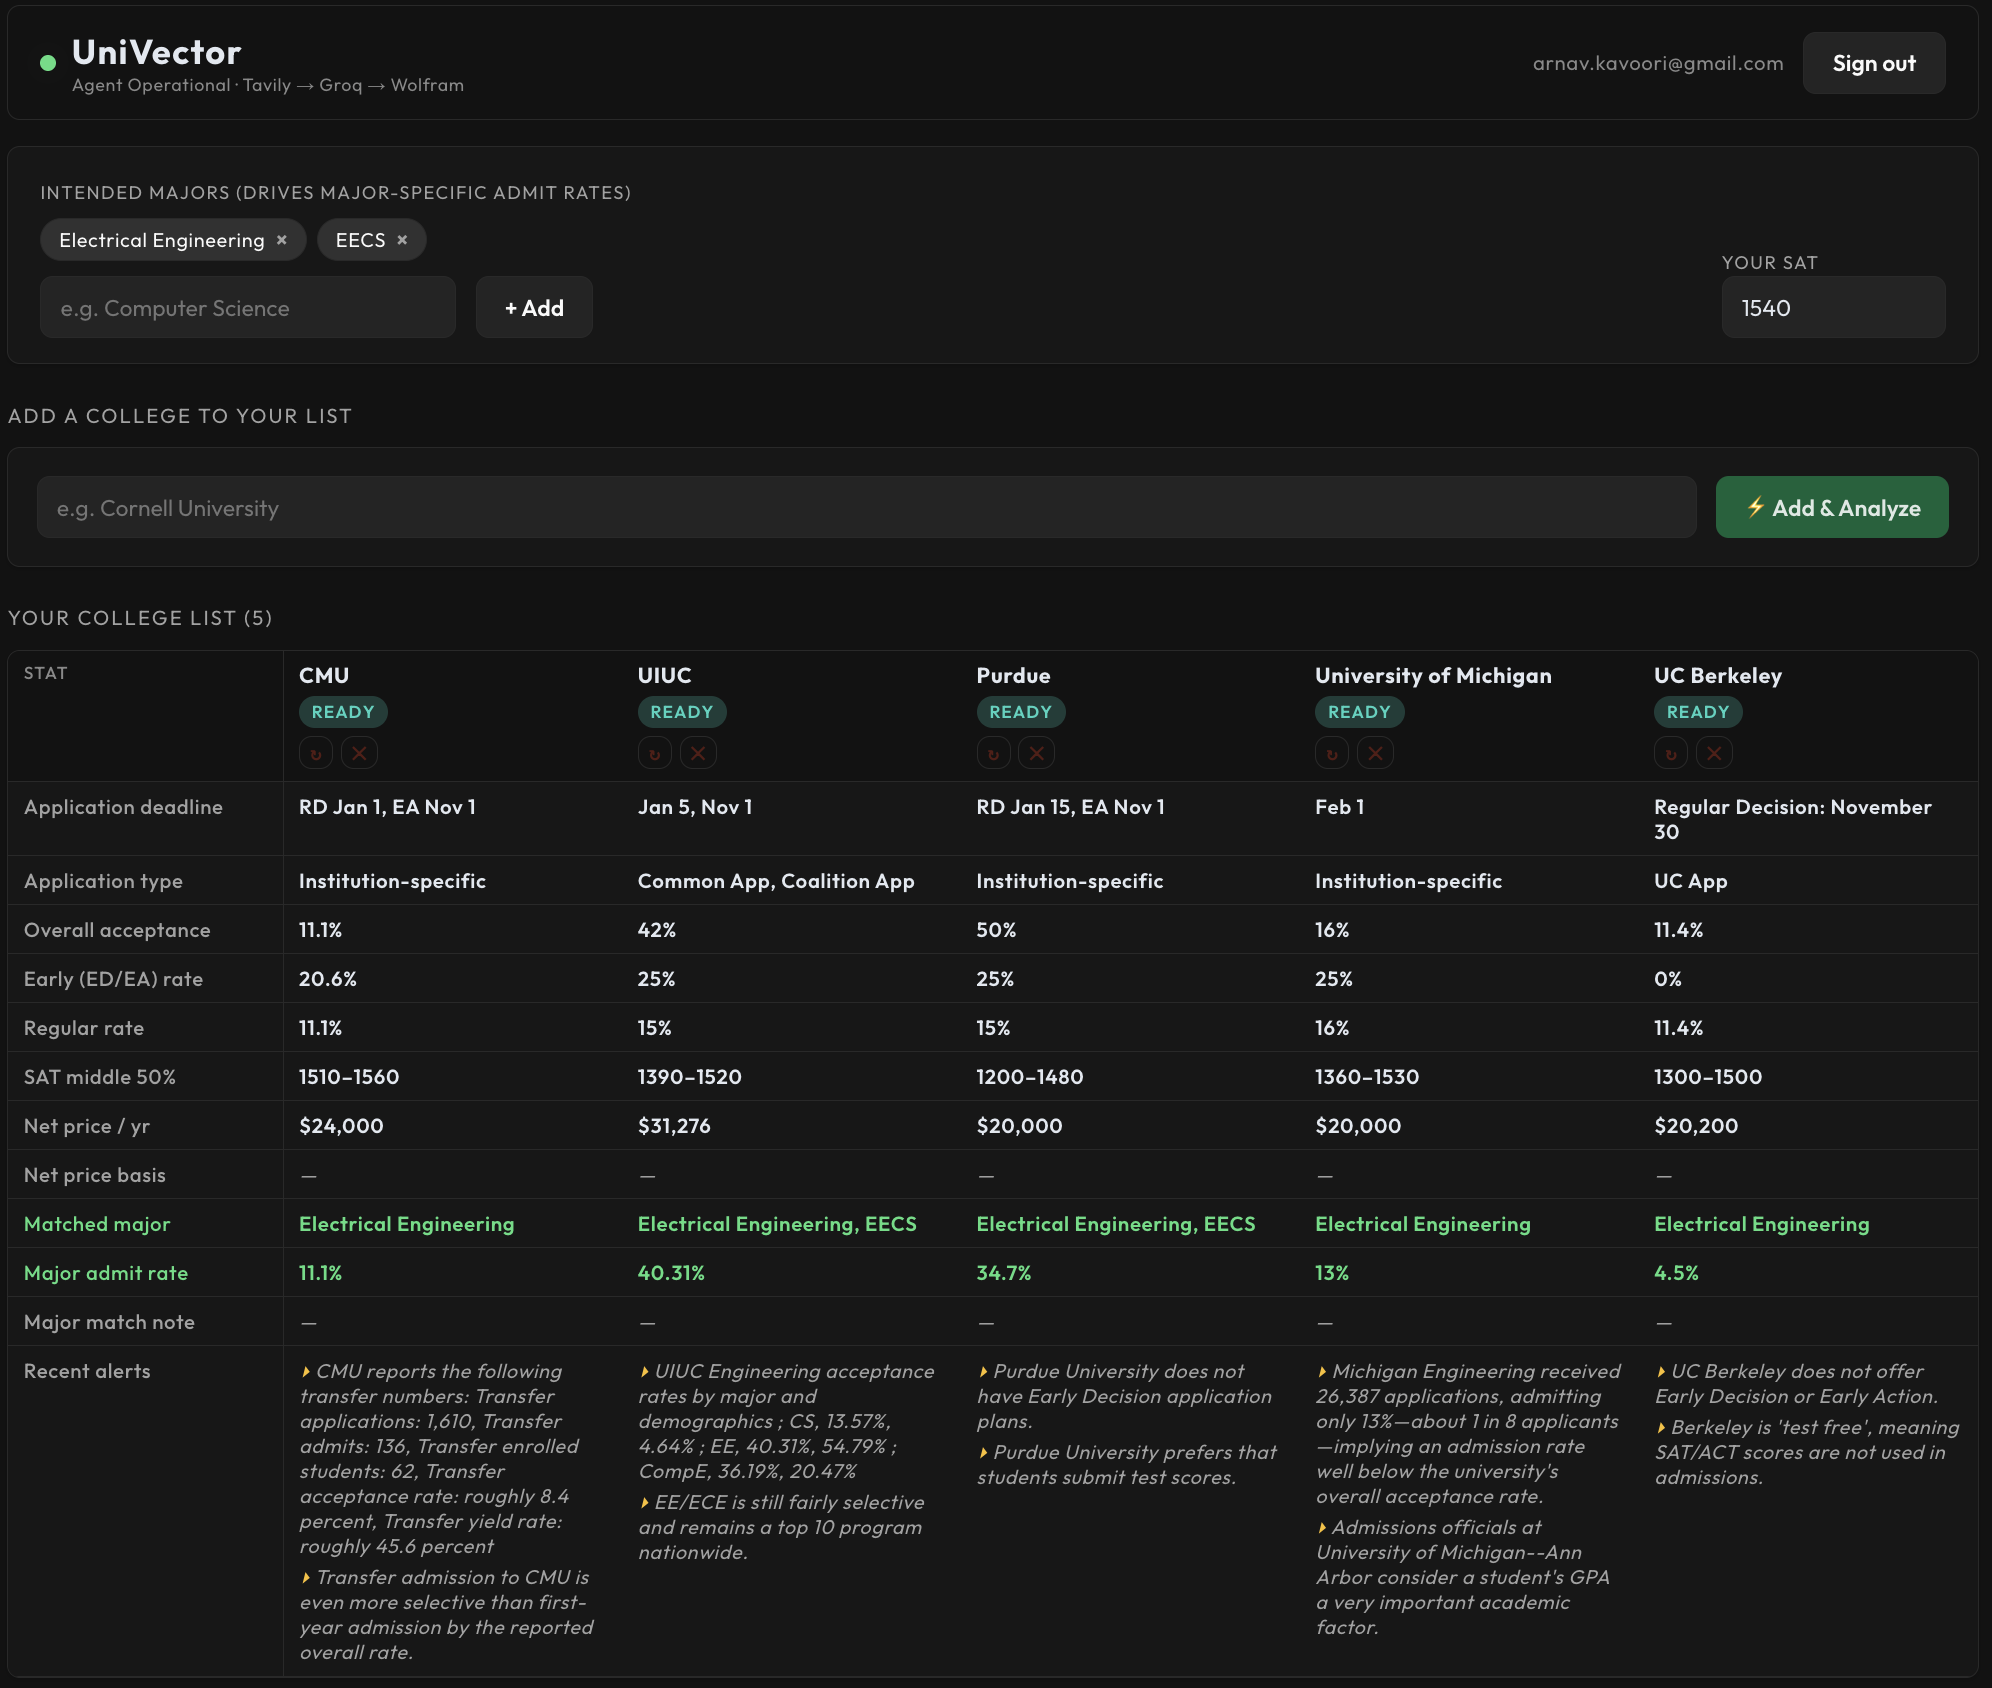
Table of auto-generated values based on inputted college names
-
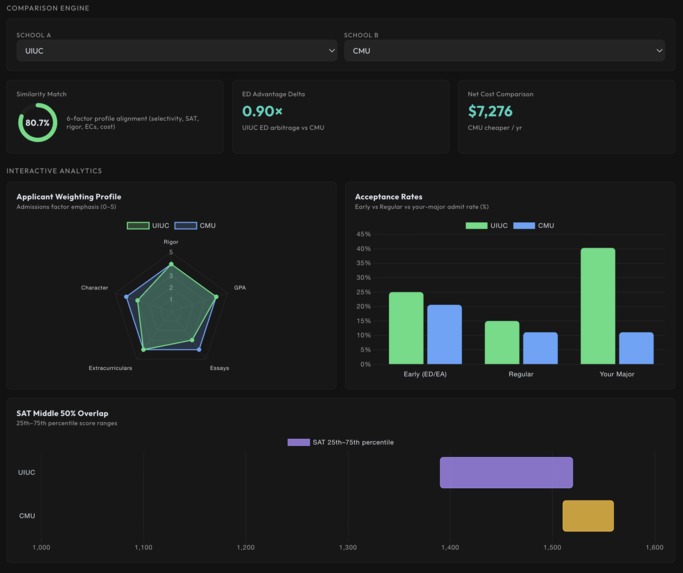
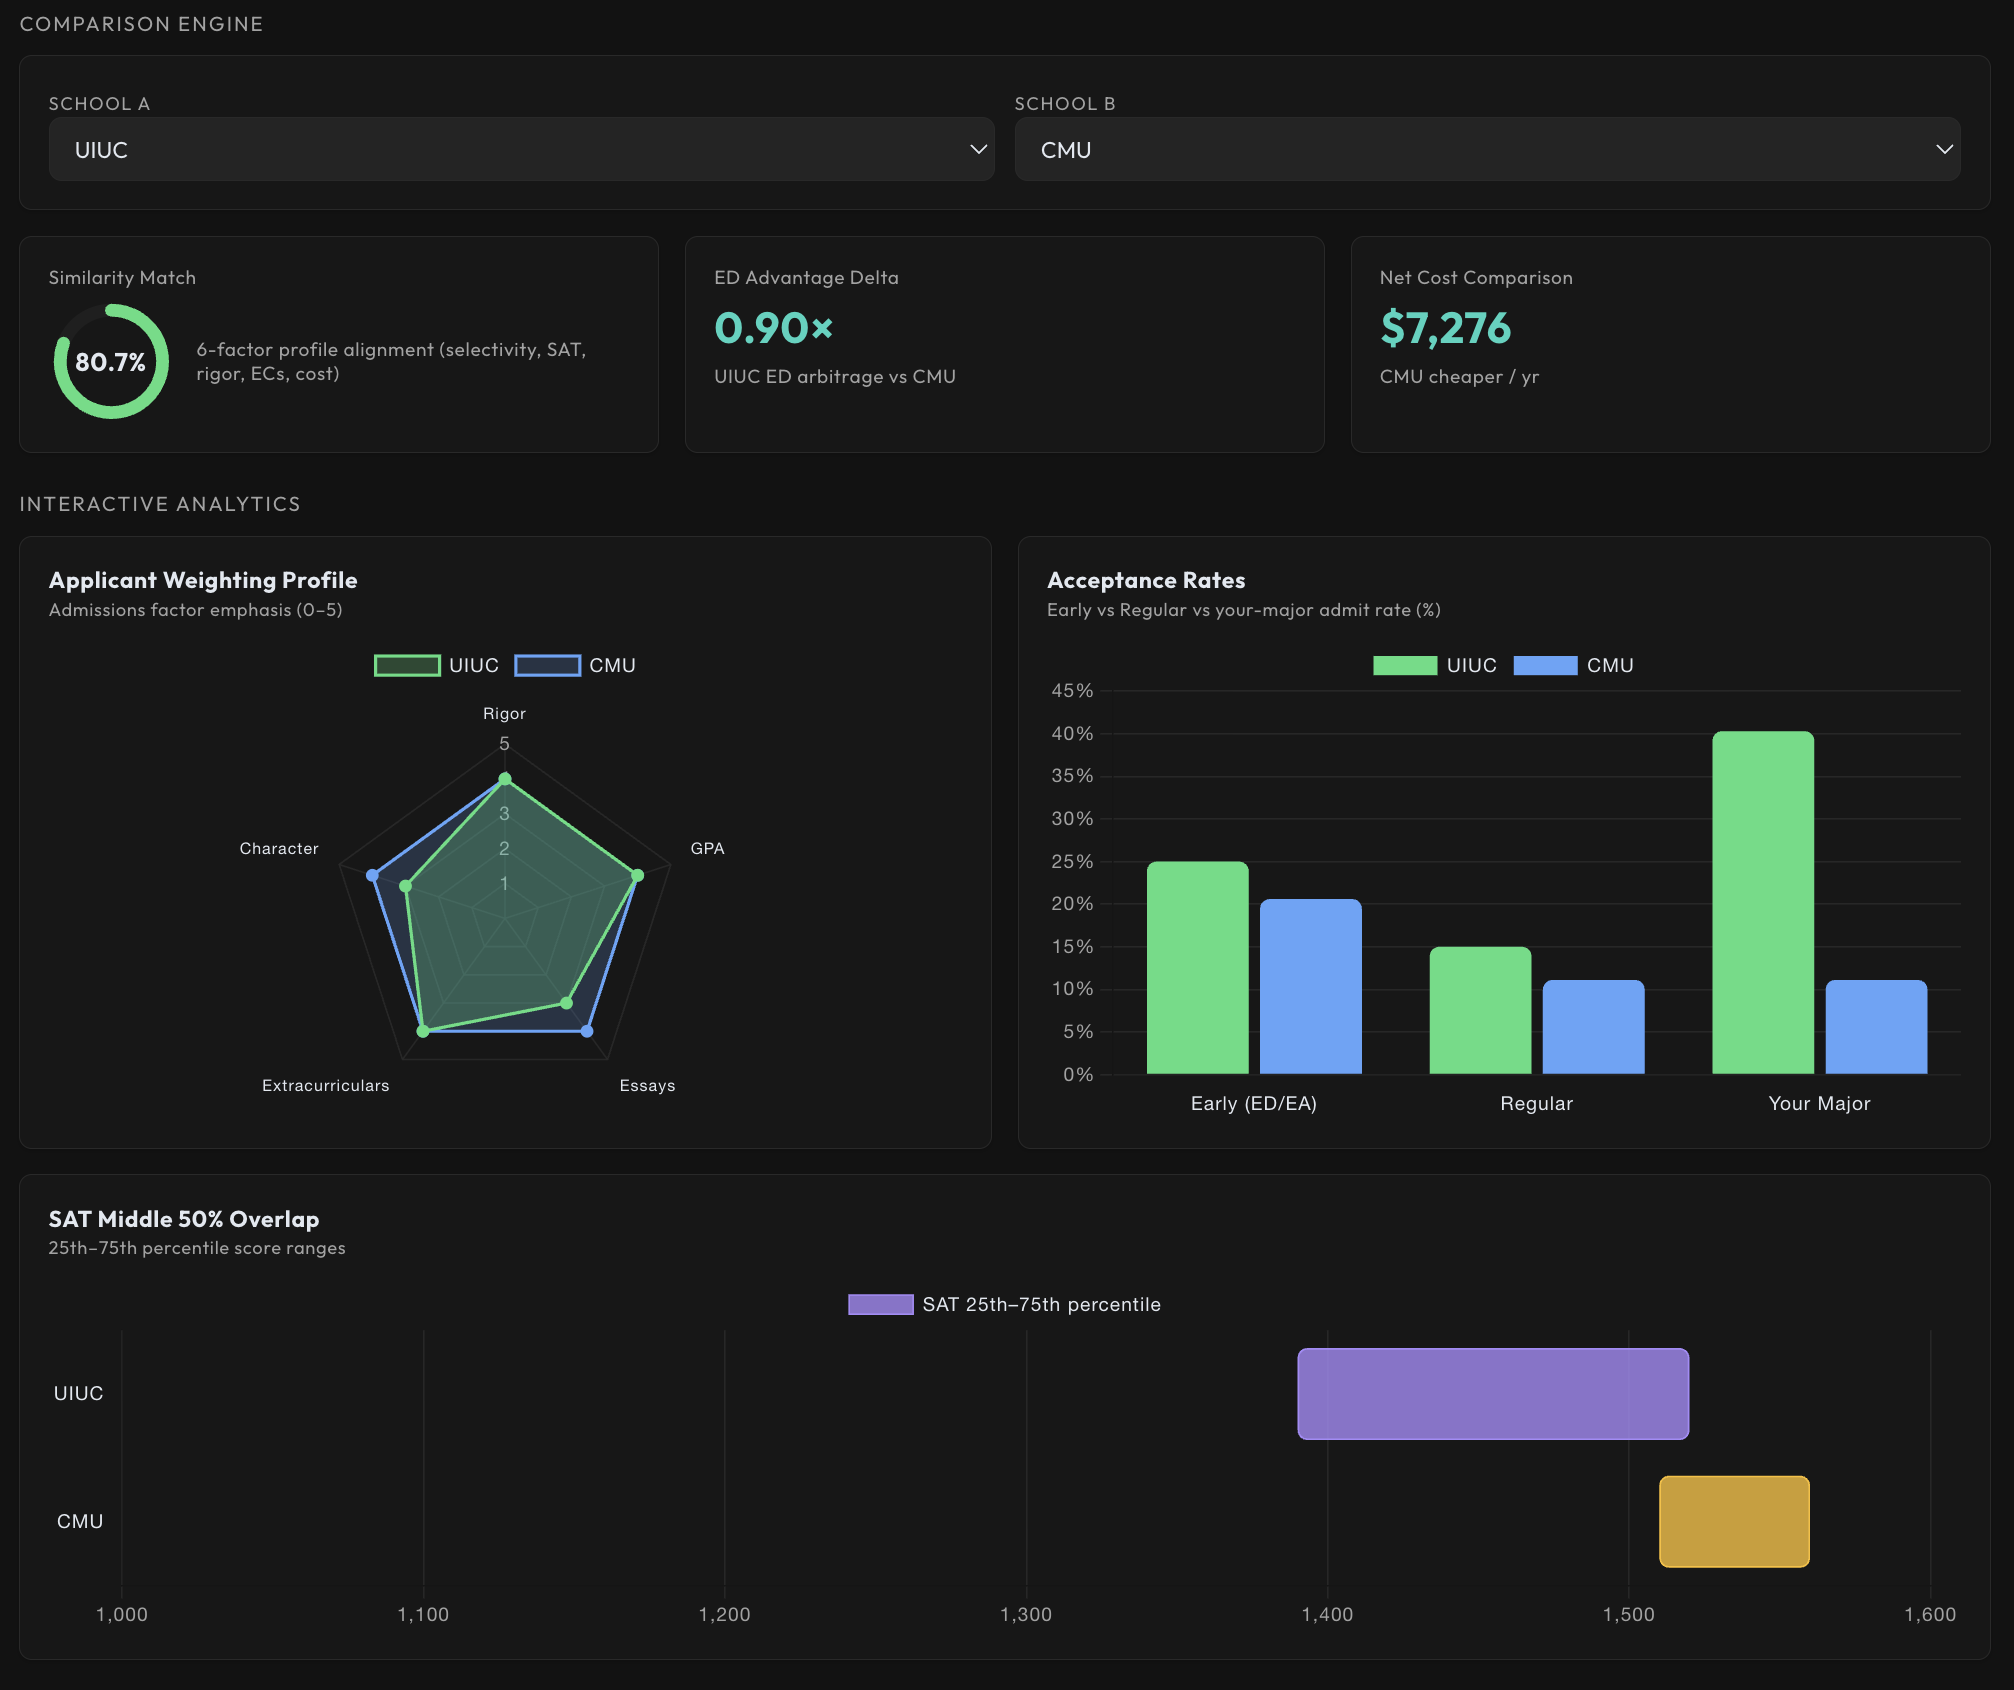
Comparison engine between UIUC and CMU
Inspiration
Applying to college means drowning in tabs. For every school you have to dig up the Common Data Set, hunt for the application deadline, figure out whether it's Common App or a UC/CSU portal, and; hardest of all; find out how selective your specific major is, since "Computer Science" at one school can be a direct-admit bloodbath while "General Engineering" next door is wide open.
We wanted to collapse that entire research grind into one action: type a school name, and an AI agent does the research for you, then makes every school on your list instantly comparable.
What it does
UniVector is an autonomous college-intelligence dashboard.
- Add a college --> an agentic pipeline researches it live and streams its progress to a terminal, then fills in a full stat profile: application deadline, application type, overall / early / regular acceptance rates, SAT middle-50%, net price, and a major-specific admit rate matched to your intended majors (or the closest real program that school actually offers).
- Compare any two schools with a cosine-similarity match score, an Early-Decision "arbitrage" multiplier, and radar / acceptance / SAT-range charts.
- Everything is live and per-user, sign in, set your majors, and your list updates in real time as the agents finish.
How we built it
Frontend: React + Vite + Chart.js, styled with a token-based design system.
Backend: Convex for the database, authentication, reactive queries, and, critically, scheduled actions that run the agentic pipeline.
The pipeline (a Convex Node action) runs per college:
- Tavily searches the live web three ways: Common Data Set stats, the school's real program list, and major-level selectivity.
- Groq (
llama-3.1-8b-instant) extracts that unstructured text into a strict, typed JSON schema, including matching the student's interest to the school's actual program naming (e.g. Purdue/UIUC use ECE, not EECS). - The result is written back to Convex, and the UI updates instantly.
Instead of Server-Sent Events, we stream the agent's telemetry through a reactive Convex query: the action writes log rows, the client subscribes, and the terminal animates itself.
The math. Raw cosine similarity failed us here: every school's feature vector lives in the positive orthant with rigor, SAT, and EC components all clustered near the top of their range, so everything scored ~0.98 similar. We switched to a feature-scaled Euclidean similarity.
Each school is encoded as a 6-D vector, overall selectivity, early-decision rate, median SAT, rigor emphasis, extracurricular emphasis, and net price, with every feature min–max scaled into [0,1] against realistic bounds so differences actually register:
$$ \hat{x}_i = \frac{x_i - \min_i}{\max_i - \min_i} $$
Similarity is then 1 minus the normalized Euclidean distance between two schools, keeping the score in [0,1]:
$$ \text{similarity}(\vec{a}, \vec{b}) = 1 - \frac{\lVert \hat{\vec{a}} - \hat{\vec{b}} \rVert}{\sqrt{n}} $$
where n = 6 is the number of features (so the distance is normalized to its maximum). Now near-identical schools score high and a reach-vs-safety pair scores low.
The ED arbitrage multiplier quantifies how much more forgiving applying early is at school $A$ versus school B:
$$ \text{arbitrage} = \frac{\text{ed}_A / \text{rd}_A}{\text{ed}_B / \text{rd}_B} $$
Challenges we ran into
- LLMs hallucinate majors. Early on, Groq confidently claimed "EECS" existed at schools that don't offer it. We fixed this by adding a dedicated Tavily search for each school's actual program list and constraining the prompt to only match against real offerings, with a note explaining exact-vs-closest matches.
- Net price is a trap. A single "net price" number is meaningless without a basis: public schools differ wildly in-state vs out-of-state. We forced a consistent basis (College Scorecard average net price, out-of-state for publics) and surfaced the assumption in the UI so comparisons are honest.
- Null-safety across an LLM boundary. Live models return
nullfor fields they can't find, which crashed our vector math (None / 100). We hardened both the extraction layer and the math layer to coerce and default every field. - Graceful degradation. Every stage falls back to realistic cached data if an API key is missing or a call fails, so the app never breaks during a demo.
What we learned
- Reactive databases replace a lot of infrastructure. Streaming agent logs became a three-line subscription instead of an SSE server.
- Grounding beats trusting the model. The difference between a toy and a tool was feeding the LLM real scraped context and forbidding it from inventing.
- Honesty is a feature. We prototyped an admit-probability simulator and didn't use it because we didn't have holistic data (essays, transcript, extracurriculars) any percentage is a guess. Showing real, sourced stats we can defend was the better call.
What's next
- Holistic profile fit: analyze extracurriculars, rigor, and GPA trend against each school's real CDS "factors considered" rubric.
- An ROI view using College Scorecard median-earnings-by-major data.
- A supplemental-essay orchestrator that clusters overlapping prompts across a list.

Log in or sign up for Devpost to join the conversation.