-
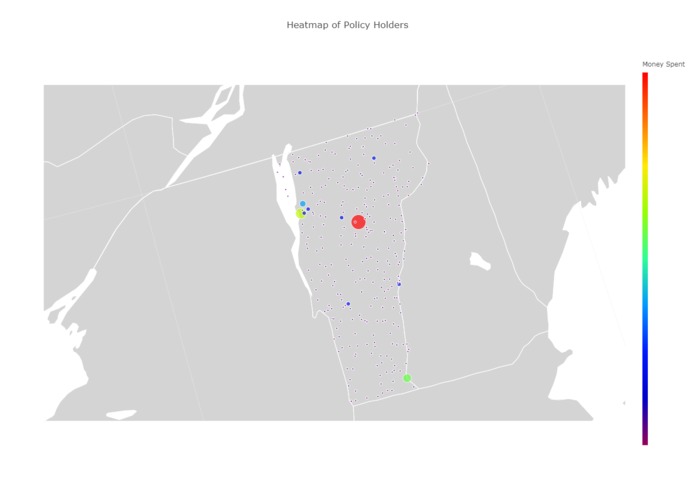
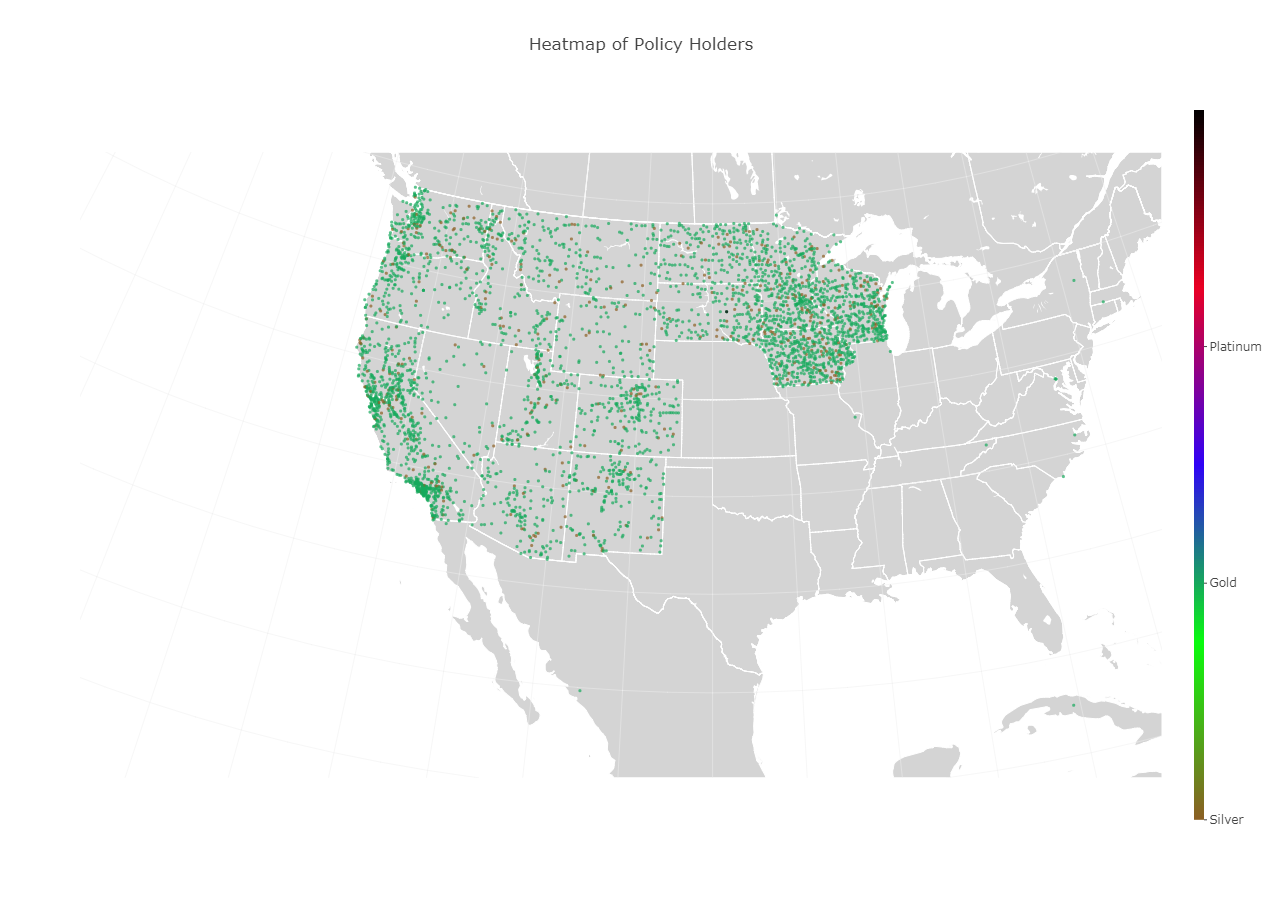
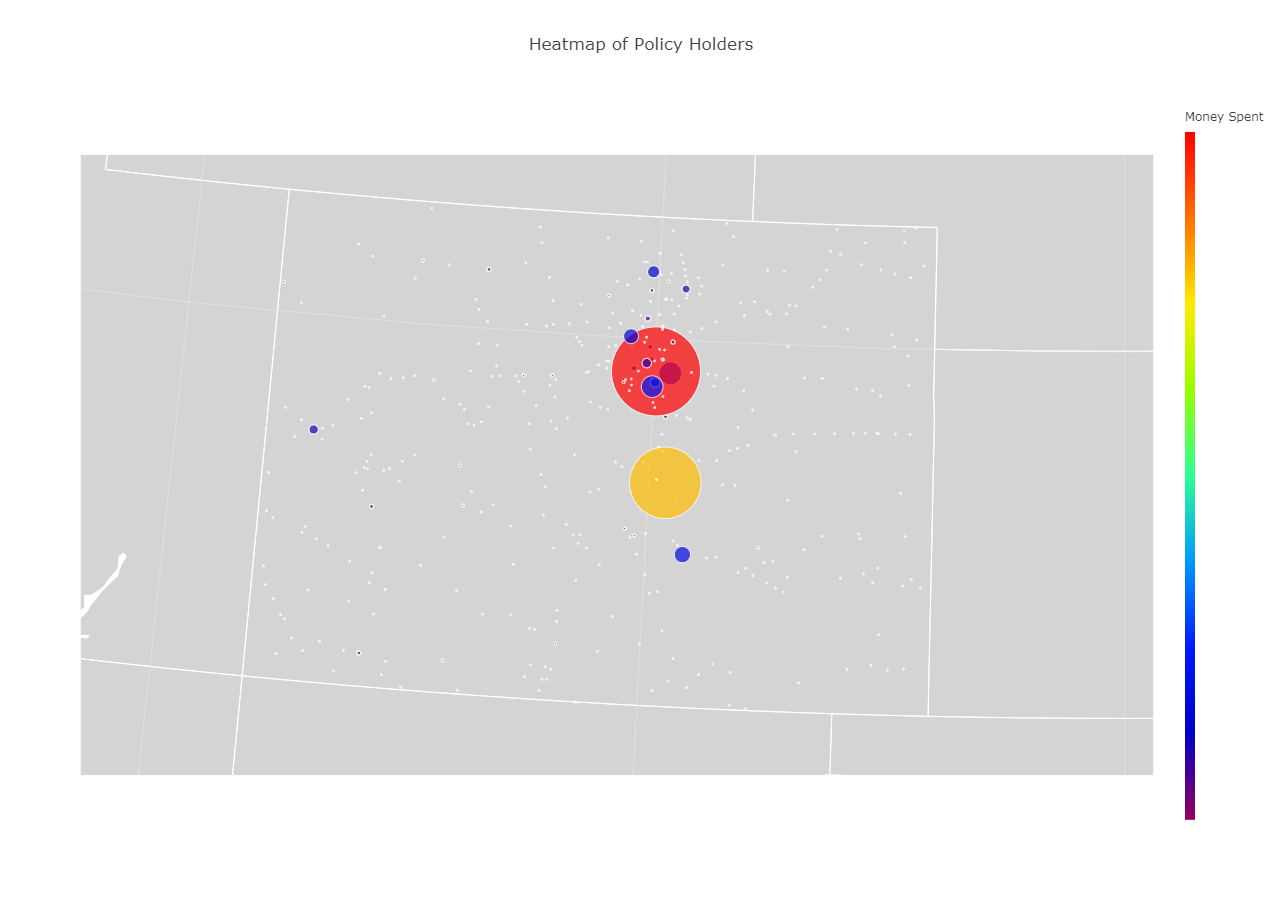
Cities based off of number of clients per city and total spending
-
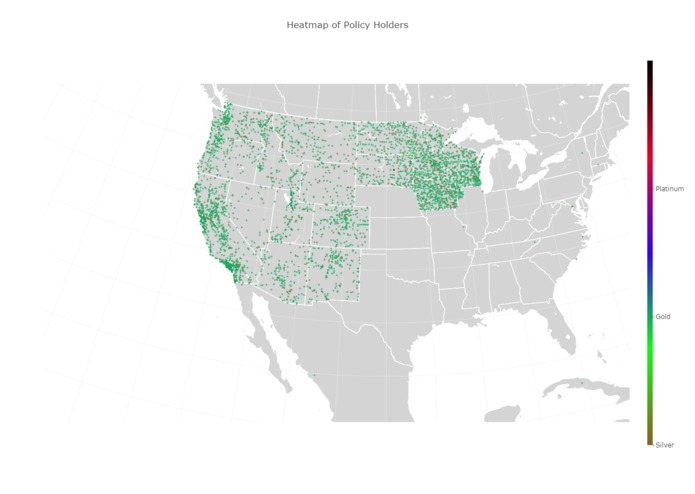
First 100,000 elements in the database plotted across 4100 cities
-
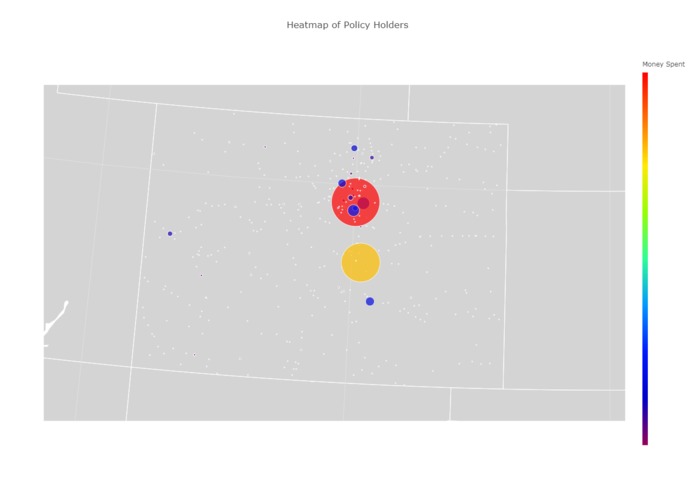
Colorado data subset
Inspiration
We wanted to be able to view the data given to us by Vitech to better understand the distribution of clients. It's one thing to say "We have clients all across the United States", and it's another to see 1.4 million data points over 16 thousand cities.
What it does
We pulled data from the Vitech data set and graphed the number of clients as well as the total spending per city against their geographic location
How I built it
We used python, plotly, and geopy. We pulled the data from the Vitech SOLR database and matched the id of the client to their purchased plan, then aggregated the data per city. Next, we found the latitude and longitude of each city with a client through geopy. Afterwards we plotted all of the data on a map of the united states using the data we pulled from the SOLR database. We used netbeans and Java for the application to easily view data subsets.
Challenges I ran into
The biggest challenge we ran into was working with such a large data set. There were over 1.4 million customer entries in the database, and pulling all of that data and then running an analysis on it took a very long time. We also hit the maximum number of requests through geopy in an hour multiple times, which hindered progress significantly
Accomplishments that I'm proud of
We managed pull and compare over 100,000 elements from the database and plot them accurately on a geographic map, categorized my the most common plan in the city. We also managed to plot all the data from an individual state, so we know that we can do it for every state given more time.
What I learned
I learned a lot about visualizations and what makes a good visualization versus a bad one, as well as making requests to external databases and using apis.
What's next for United Scatterplots
Analysis of all the data in the database, plotted on to maps of the entire united stats as well as each individual state. We also wanted to build a web app that brings up the visualizations so that you can easily select what data you want to view without having to have it all locally saved, in order to help a business access the data remotely. However, this requires all of the analysis to be done in advance, which we were unable to do given the size of the data set and the amount of time available in the hackathon.
Log in or sign up for Devpost to join the conversation.