Inspiration
We were inspired by recent news stories regarding working conditions, specifically at Amazon and similarities if that to the situation of factory workers during the turn of the 19th century. A major part of the solution to those labor problems was labor unions so we wanted to use data to see exactly how effective unions were to see if they might be a solution today.
What it does
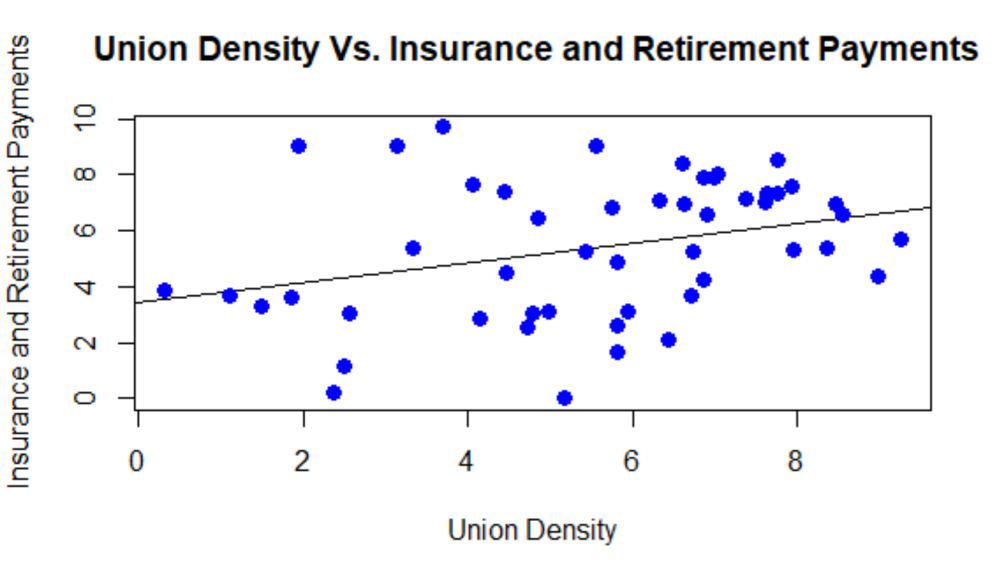
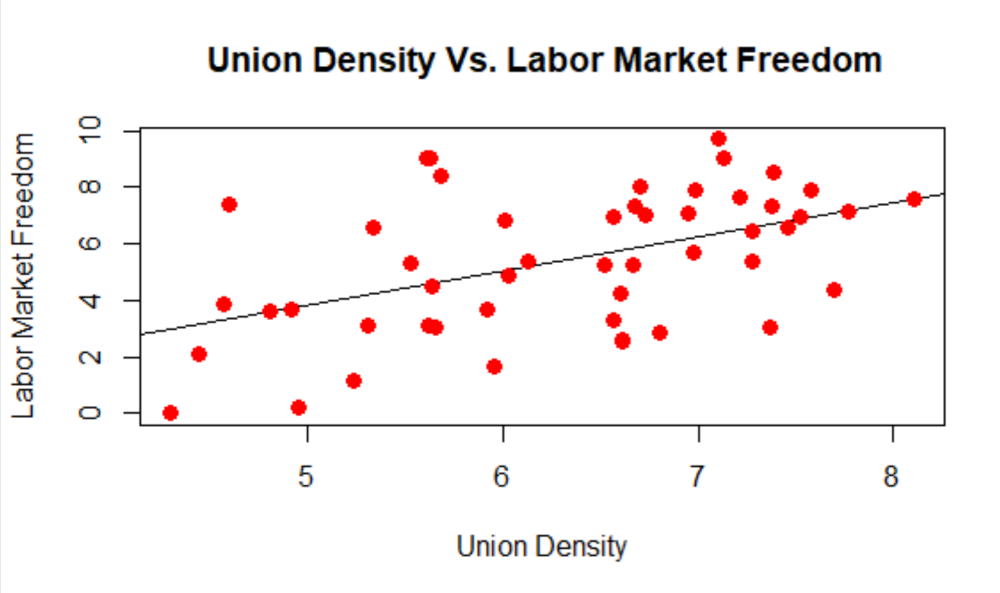
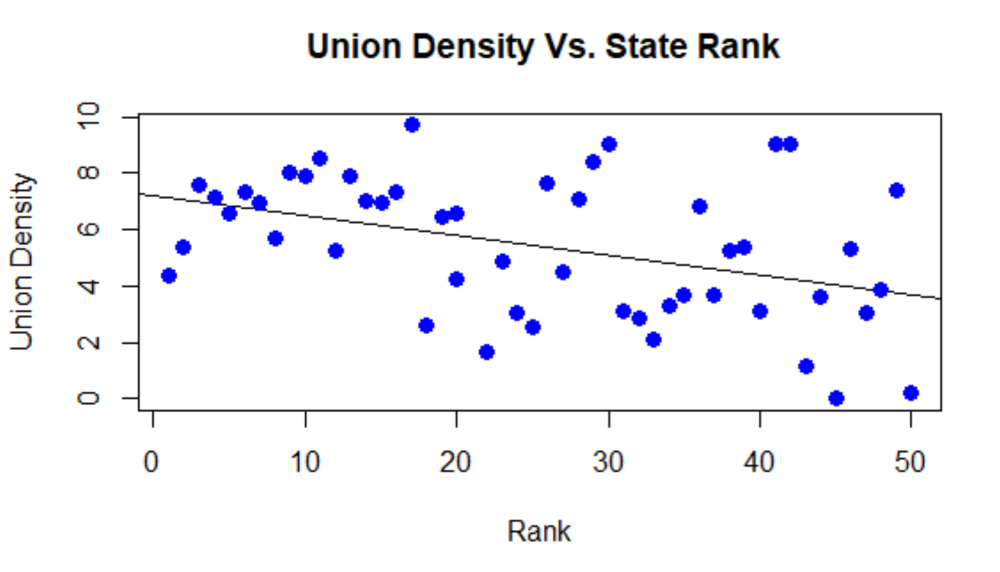
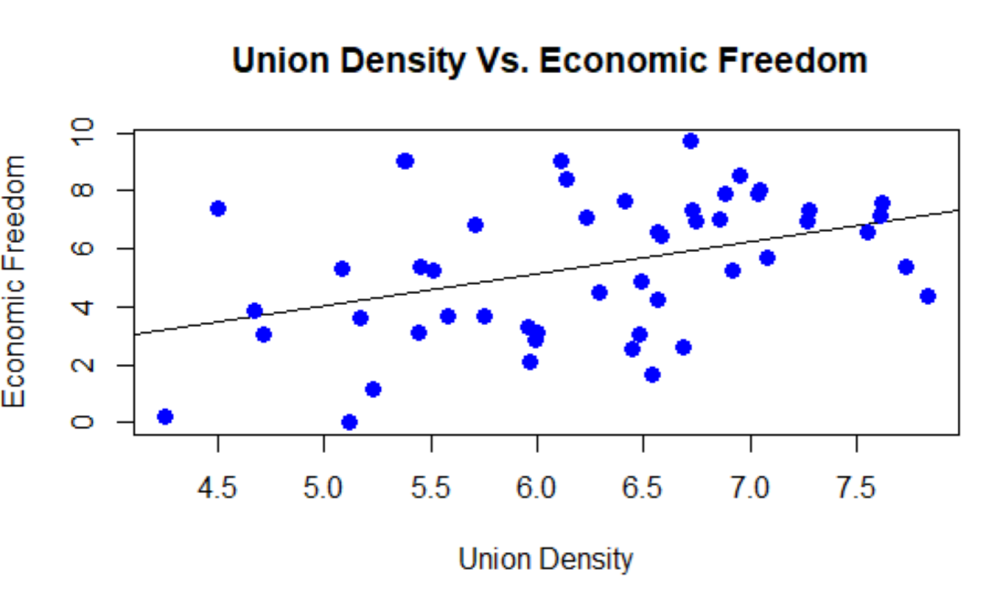
It is a categorization of correlations of Union Density and other economic factors. We just created several data plots to demonstrate the correlations.
How we built it
We used r studio and coded linear regressions, plotted them, and did correlation tests. Then aggregated the data in a PowerPoint with video.
Challenges we ran into
Finding a comprehensive dataset with all of our desired variables was our greatest challenge.
Accomplishments that we're proud of
Being able to make useable graphs in r studio
What we learned
How to use r studio and its language,
What's next for Unions and their Correlation to the Economy
Expanding our sample data, possibly looking at other countries, and adding more specific legislation as a variable to research
Built With
- r-studio


Log in or sign up for Devpost to join the conversation.