
Inspiration
Humans have been finding ways to navigate from place to place since the beginning of recorded history. Today, web mapping platforms like Google Maps have made this largely effortless for most people. But for the 5.5 million Australians living with a disability, getting around remains a significant challenge.
Existing solutions only go so far. Wheelmap and similar platforms mark accessibility features on a map, but lack the depth and nuance required to accommodate the full spectrum of accessibility needs. Google Maps provides accessibility-aware routing, but strips out elevation and spatial context for someone with a mobility impairment.
These tools share a common limitation: they’re fundamentally based on the concept of a flat, top-down map. Yet in today's cities, indoor environments like shopping centres, transit hubs, and office buildings are just as critical to our lives as the streets connecting them.
Our team believes that the problem of accessible navigation in a three-dimensional world cannot be reduced to a two-dimensional map. We built AccessAtlas to realize our vision.
What it does
AccessAtlas is an AI-driven accessibility mapping platform powered by the community.
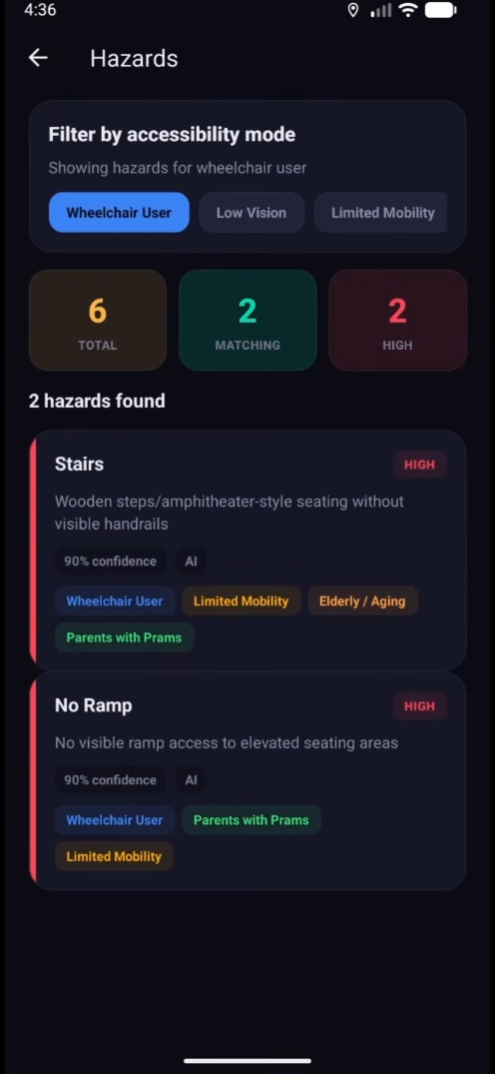
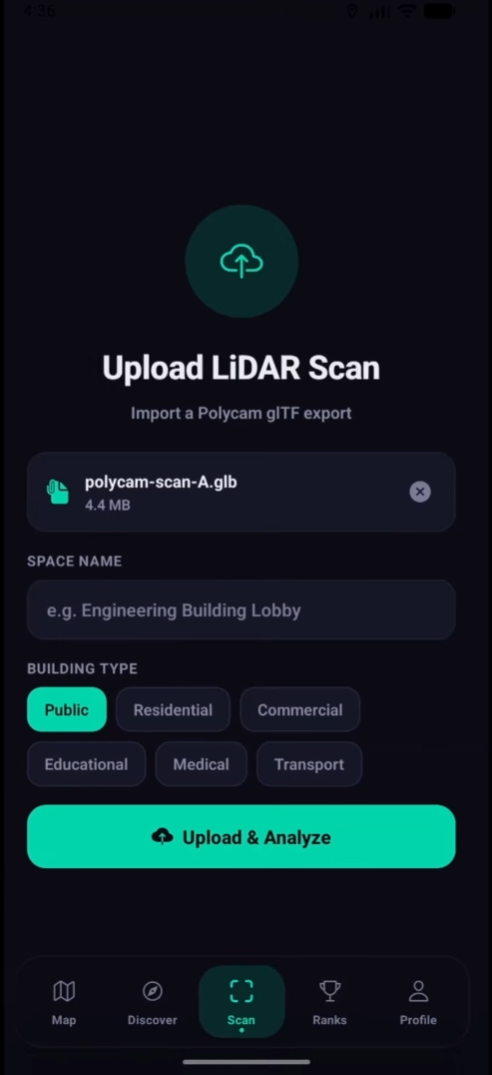
Using their smartphone, anyone can make a 3D scan of a real-world space using LiDAR technology. When users upload their scans to AccessAtlas, we process them behind the scenes with the help of AI vision to automatically identify any accessibility hazards. Hazards are assigned a severity and categorized into 13 hazard types, including steps, narrow passages, poor lighting, and other obstacles.
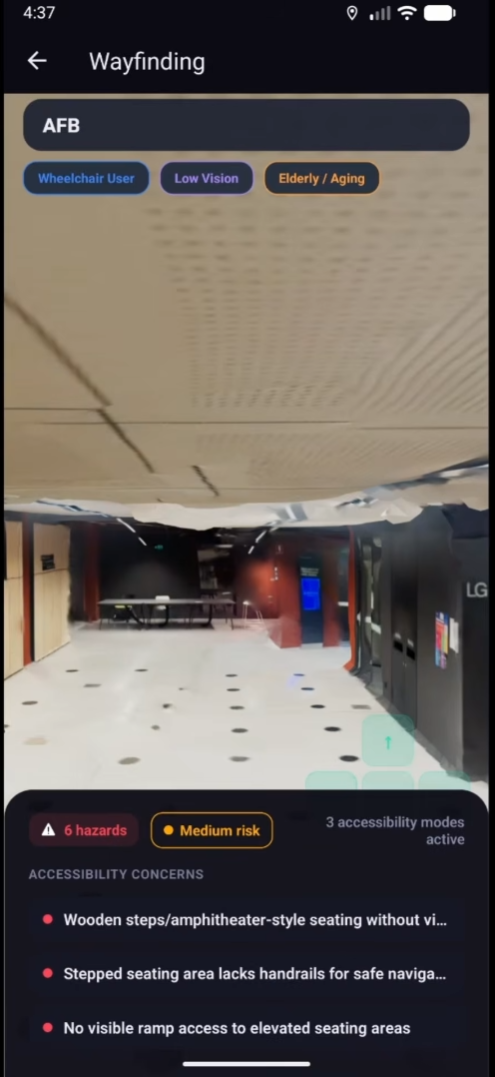
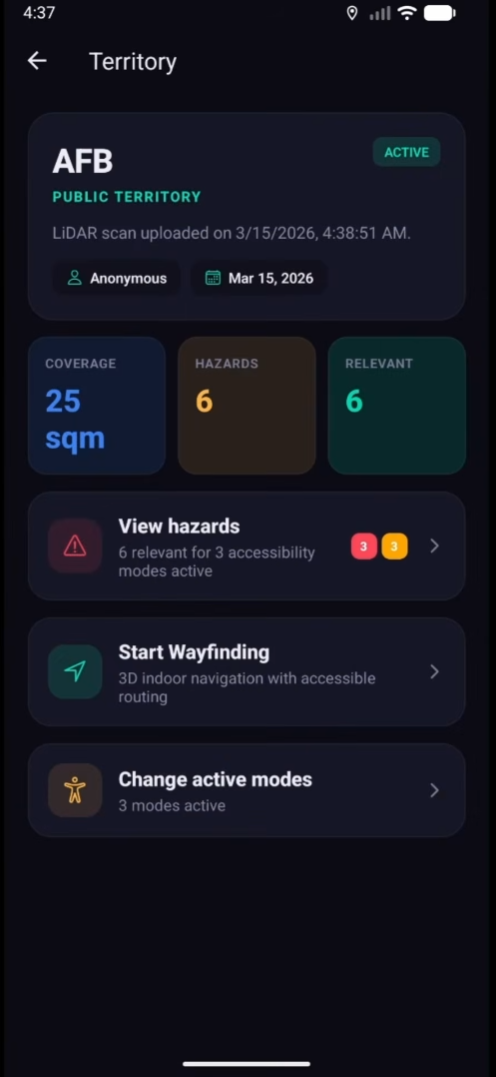
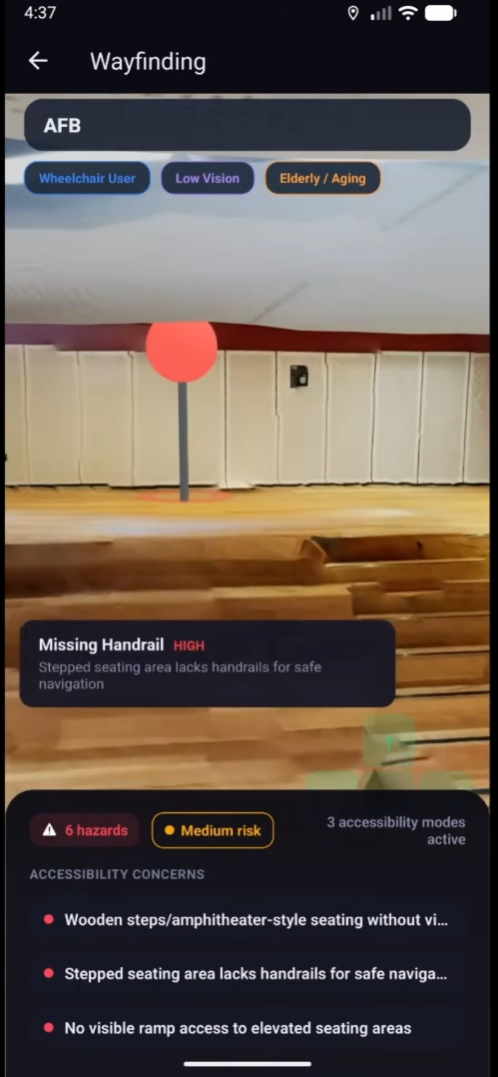
After processing, the scanned location is displayed on AccessAtlas as a territory. Users can find territories near them via the built-in map, or alternatively browse all scanned territories on the discovery page. In addition to listing the hazards, AccessAtlas renders scanned territories in 3D, so users can see exactly where risks are located and how to navigate around them. Users move through the 3D space using a d-pad, providing precise control even for people with motor impairments.
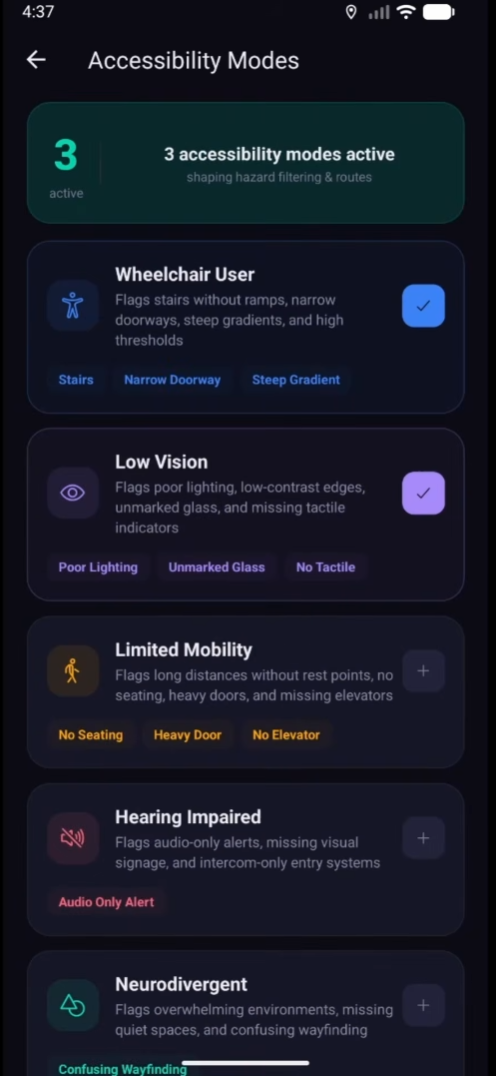
We’re very aware that accessibility isn’t one size fits all. That’s why we allow users to select any combination of 7 accessibility profiles, such as wheelchair user, low vision, and more. Updating your accessibility profiles instantly updates the hazards that are displayed for you, giving every user a personalized experience.
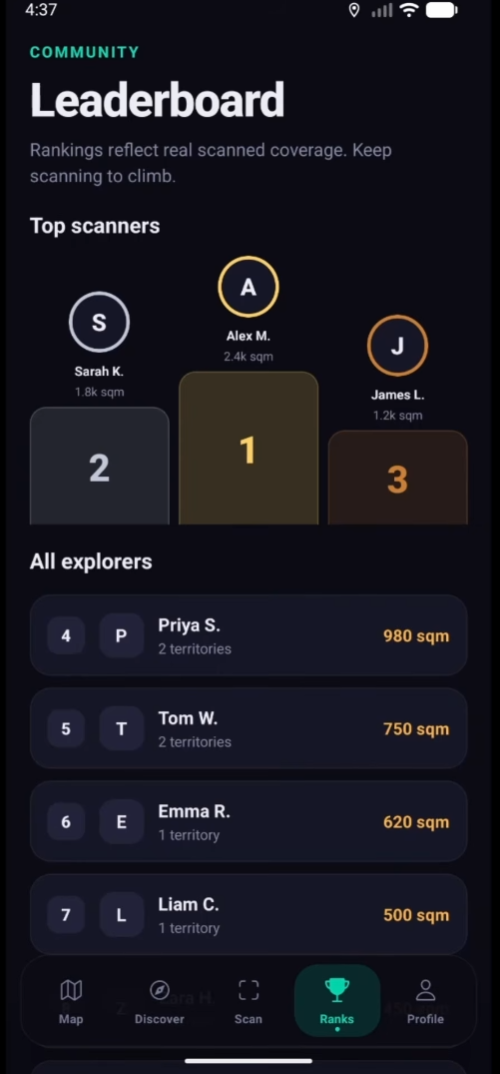
To incentivize the community, we also incorporated a leaderboard to reward contributors who scan the most area. Every new scan makes the map smarter. Every mapped space gives someone more confidence, more independence, and more choice.
How we built it
AccessAtlas is a React Native mobile app built with Expo, backed by a Bun and Express server communicating over tRPC for end-to-end type safety. All data lives in MongoDB, accessed through Prisma.
State management is handled by Zustand on the client, with TanStack React Query managing server state and caching. The whole app is containerized with Docker for deployment, running on a lightweight Alpine-based Bun image.
The heart of AccessAtlas is its scan processing pipeline. When a 3D scan in GLB format is uploaded, our backend parses the GLB binary to extract embedded textures and spatial data. Those textures are then sent to Claude Sonnet 4 via the Anthropic API, where AI vision identifies accessibility hazards, classifies them by severity, and tags which of our 7 accessibility profiles are affected.
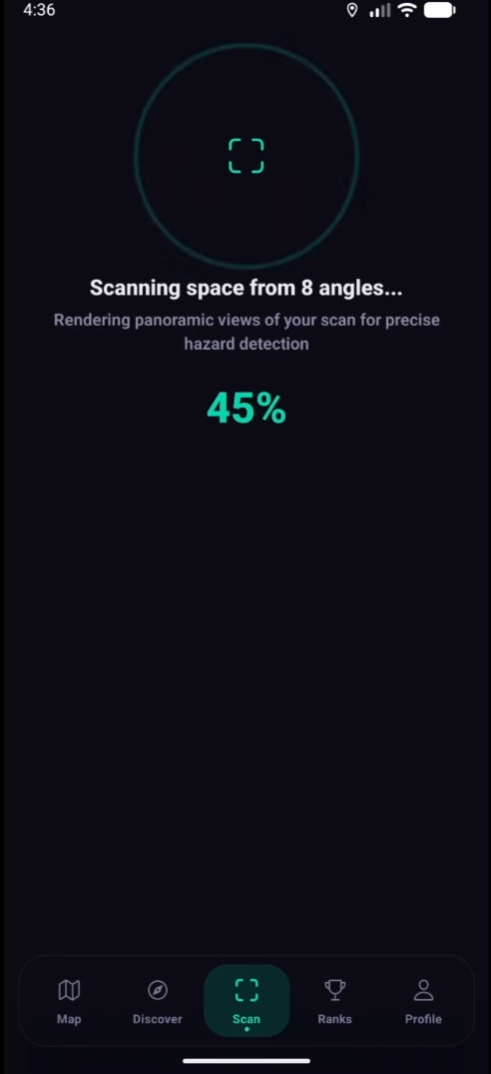
We didn't stop at texture analysis. To give hazards precise locations in 3D space, we built a panoramic capture system. The uploaded model is rendered in a hidden Three.js scene, and eight screenshots are taken from the model's centre point at cardinal directions. These panoramic views, along with camera position and angle metadata, are sent back to Claude for a second pass. This time, the AI calculates real 3D coordinates for each hazard based on spatial context, replacing the initial estimates with accurate positions that can be pinned inside our interactive viewer.
On the frontend, the map experience is powered by Mapbox GL. Scanned territories are rendered as coloured polygons over a dark-styled map, and tapping into one reveals its hazards and 3D model.
The wayfinding viewer loads the original scan in a WebView using Three.js, with hazard pins rendered as colour-coded spheres at their detected positions. Users navigate with a d-pad overlay, and can toggle their accessibility profiles mid-session to see how the space changes for different needs.
Challenges we ran into
Branching off into mobile development allowed us to provide a native experience for our users, but also posed a plethora of development challenges. In the process of creating a productive development ecosystem, we had to debug emulators and build tools, which took up valuable time.
Making high-stakes pivots was another recurring challenge. During development, we switched from a Next.JS web app to a mobile application in Expo, then from an Express backend to tRPC. Each time, we had to accept a major setback in exchange for a better long-term foundation. Under hackathon pressure, those choices weren’t easy to make, but they were ultimately the right ones. Accomplishments that we're proud of On the frontend, we’re proud of how we managed to create an all-encompassing user experience that lives up to the goal of our project. Our interactive 3D renderer was designed with everyone in mind, featuring simple, intuitive controls for people with limited dexterity.
On the backend, our standout achievement is successfully building an end-to-end processing pipeline that transforms a raw LiDAR scan into a detailed and structured accessibility review. This meant chaining together several non-trivial stages, such as processing the scan into a suitable format, orchestrating API calls, and parsing the output into a clean schema for storage and retrieval.
Last but not least, we’re very proud of how we collaborated as a team. When encountering setbacks and obstacles, it’s easy to get frustrated. Our team dynamic played a massive role in keeping each other optimistic and motivated through the whole journey. Every time an unexpected roadblock popped up for one team member, whether a cryptic build error or a database connection failure, the rest of the team jumped to help out.
What we learned
Our research deepened our understanding of just how broad the accessibility spectrum really is. Accessibility hazards don’t only affect wheelchair users, but also people with low vision, neurodivergence, and more. We had to reflect on how different people may experience the same physical space, and think of solutions to alleviate those struggles.
On the technical side, this is our team’s first time working with Expo and 3D models. From configuration to development to deployment, we learned a lot about our technology stack. We learned how to extract meaningful spatial and texture data from 3D scans. We navigated the tradeoffs of Mapbox’s native SDK in regards to capabilities, speed, and ease of testing.
UniHack 2026 was a valuable learning experience for us, and if we had to go through the 48 hours of late night grinding again, we wouldn’t hesitate.
What's next for AccessAtlas
AccessAtlas was built in 48 hours, but we hope its potential can be realized beyond the scope of a hackathon.
One vital integration that we would implement if given more time is built-in 3D scanner integration, facilitating real-time scanning, streaming and processing. This would provide a smoother user experience compared to the manual LiDAR scanning and upload process. making it easier for volunteers to map out an area, and at all times.
We would also add ratings to serve as the content moderation for AccessAtlas. This would ensure scanned locations maintain the quality of the content uploaded, and select top-voted scans as the default mapping for public use.


Log in or sign up for Devpost to join the conversation.