Inspiration
Cities today are drowning in data – but it's fragmented. Traffic information lives on one app, air quality on another, transit and waste management are completely invisible to the public. Decision-makers and citizens lack a unified view of urban operations, making it difficult to respond to challenges in real-time or plan for the future.
We built Unified City Dashboard to solve this problem – a real-time urban intelligence platform that brings everything together in one place.
What It Does
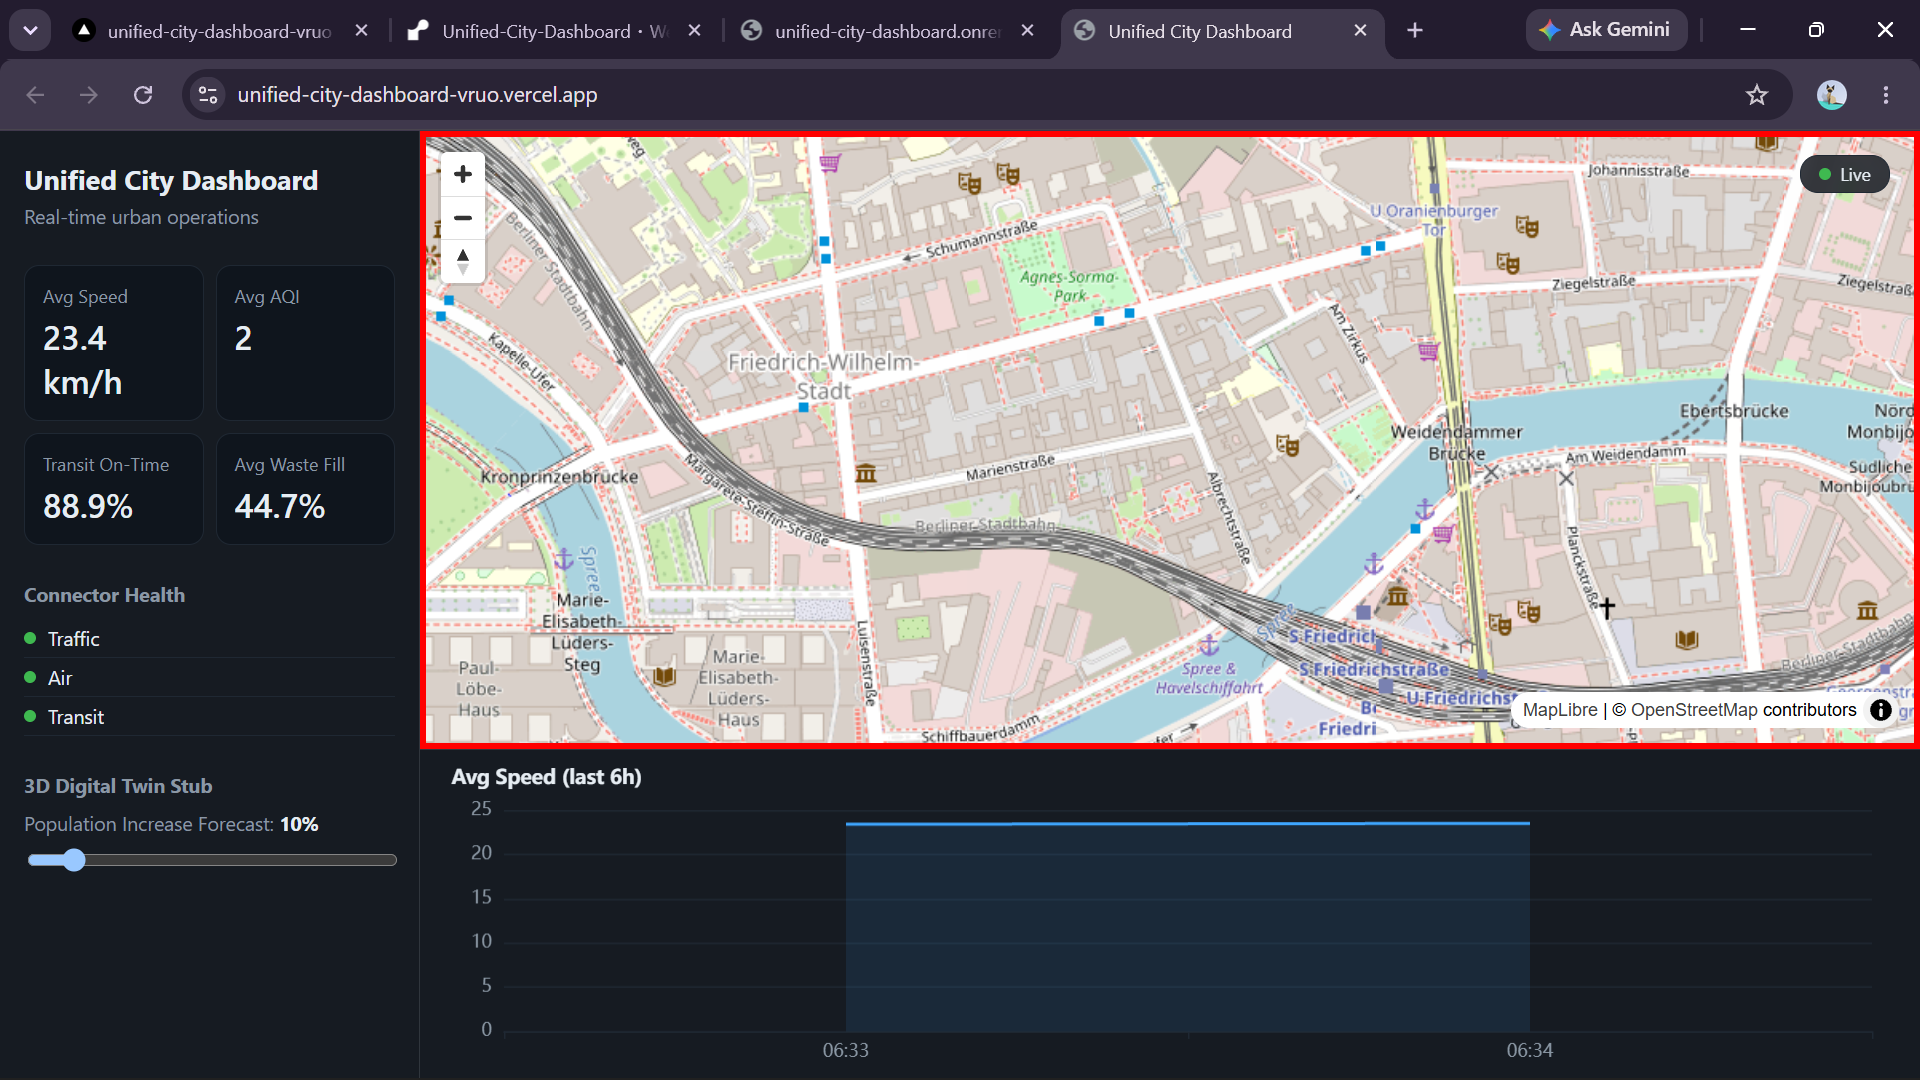
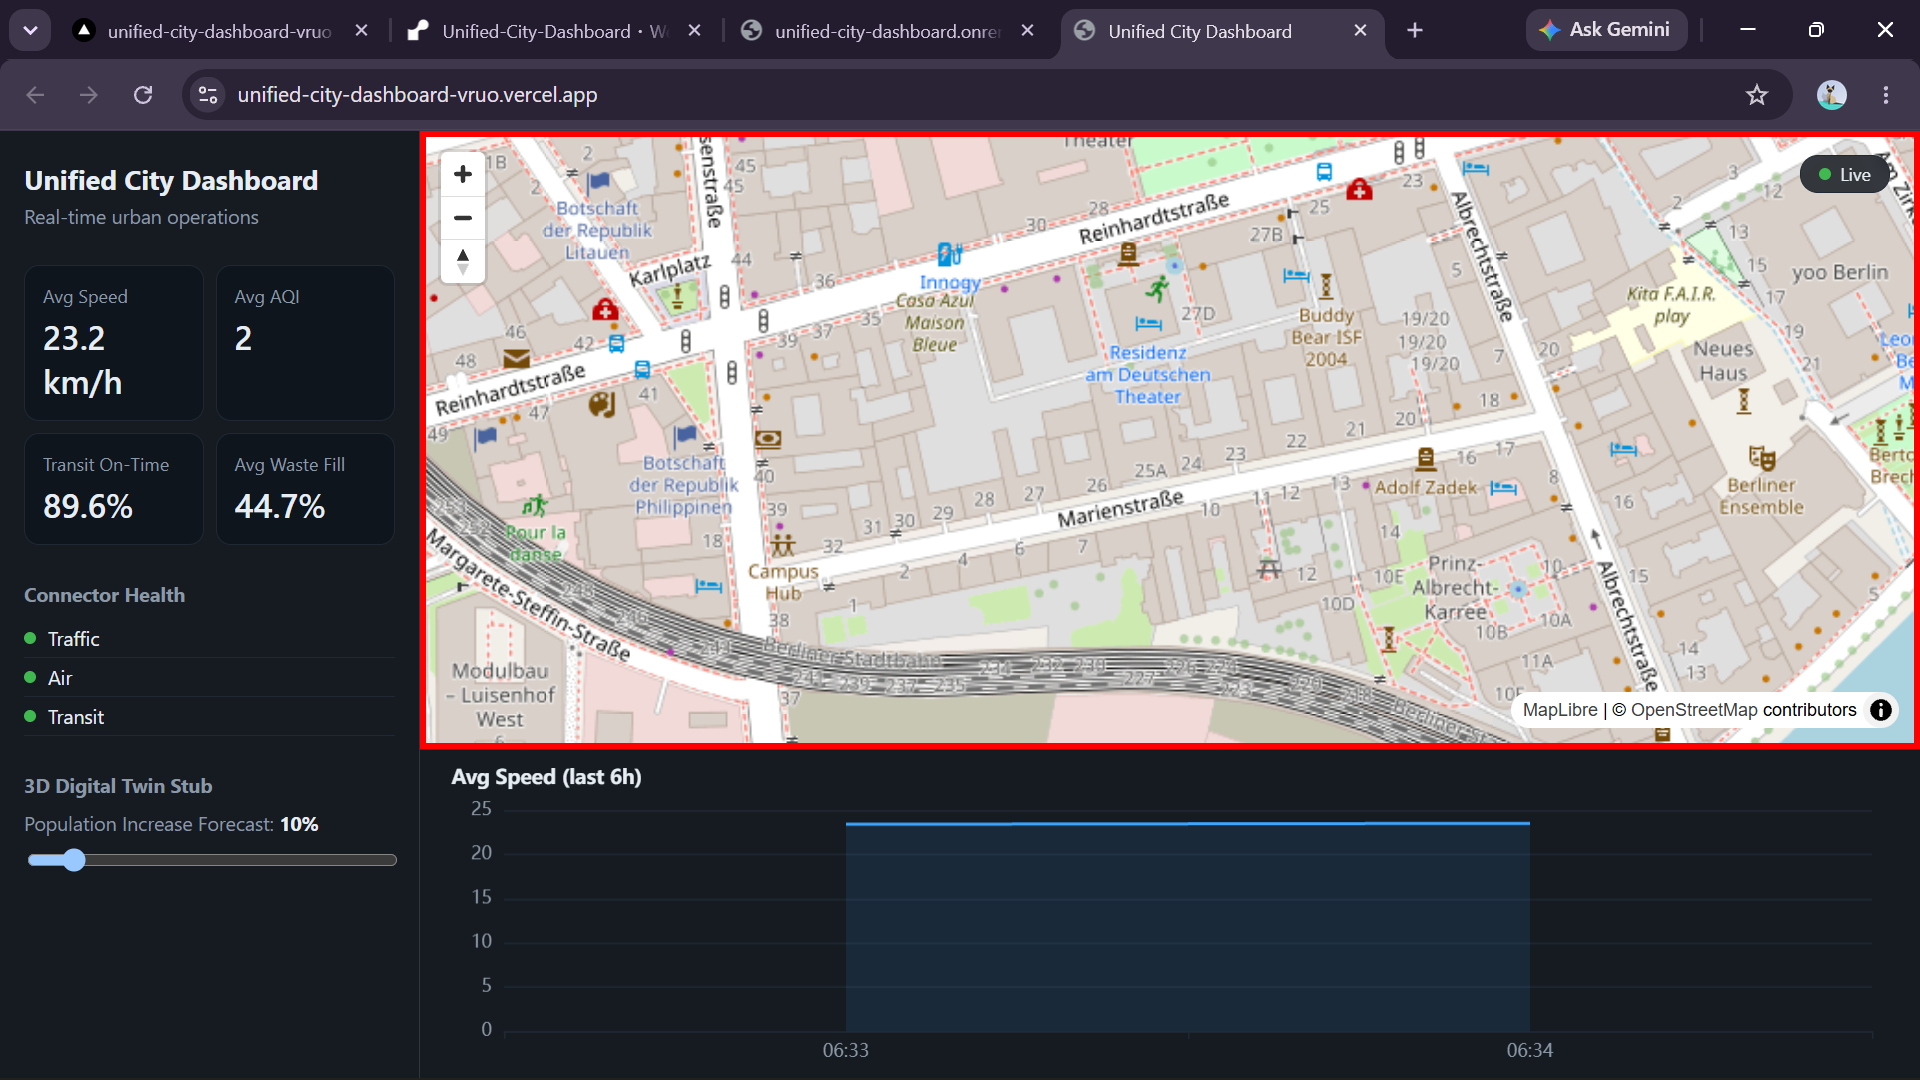
Unified City Dashboard aggregates live data from multiple city systems into a single, intuitive dashboard:
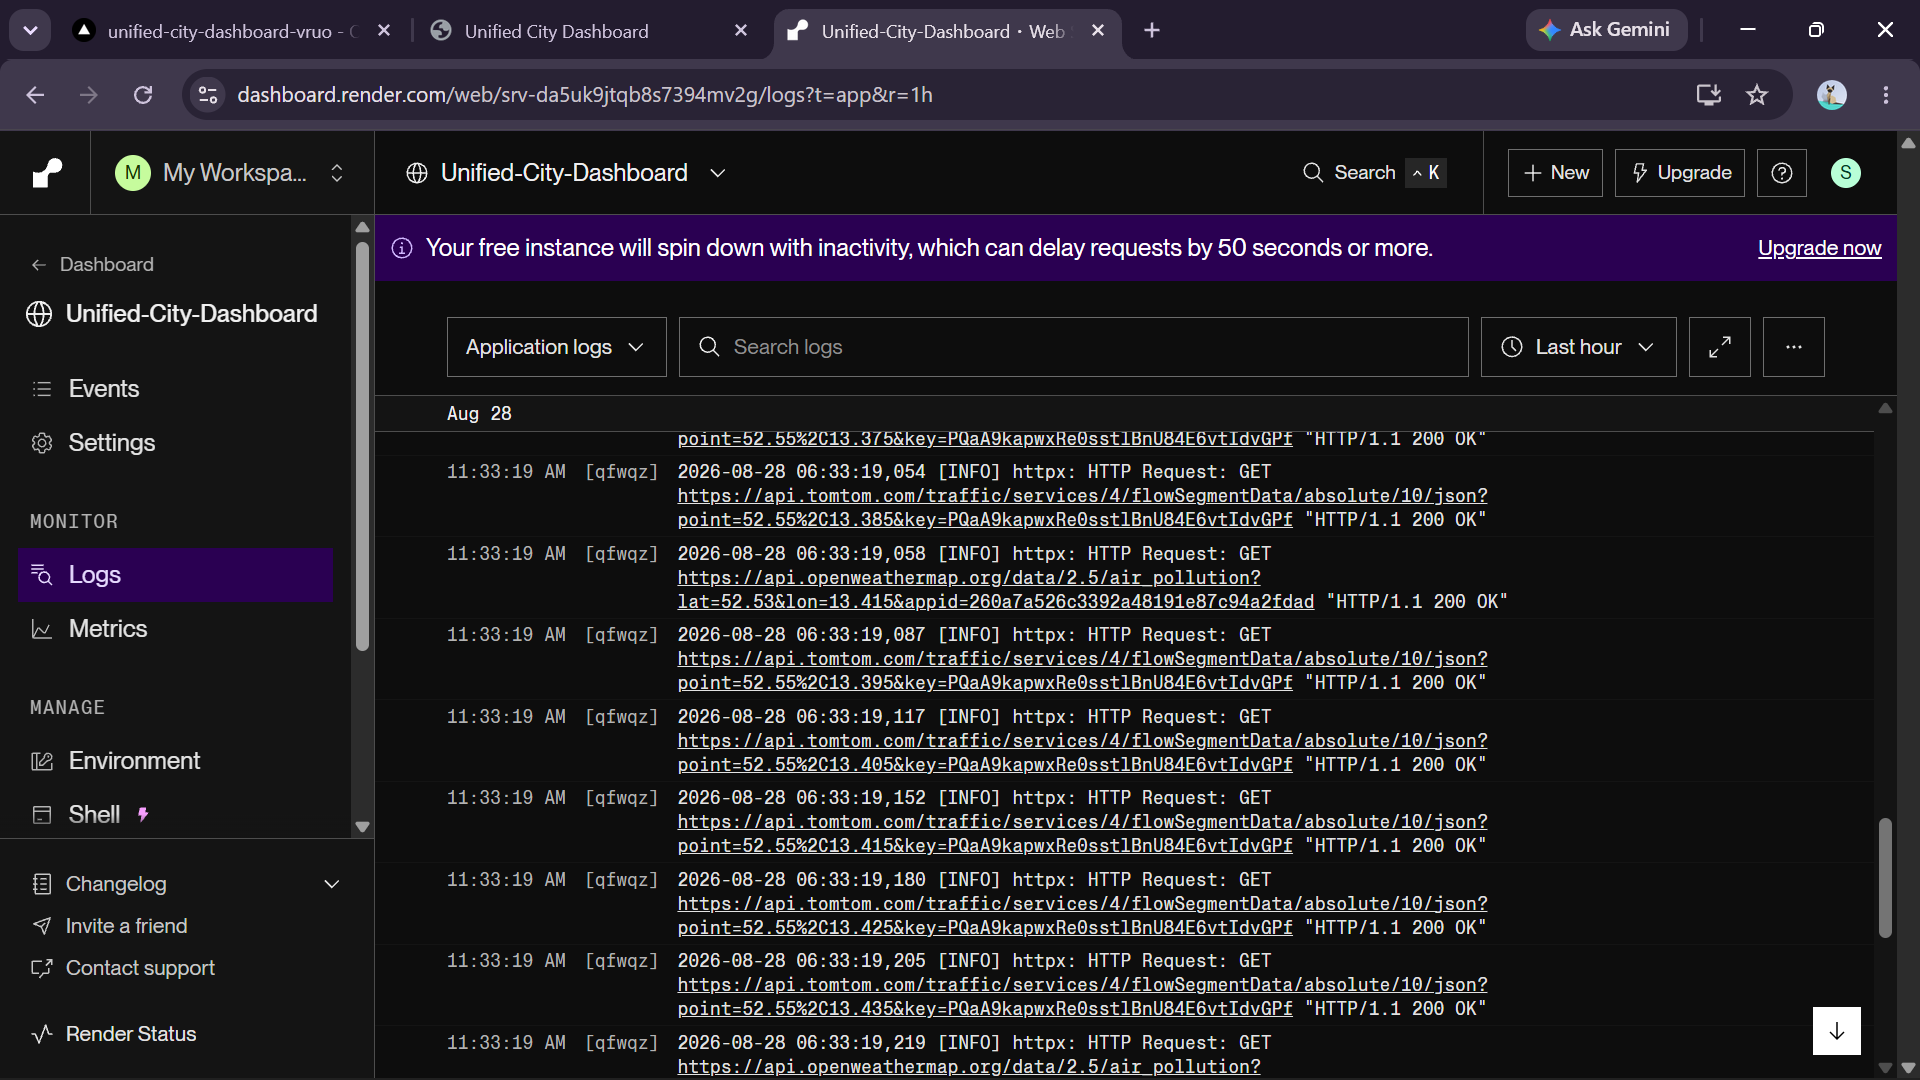
- Real-time traffic speeds – Live congestion data from TomTom Traffic API
- Real-time air quality – AQI monitoring from OpenWeatherMap
- Real-time transit tracking – Live vehicle positions from GTFS-RT feeds
- Real-time waste monitoring – IoT sensor data with smart pattern fallback
- ML-powered congestion forecasting – RandomForest model predicts city-wide congestion
- Interactive map – Heatmaps and vehicle markers with MapLibre + OpenStreetMap
- Historical trends – 6-hour speed history with PostgreSQL/TimescaleDB
- Live WebSocket updates – Real-time data streaming with zero page refresh
How We Built It
Architecture
We built a full-stack, production-grade system with a modern microservices architecture:
Data Ingestion Layer:
- TomTom Traffic API for real-time speed and congestion data
- OpenWeatherMap for air quality and weather conditions
- GTFS-RT feed for live transit vehicle positions
- IoT sensor API for waste bin fill levels (with intelligent pattern fallback)
Streaming Layer:
- Apache Kafka (Aiven) for reliable, real-time message streaming
- Circuit breakers for fault tolerance and automatic fallback
Storage Layer:
- PostgreSQL with TimescaleDB for time-series historical data
- Redis (Upstash) for live snapshots and low-latency access
- PostGIS for geospatial queries
ML Layer:
- RandomForestRegressor (scikit-learn) for congestion forecasting
- Features: time of day, day of week, temperature, weather severity, population increase
- Output: Multi-zone GeoJSON with color-coded congestion indexes
API Layer:
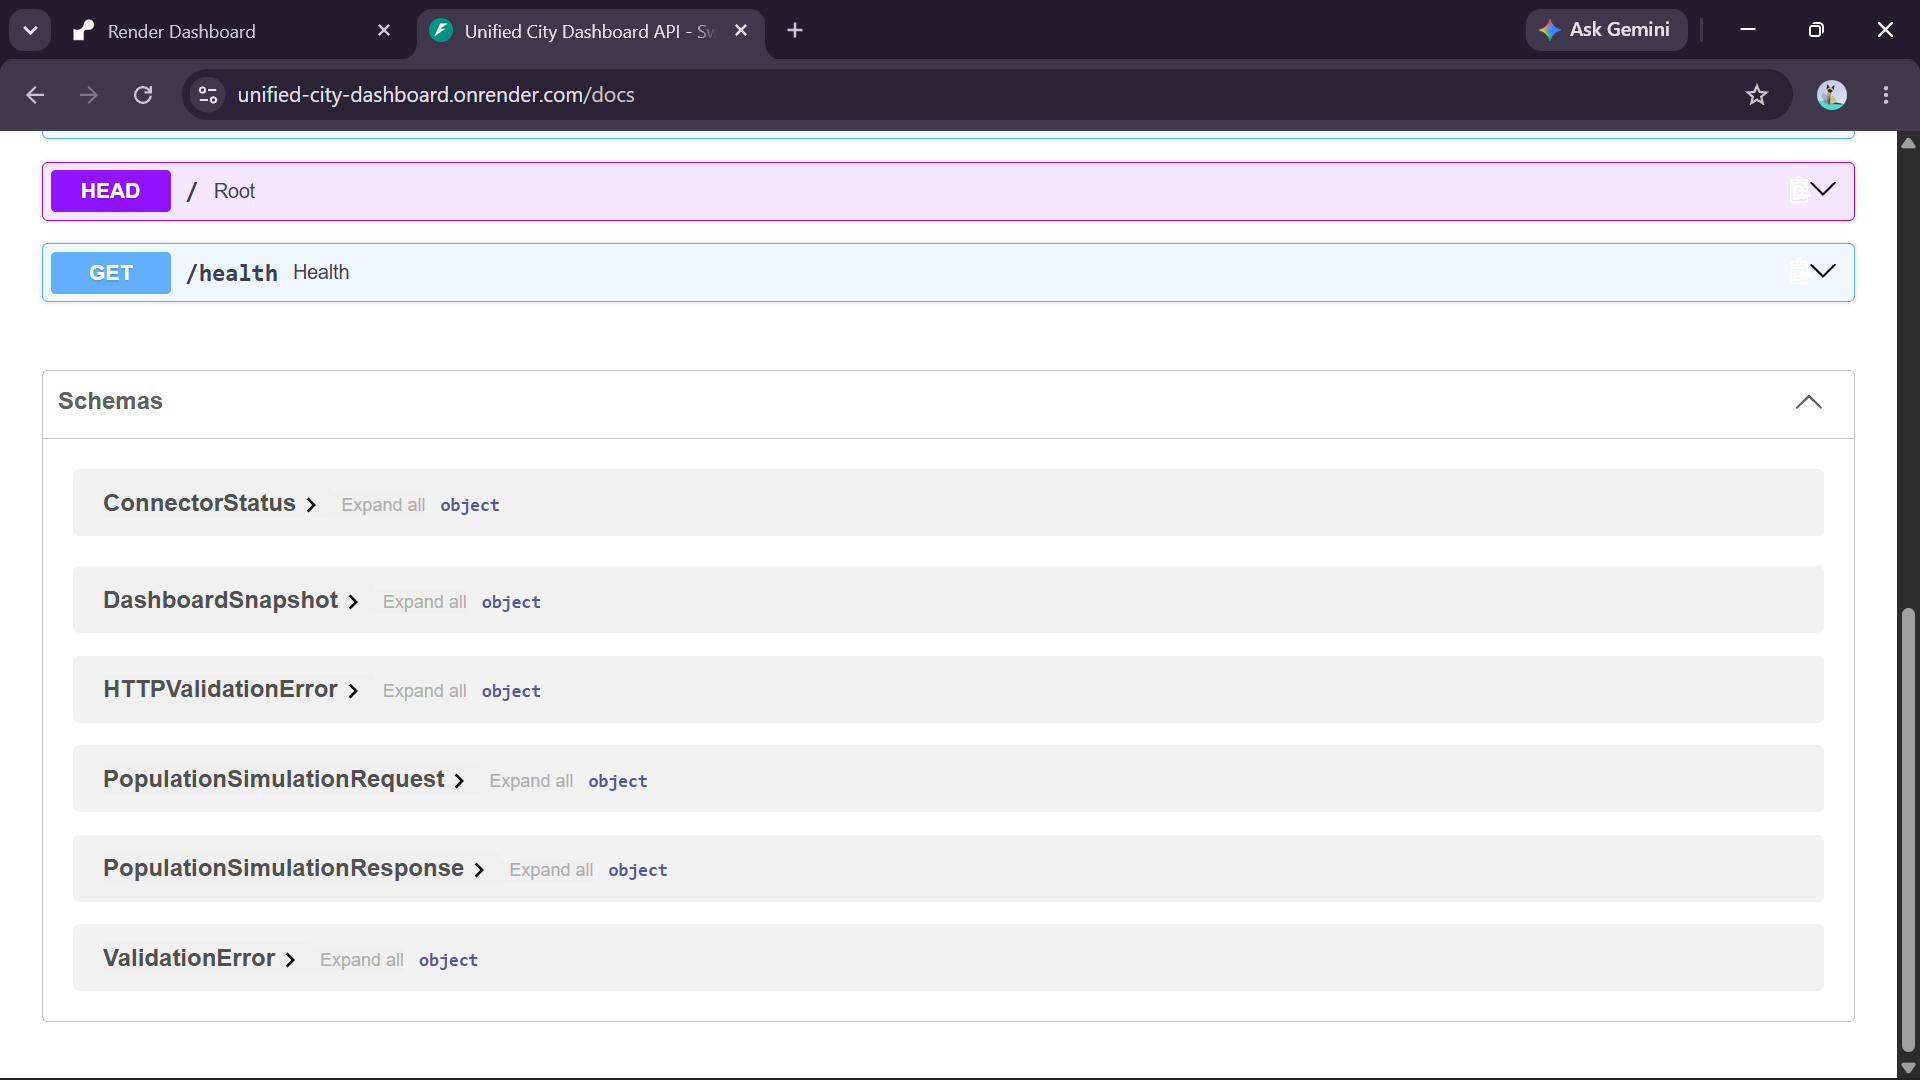
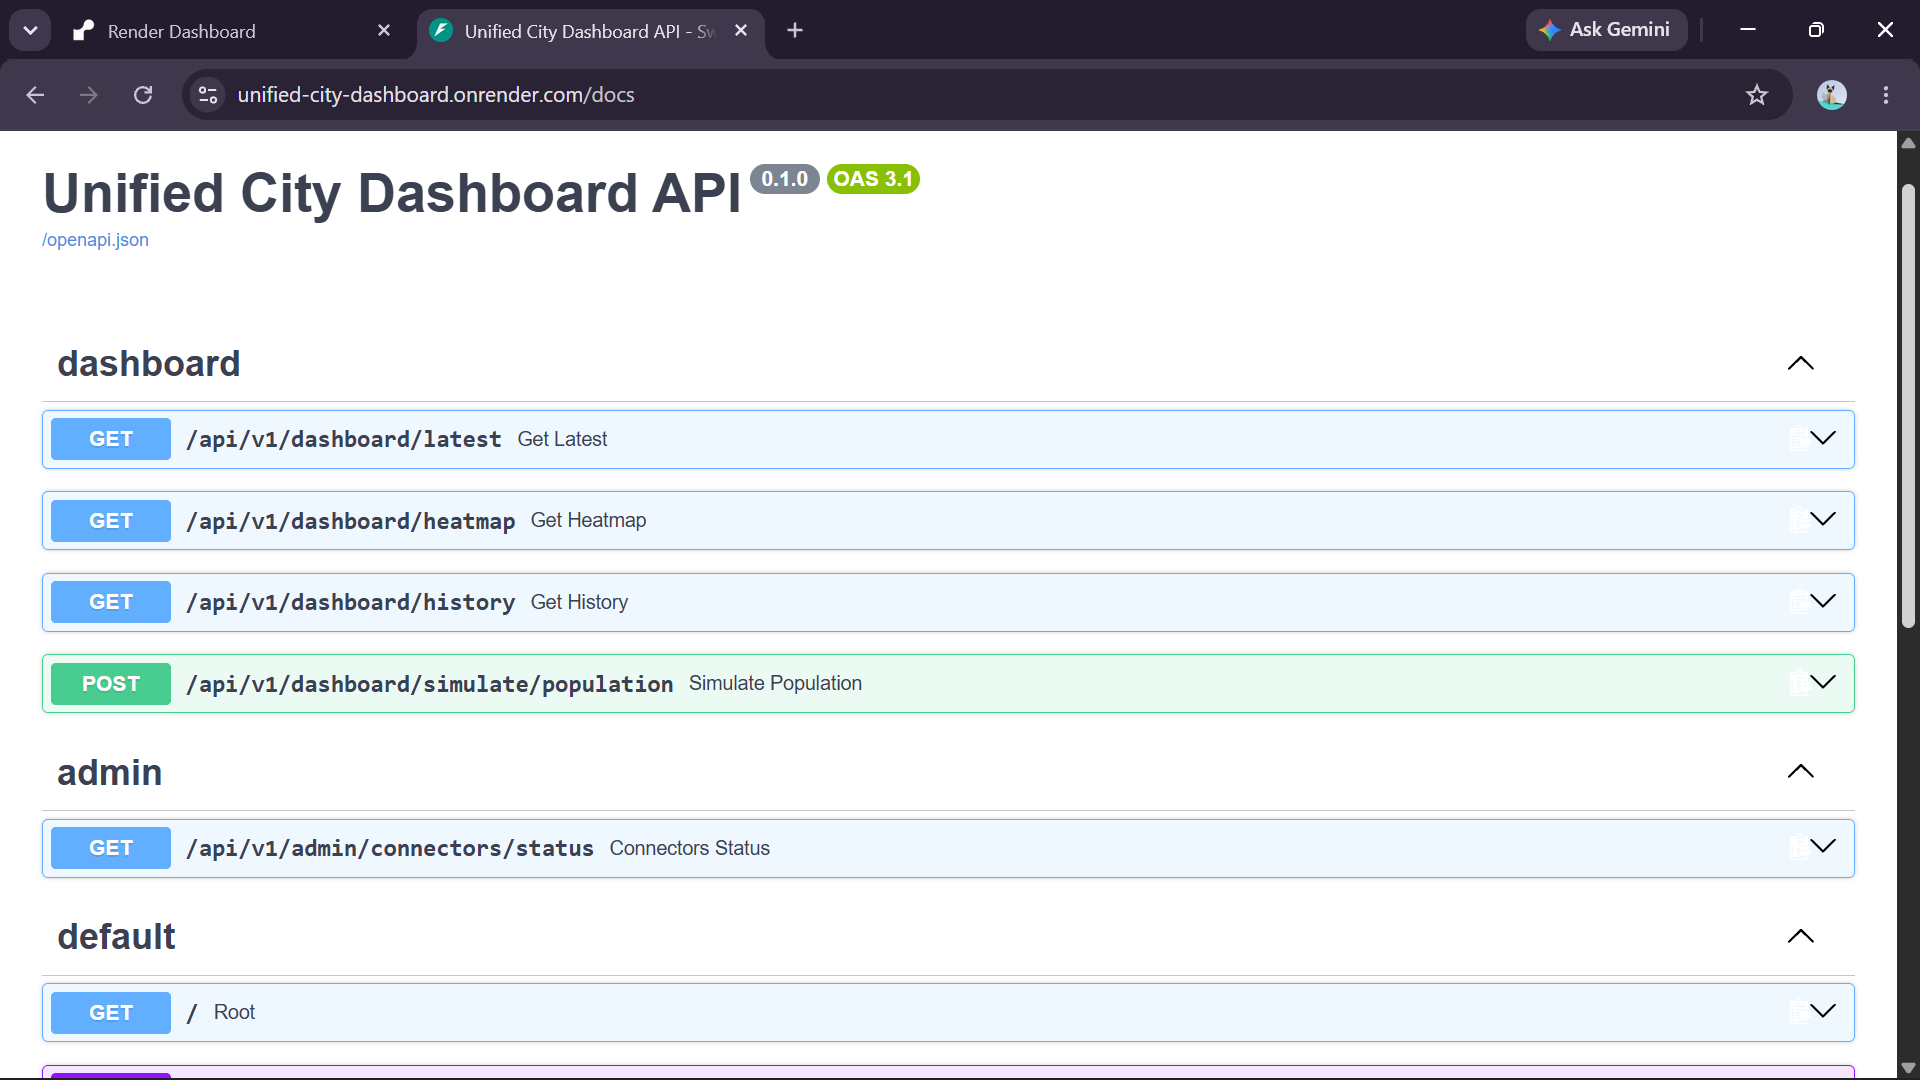
- FastAPI (Python) with WebSocket support
- REST endpoints for dashboard data
- WebSocket for real-time live updates
Frontend Layer:
- React + TypeScript with Vite
- MapLibre GL for interactive maps
- ECharts for data visualization
- WebSocket client for live updates
Deployment:
- Frontend: Vercel (free tier)
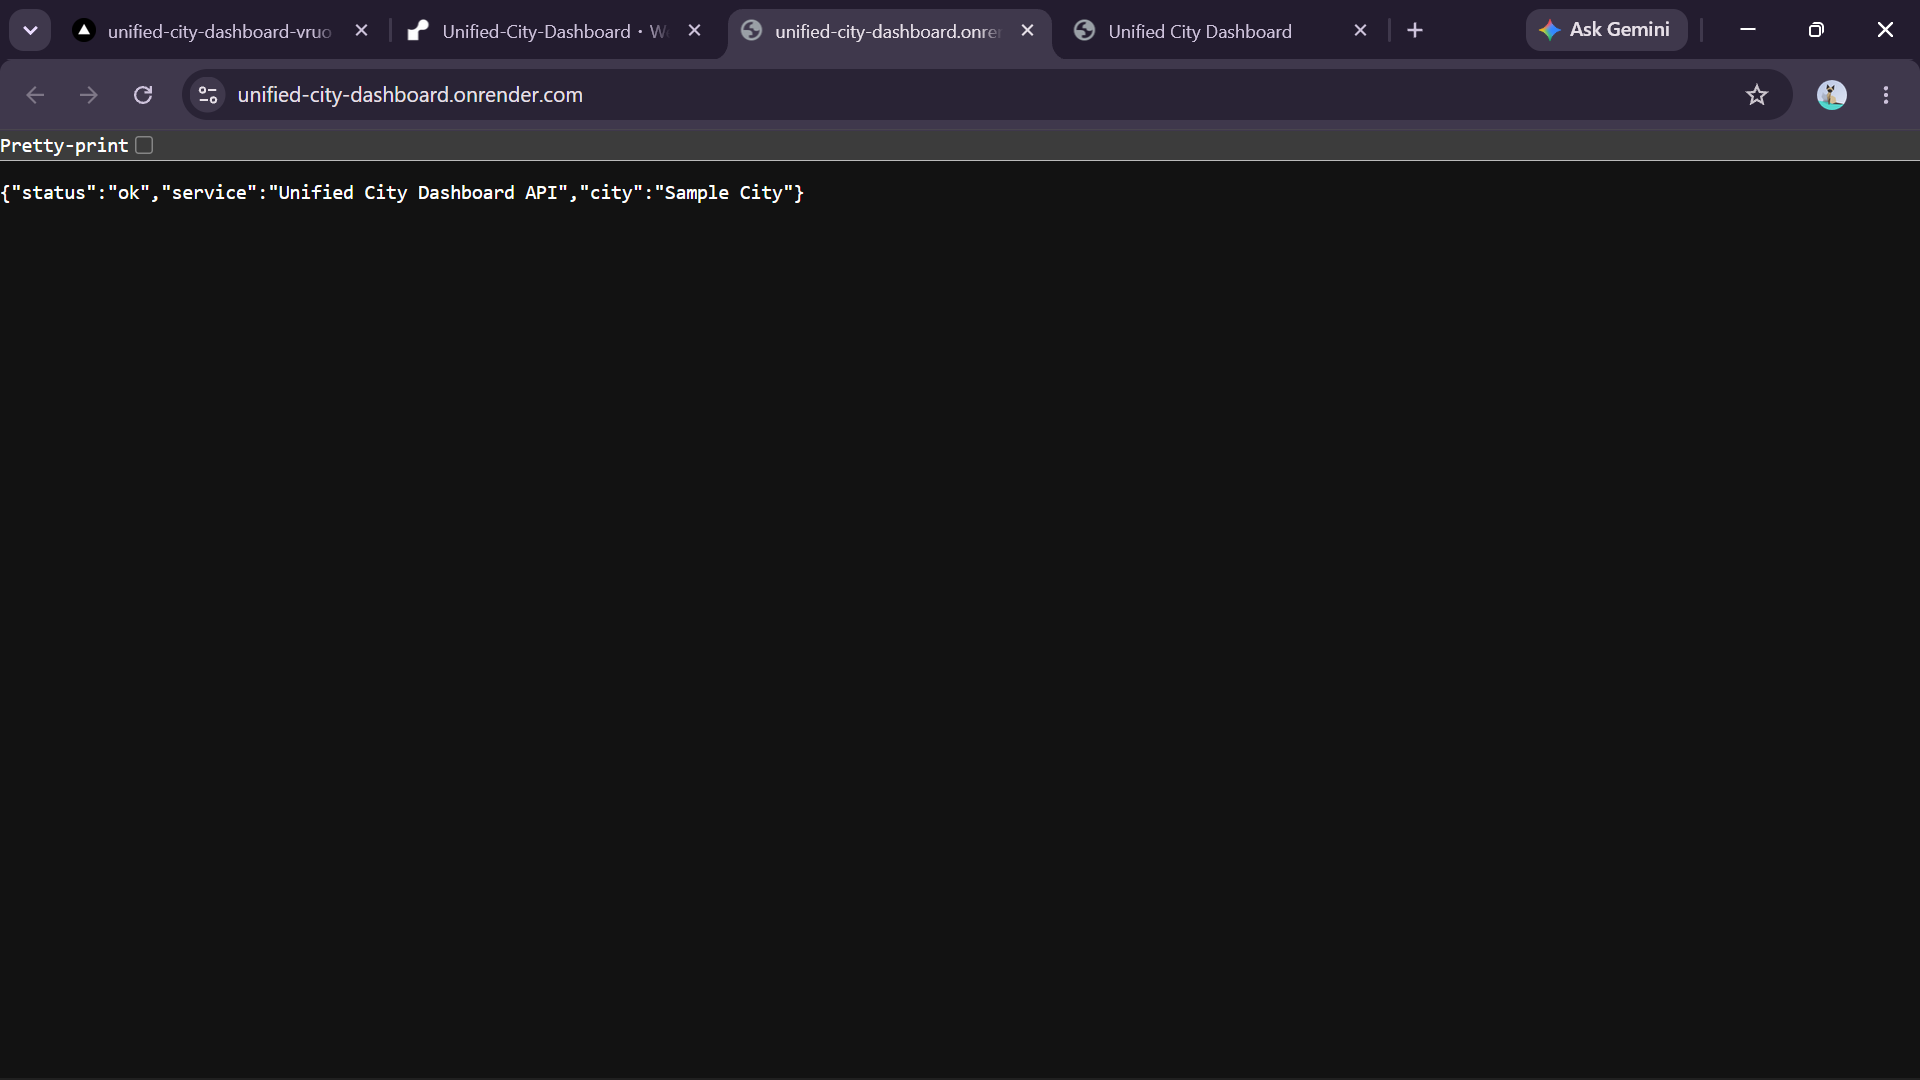
- Backend: Render (free tier)
- Kafka: Aiven (free tier)
- PostgreSQL: Neon (free tier)
- Redis: Upstash (free tier)
Challenges We Faced
1. Kafka SSL Authentication: Configuring SASL_SSL with Aiven's CA certificate required explicit ssl.ca.location configuration in the Kafka client.
2. Map Tile Rendering: CartoDB tiles required an API key, which we replaced with OpenStreetMap raster tiles (free, no key, always works).
3. Container Height Issue: The map was rendering with 0px height because the parent container lacked a defined height. Fixed with flexbox layout.
4. Environment Variable Management: Ensuring all services (Vercel, Render, Aiven, Neon, Upstash) had the correct environment variables for cross-service communication.
5. Real-time Data Fusion: Combining data from 4+ different APIs with different formats and update frequencies into a unified streaming pipeline.
Accomplishments We're Proud Of
- Zero-cost production deployment – Entire stack running on free tiers
- Real-time data from 4+ sources – Traffic, air, transit, waste all live
- ML-powered forecasting – RandomForest model predicting congestion
- Fault-tolerant design – Circuit breakers ensure dashboard never breaks
- Beautiful, responsive UI – Dark theme with live updates
- Open-source & scalable – Can be deployed in any city with open APIs
What We Learned
- How to build a complete streaming data pipeline with Kafka
- How to integrate ML models into production systems
- How to deploy full-stack applications on free cloud tiers
- How to handle real-time WebSocket connections
- How to design fault-tolerant systems with circuit breakers
What's Next for Unified City Dashboard
- Expand data domains – Add energy, water, public safety
- Real digital twin – Full 3D city simulation with agent-based modeling
- Mobile app – Citizen-facing app for real-time city info
- More ML models – Predictive maintenance, anomaly detection
- Open data portal – Expose city data as open APIs
- More cities – Onboard any city with open data APIs
Built With
- apache
- city
- css
- data
- fastapi
- html
- javascript
- kafka
- learning
- machine
- open
- postgresql
- python
- react
- real-time
- smart
- tech
- timescaledb
- typescript
- urban
- visualization
- vite


Log in or sign up for Devpost to join the conversation.