-
-
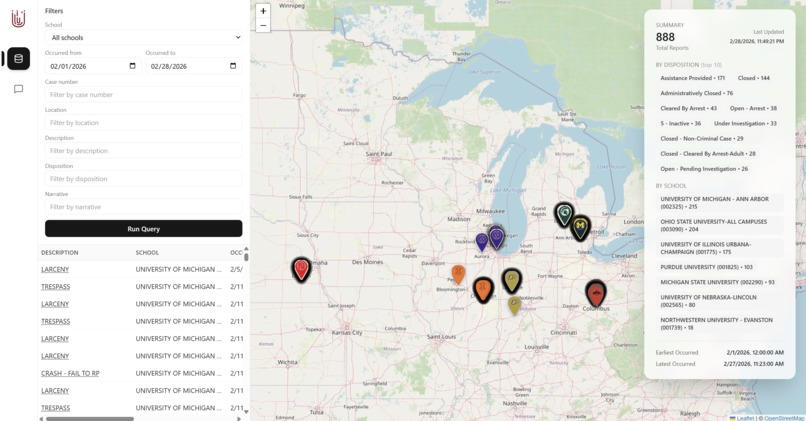
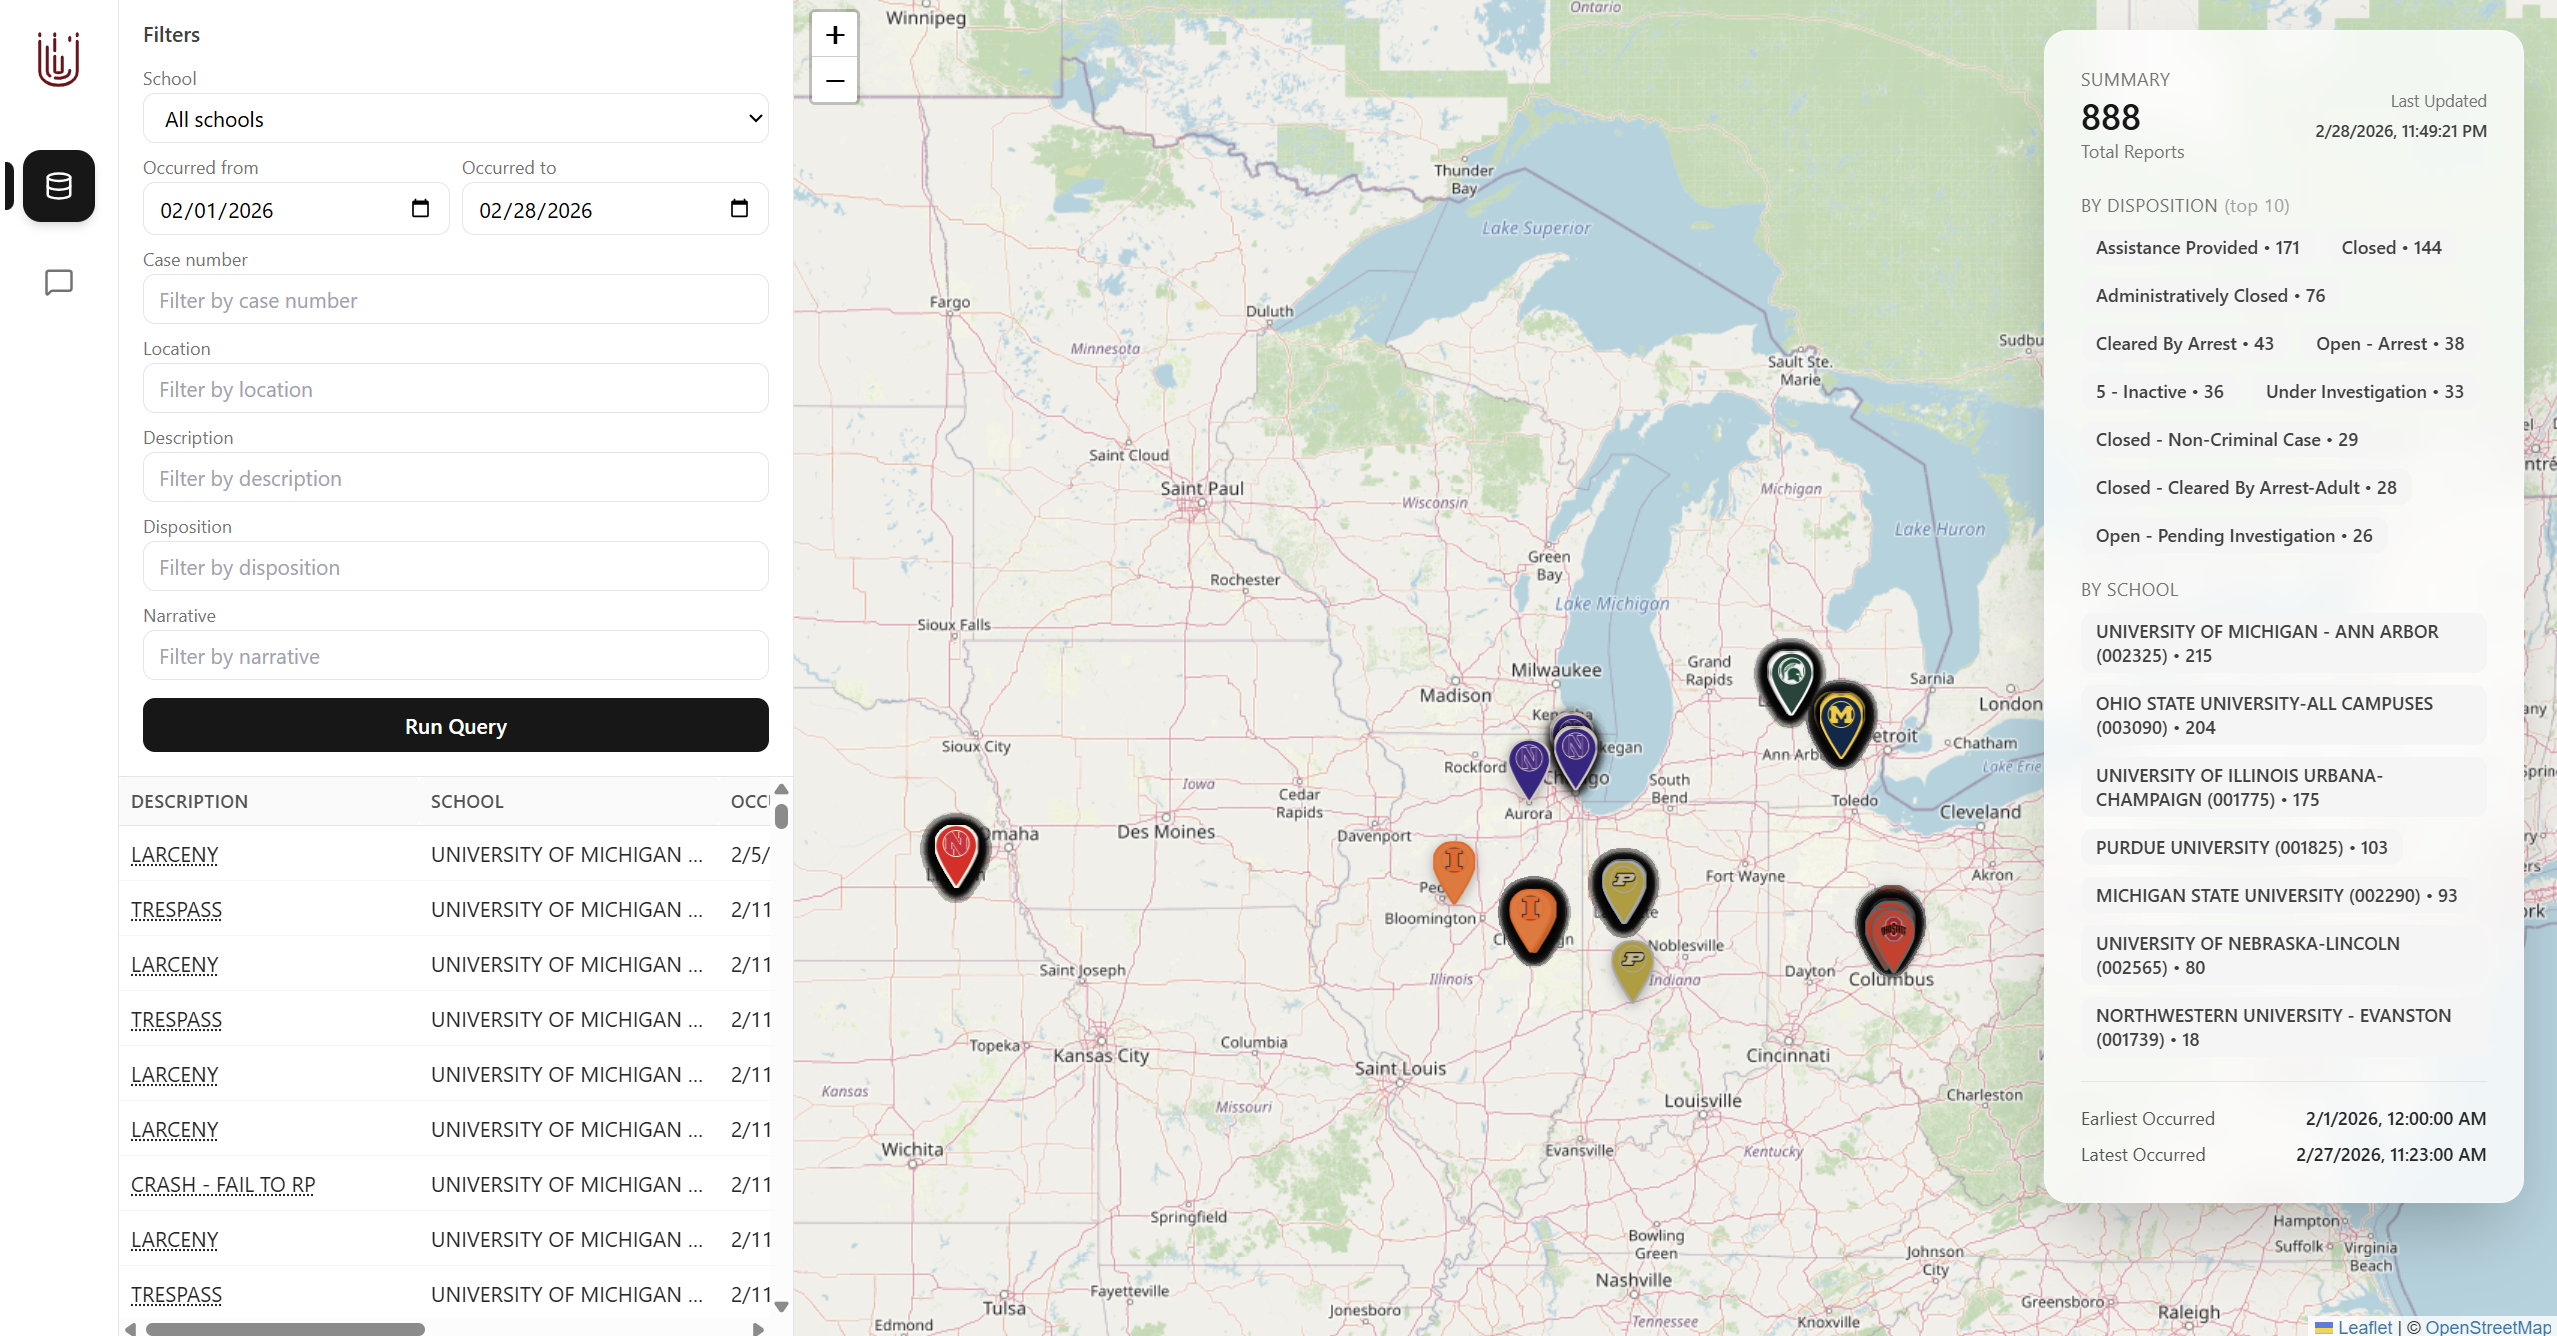
Main view showing all data across all universities
-
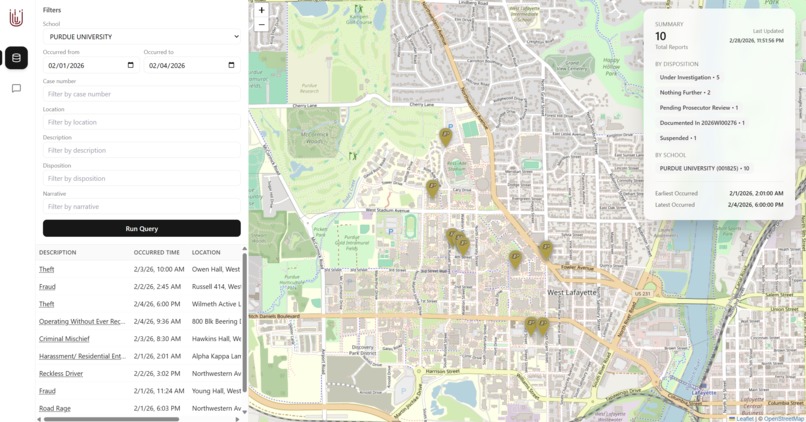
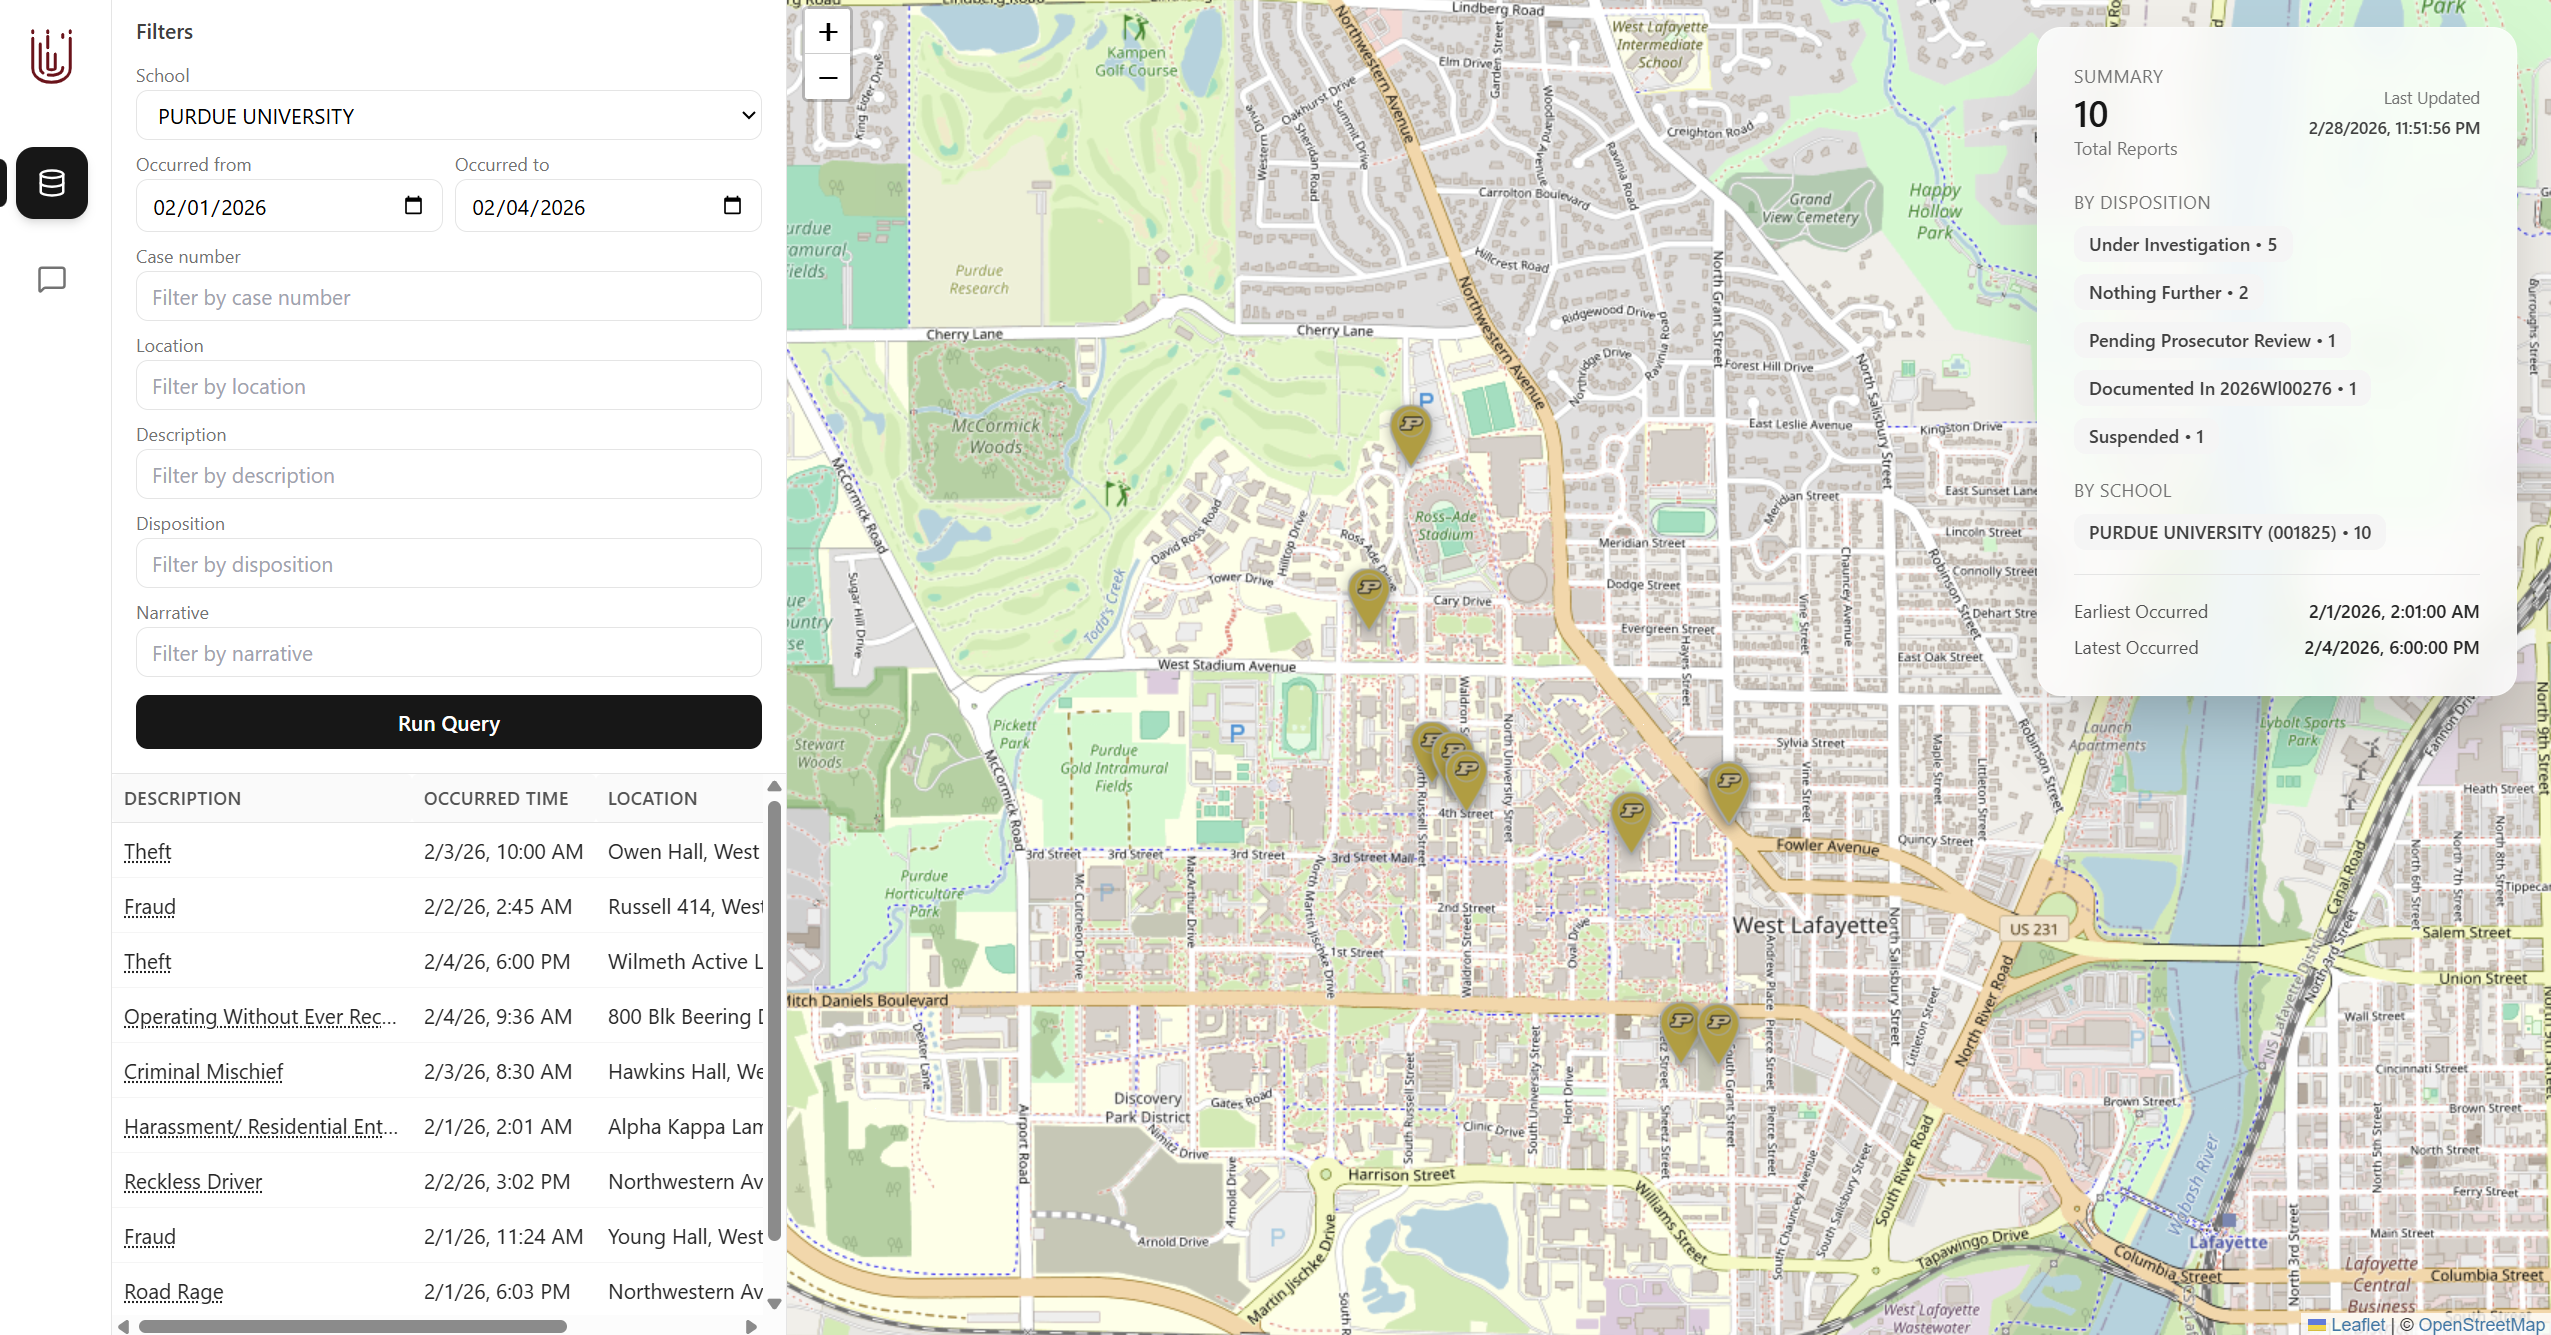
Filtered view for Purdue University
-

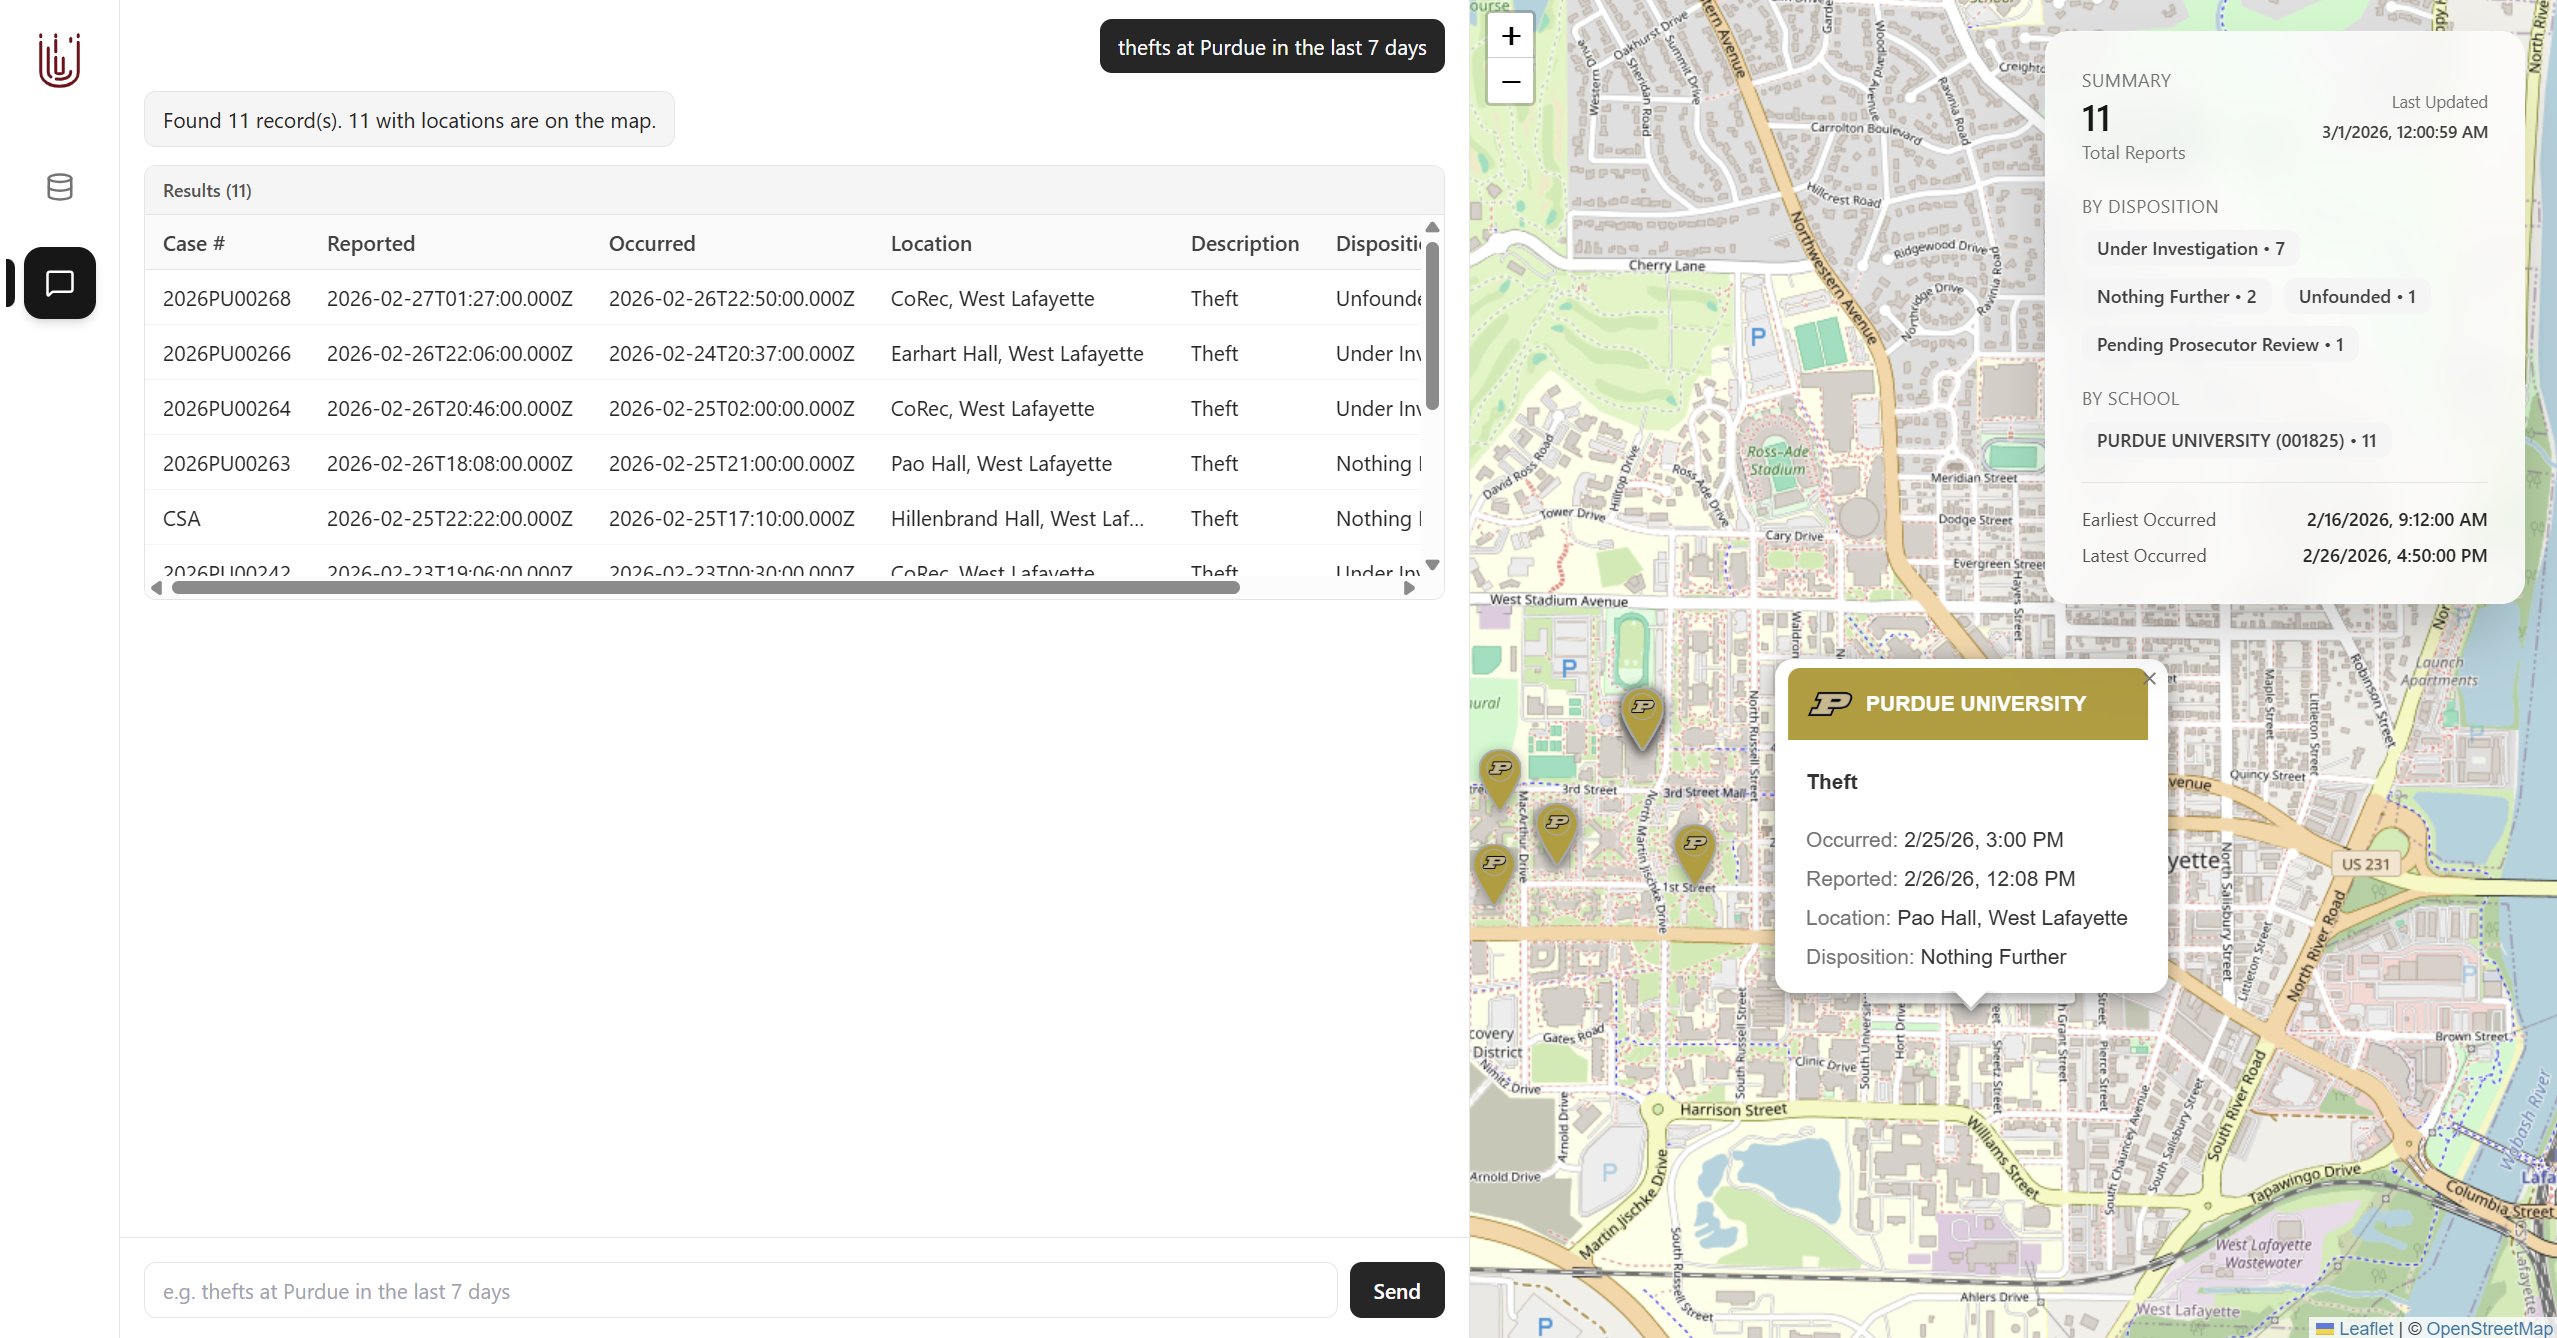
LLM inference at work
-
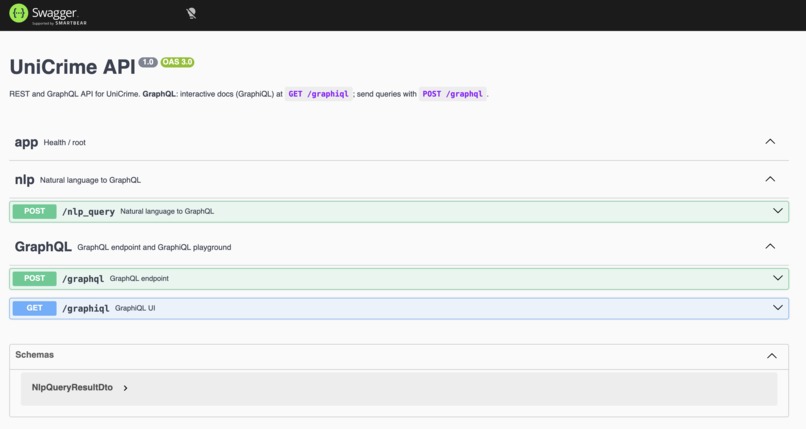
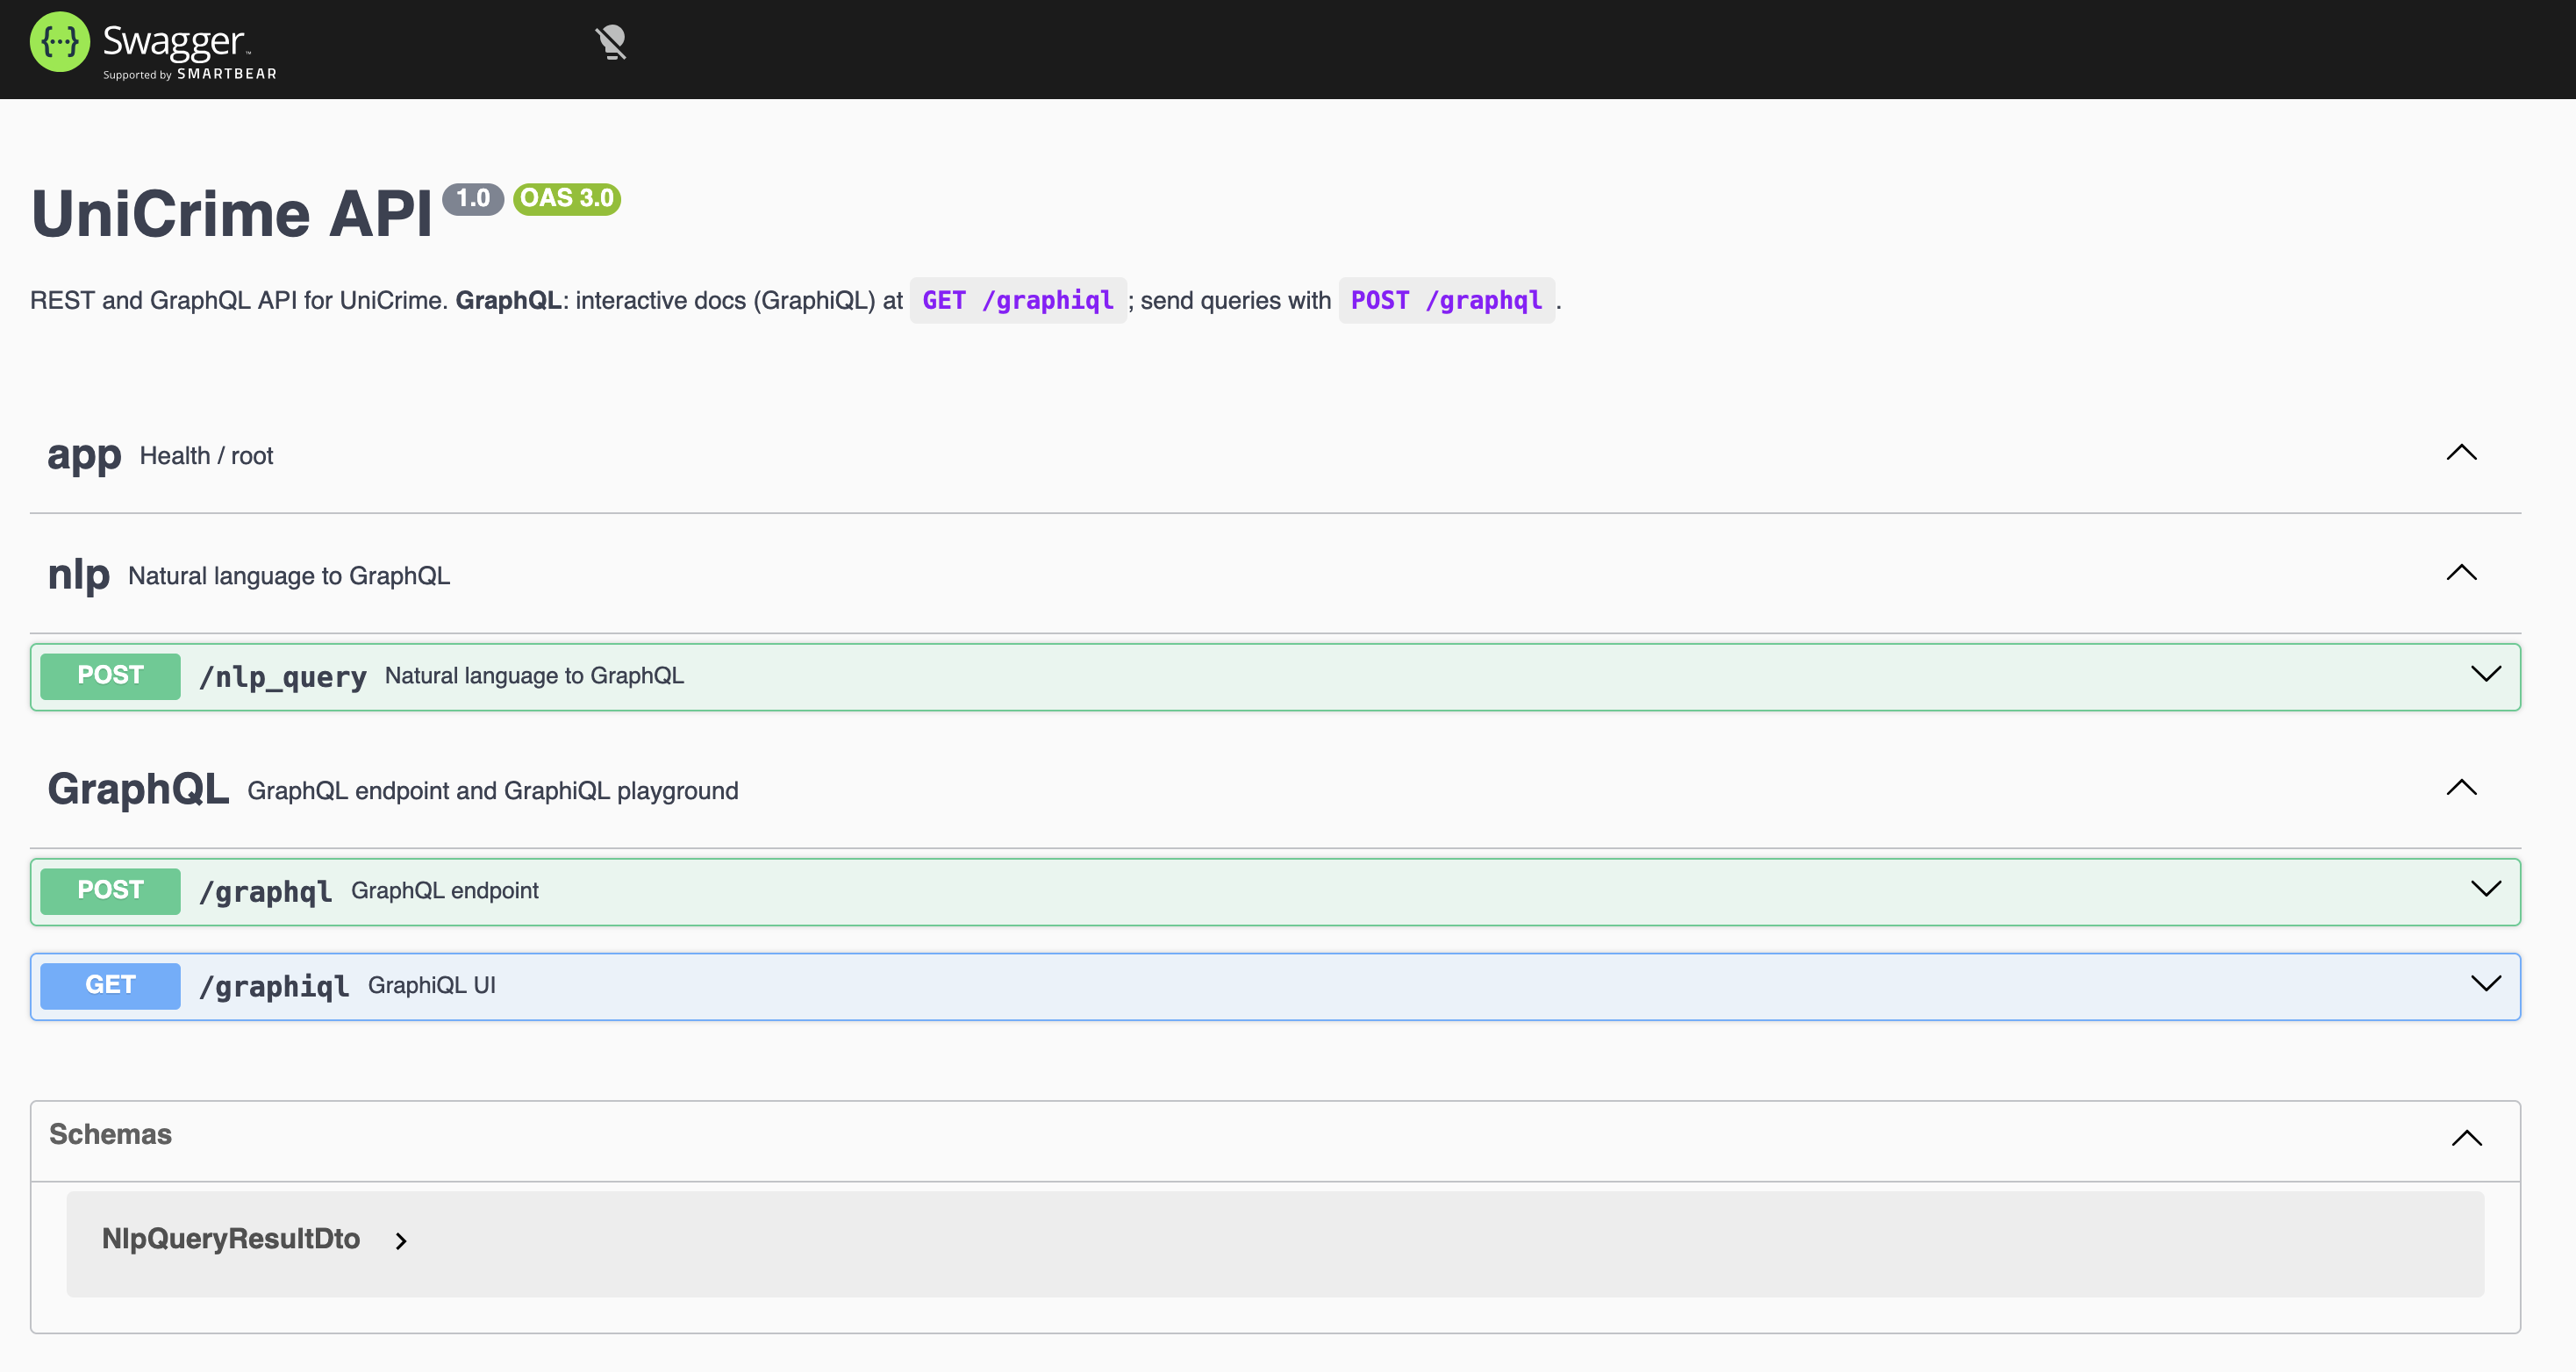
Documentation for our public API
Inspiration
Daily crime logs of universities are federally mandated to be publicly available, per the 1998 Jeanne Clery Disclosure of Campus Security Policy and Campus Crime Statistics Act (Clery Act). However, this data is only available on each university's website in tabular format. We thought this data was difficult to parse through, as it isn't available through any queryable API, and also because it lacks any visual component. This led us to build such an API, along with a frontend that demonstrates its usefulness.
What it does
Our GraphQL API allows users to query their university's crime report data by date range, case number, location, description, disposition, and narrative (all fields available on most university crime reports). Our accompanying website interfaces with this API and visualizes the locations of the crimes on a map. We also have an option for the user to input a natural language prompt to semantically query our API.
How we built it
We started by parsing through a selection of different universities' crime reports. We found each report differed slightly in format, both in terms of the fields they have and in how they're made available on the website, in formats such as HTML tables, CSV downloads, Tableau dashboards, Power BI dashboards, and raw JSON data.
We prepared a per-university script to fetch the data via webscraping (or just downloaded the raw data), then another per-university script to standardize this data to fit our database schema, which was then uploaded to a Postgres Database on Supabase.
In the process of standardizing our data, we added latitude and longitude fields to each incident using Google's Geocoding API. This was crucial to visualize the data on our website.
With our data prepared, we created a GraphQL API to fetch and filter this data, along with a React.js frontend to interface with it. We used Leaflet.js to visualize our data on a map and the OpenAI API to perform natural language inference to generate an API query.
Challenges we ran into
One of the main challenges came from the differing formats of crime report data across universities, causing us to make individualized scripts to fetch and clean the data. Another was getting the natural language inference to work - we did this by prompting the model to output a valid GraphQL query, but faced issues with how long the model took, as well as with the reliability of its output.
Accomplishments that we're proud of
We overcame the difficulties of differing data formats across universities by implementing specialized scripts for extraction and formatting. We're also proud of the way we were able to interface our API with a website and natural language inference.
What we learned
We learned that data cleaning is one of the hardest challenges to overcome with a project - trying to reconcile different sources with different formats into a unified schema posed a significant challenge. From this, we learned the importance of having a standardized data format that is widely accessible, so that others can interact with it with minimal friction.
What's next for UniCrime
Implementing an automated script to re-fetch data from universities, as well as a script that can automate gathering data from a new university without needing to manually create a specialized script for it. Also, we would like to improve the speed and accuracy of the natural language inference.
Built With
- google-maps
- graphql
- leaflet.js
- openai
- python
- react
- supabase
- typescript


Log in or sign up for Devpost to join the conversation.