Inspiration
In 2024 the polls leaned too Democratic in 28 of the 30 states we checked, by 3.2 points on average, and missed Michigan and Wisconsin outright. Polls ask people how they will vote. We wanted to ask a different question: what do places actually love, and does that tell you anything the polls can't? Qloo knows the tastes of every corner of the country, from Duck Dynasty and Dan Bongino to Beyoncé and Succession. Undertow puts that culture next to the polls for every 2026 Senate and governor race, from the whole country down to a city block.
What it does
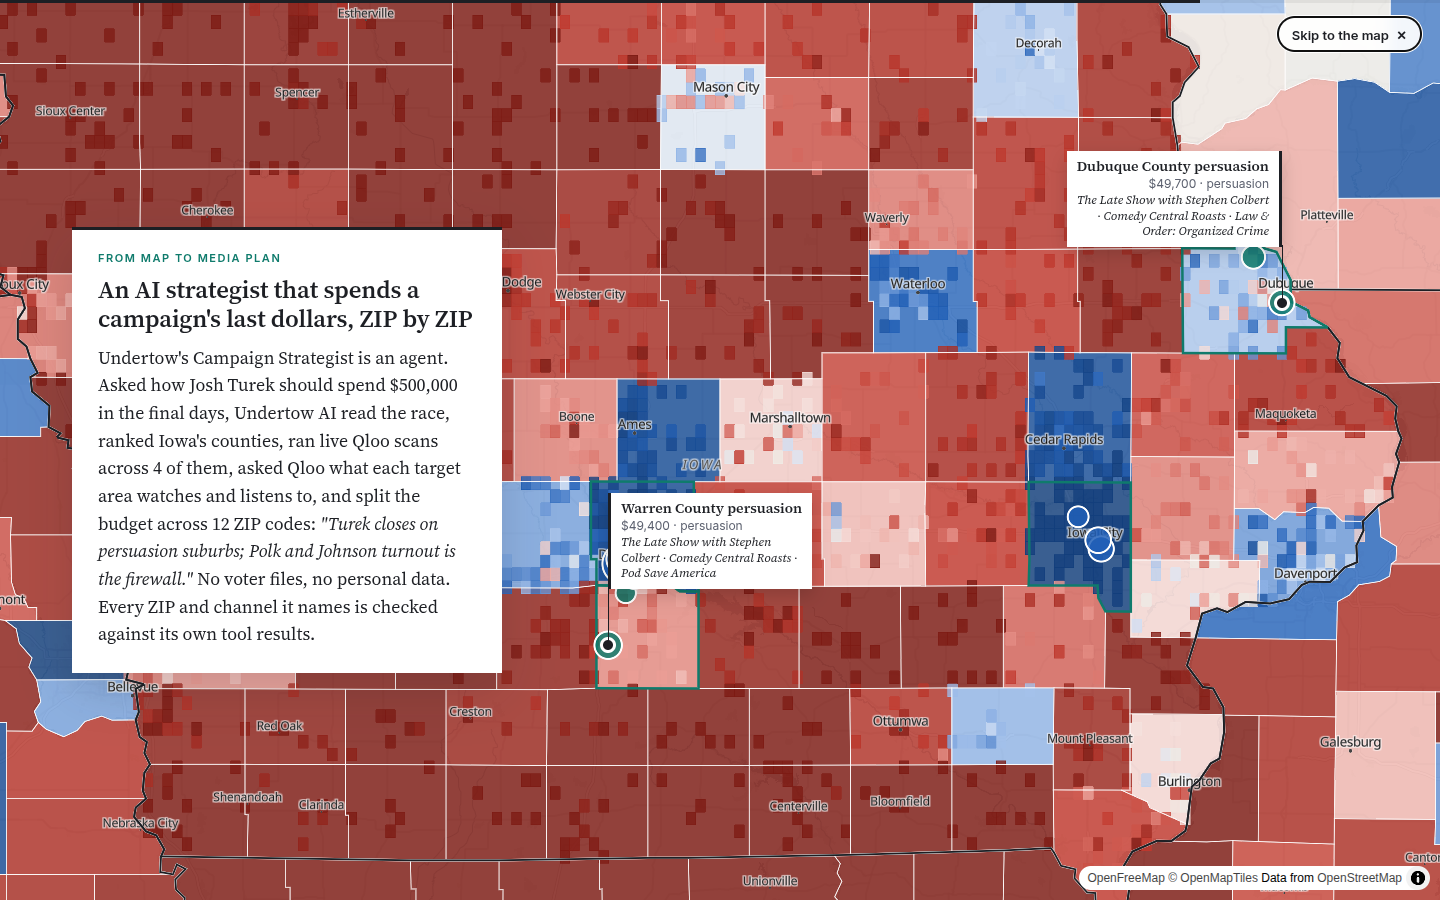
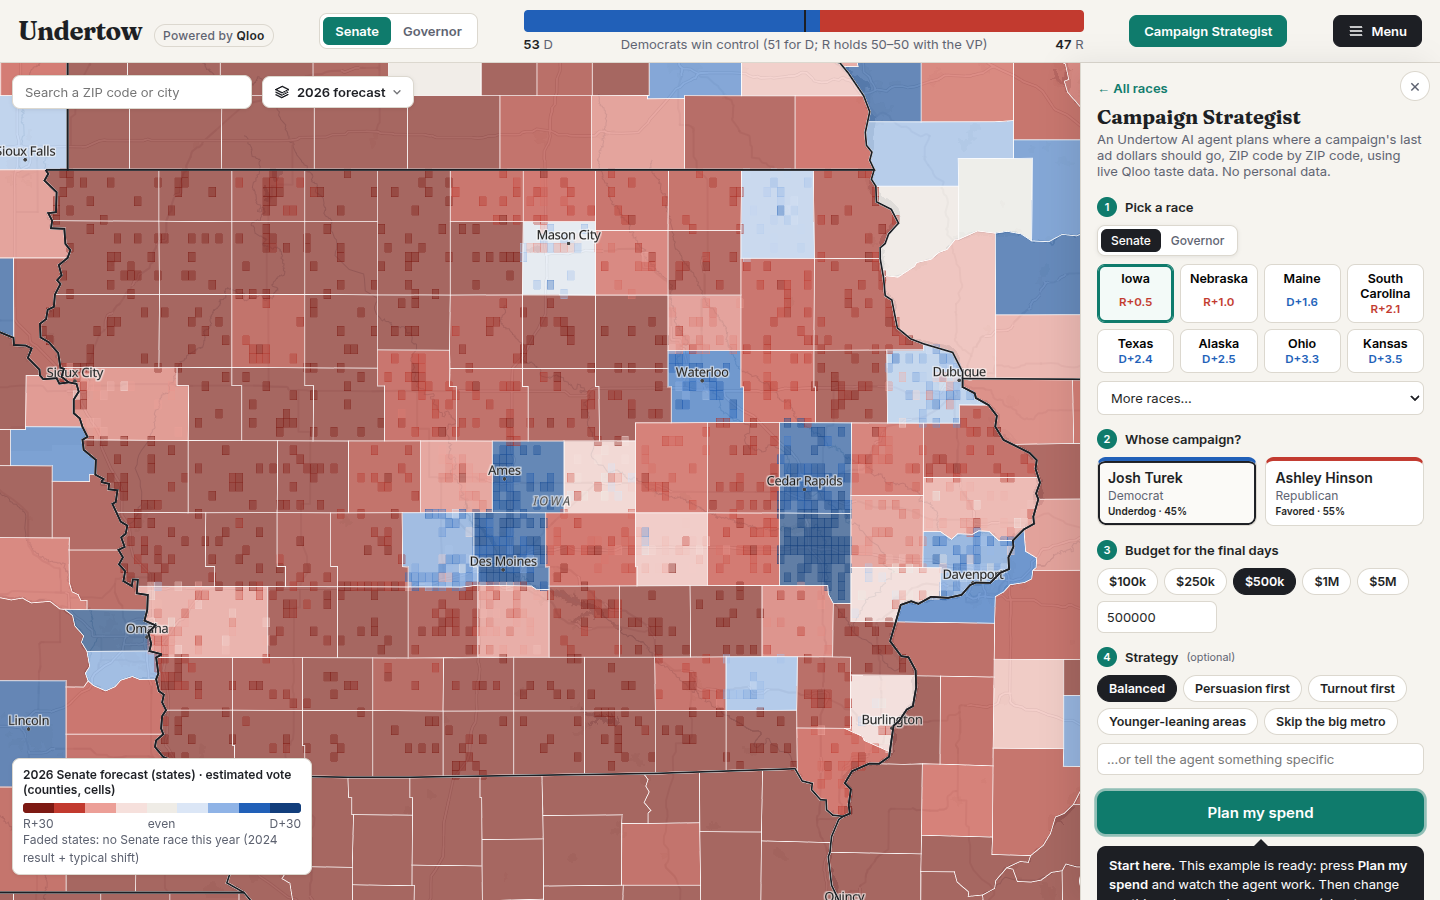
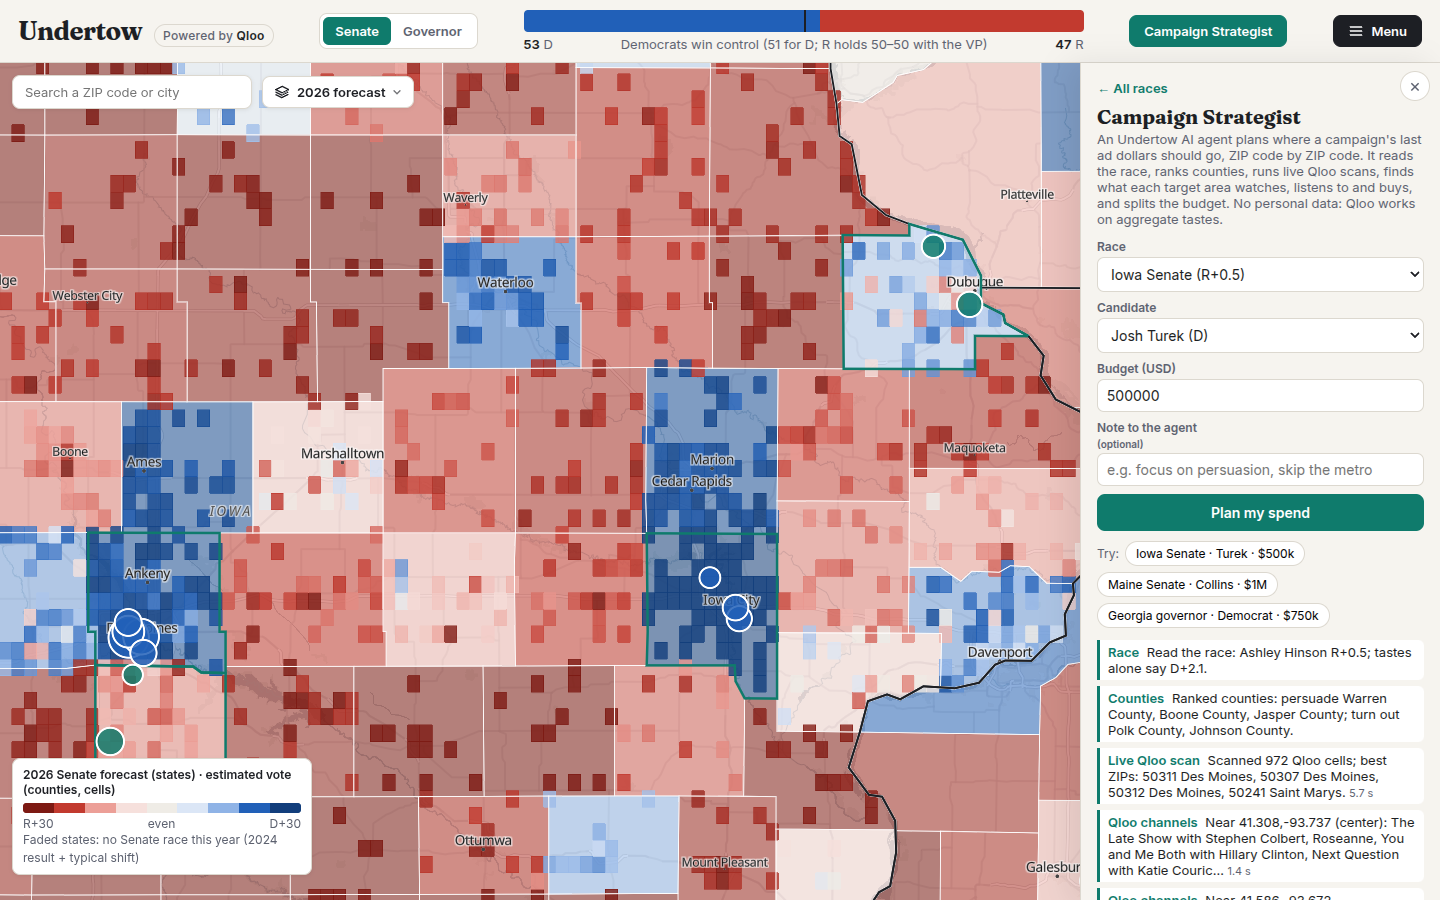
- Campaign Strategist (an agent). Pick a race, a candidate and a budget. Undertow AI plans the last days' ad spend ZIP code by ZIP code: it reads the race, ranks counties into persuasion and turnout targets, runs live Qloo scans across them, asks Qloo what each target area over-indexes on (shows, podcasts, brands, artists, optionally among politically center or partisan audiences), and splits the budget. Its steps stream live; the plan lights up the map and downloads as a CSV of ZIP codes ready for ZIP targeting on ad platforms. No voter files, no personal data. Example: $500k for Josh Turek in Iowa becomes 12 ZIPs: persuasion in Warren and Dubuque counties (Colbert, Comedy Central Roasts, Pod Save America, NPR), turnout in Des Moines and Iowa City.
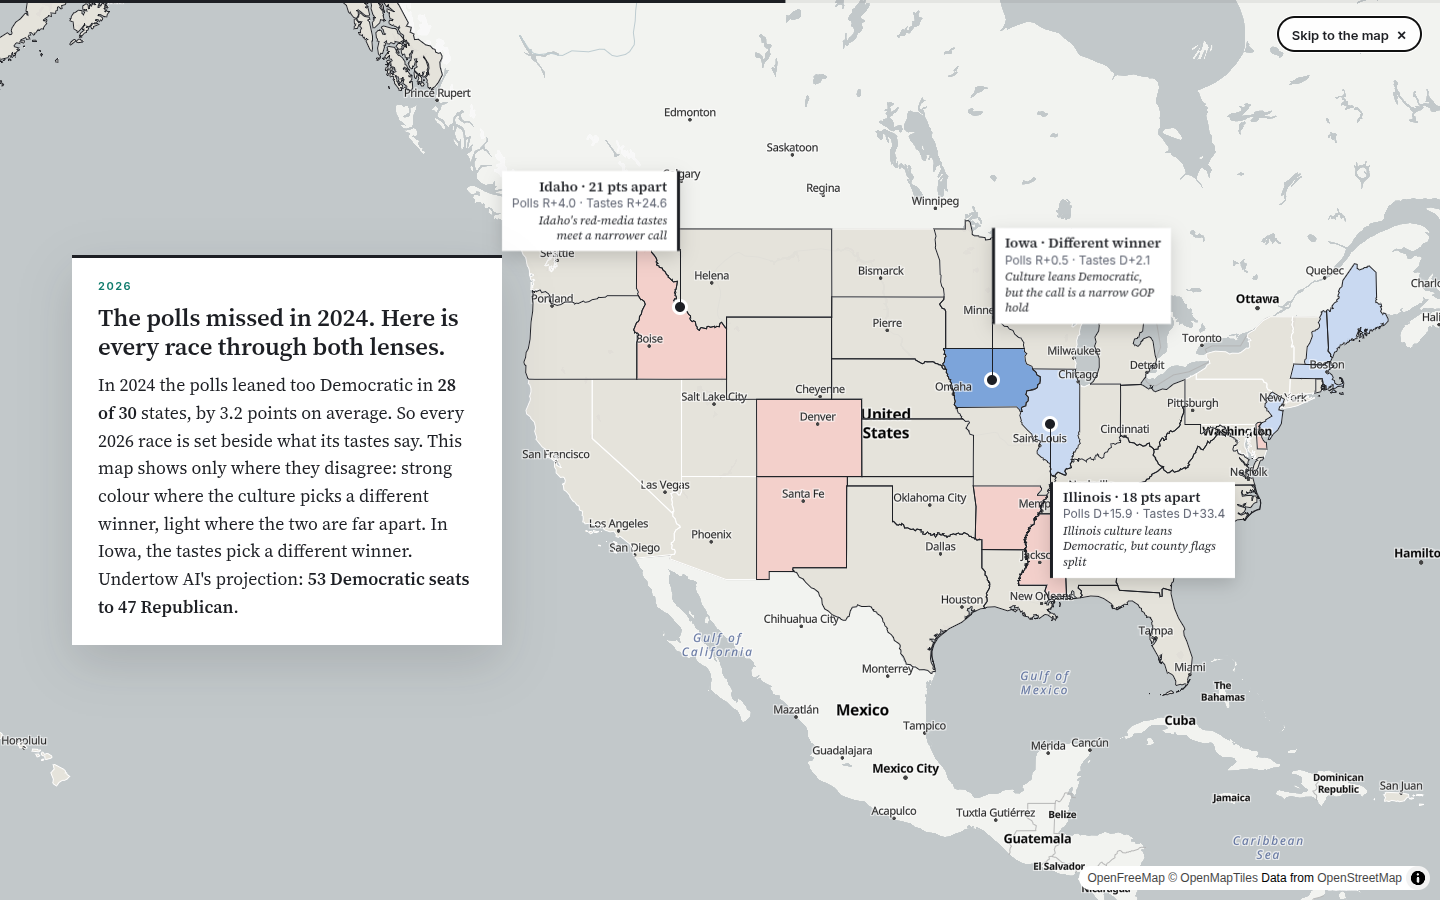
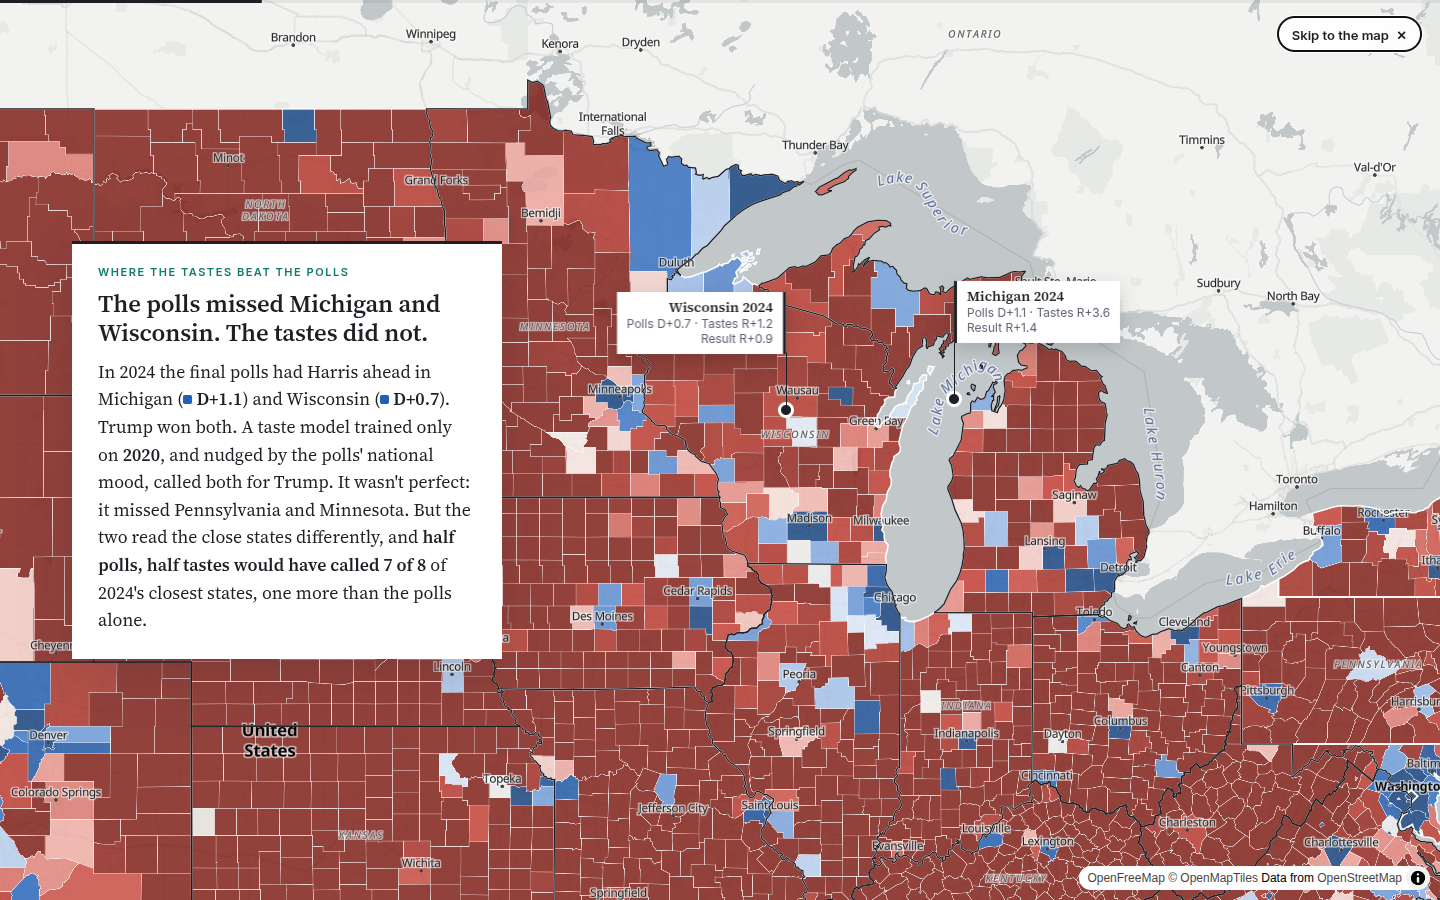
- Opens as a story. A scroll-driven, newspaper-style walkthrough over a full-screen map: the 2024 map redrawn from tastes alone, the two swing states the tastes caught and the polls missed, counties whose culture no longer matches their vote, every 2026 race seen through both lenses, and a live block-level scan of Detroit.
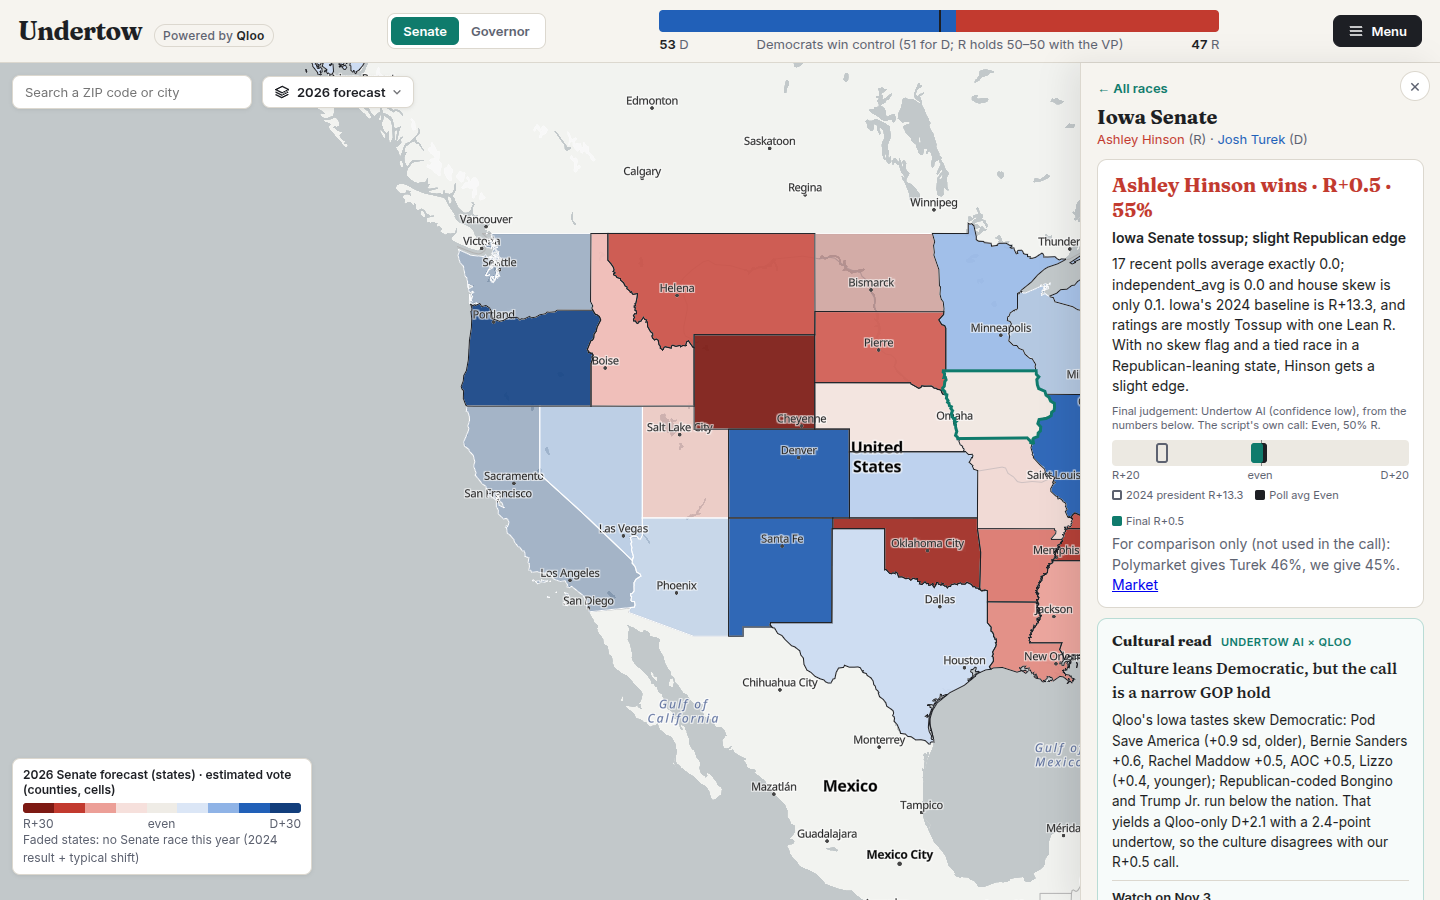
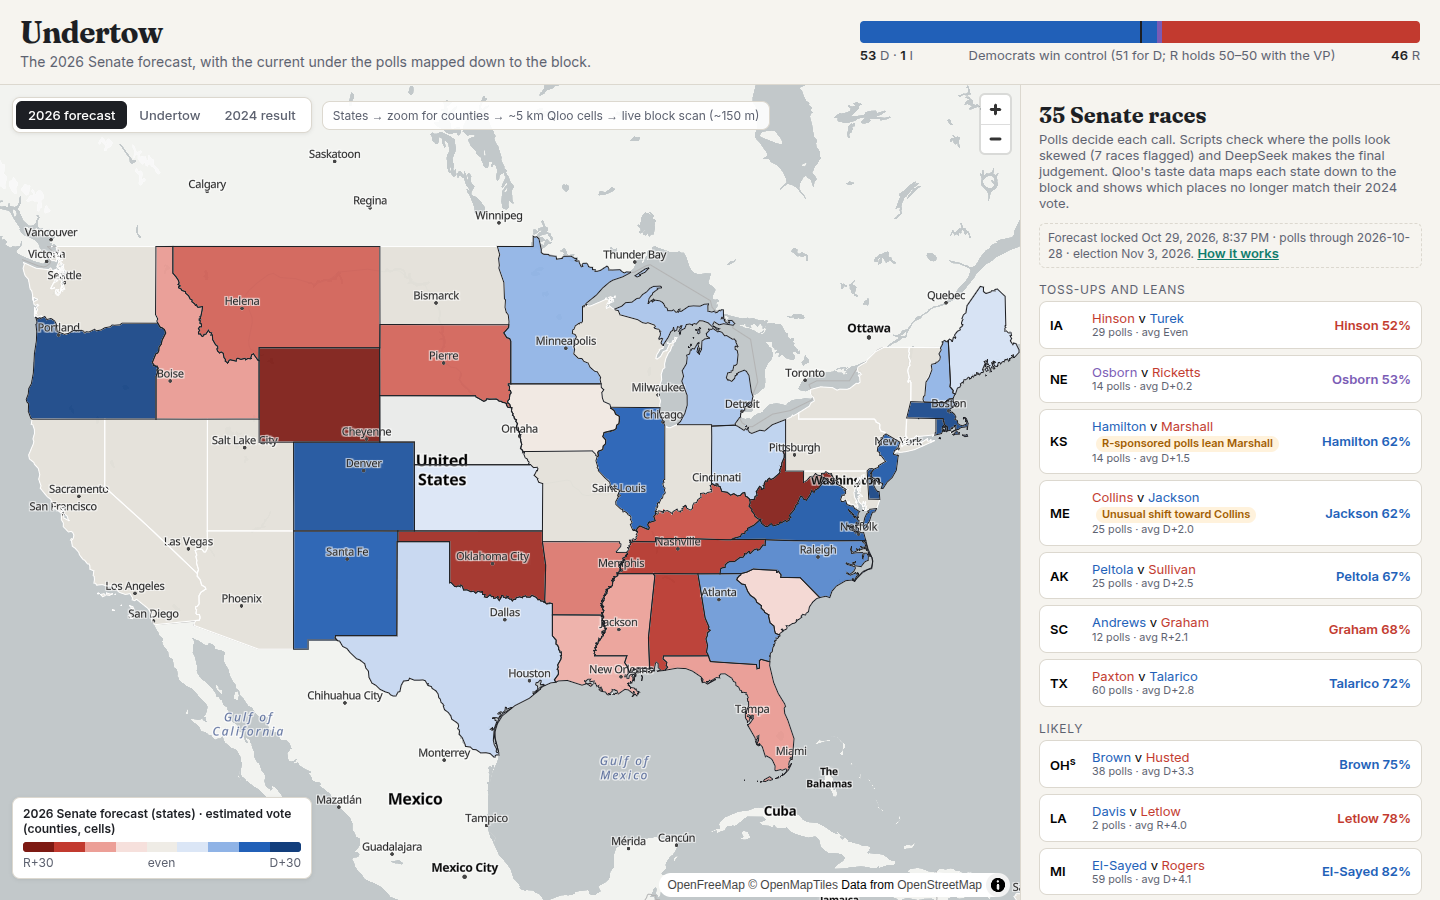
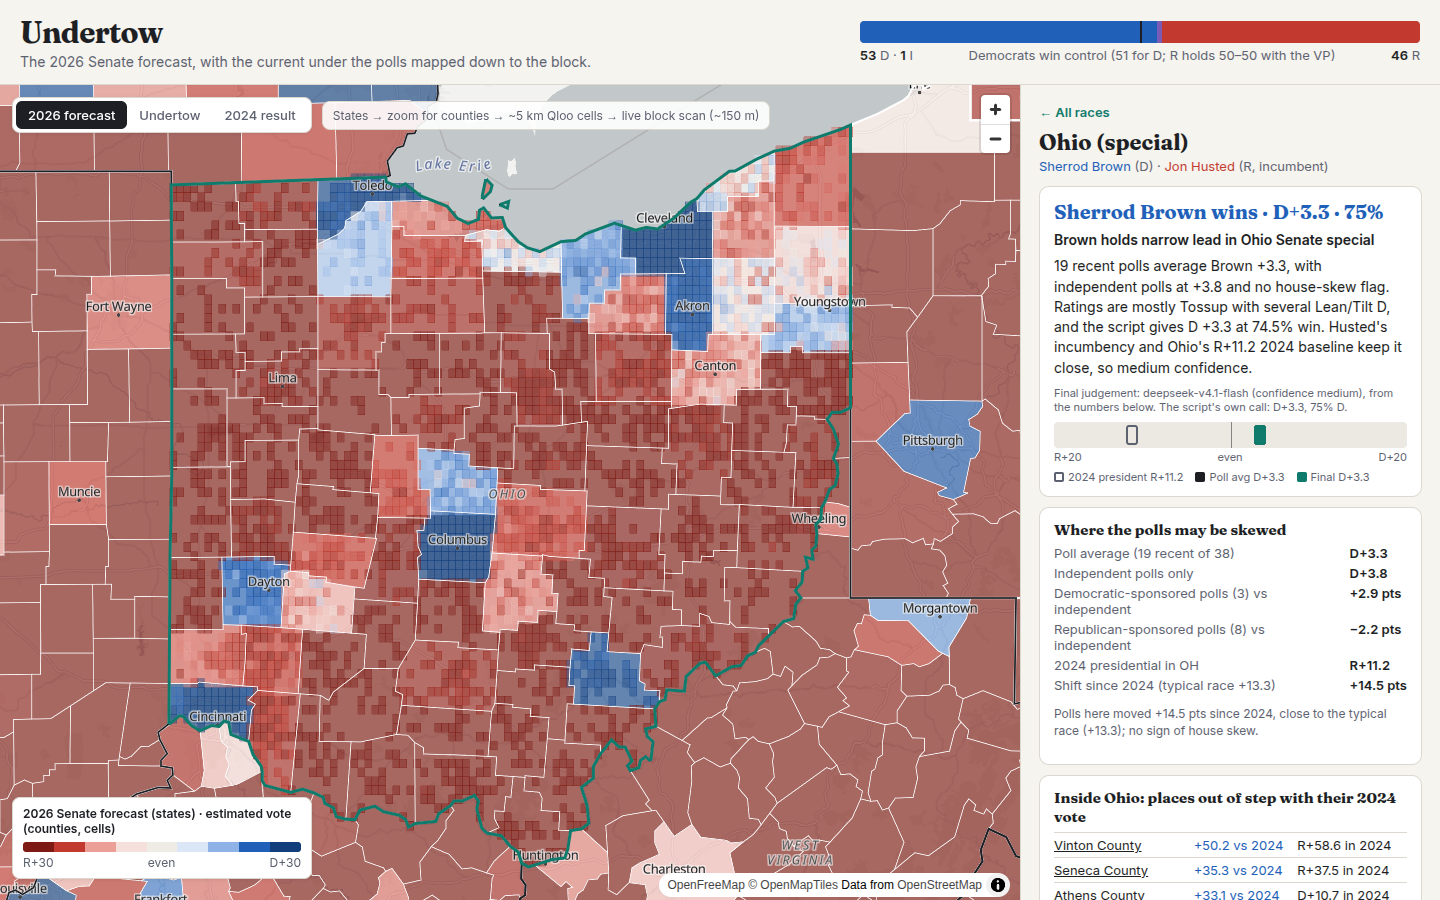
- Forecasts 71 races (35 Senate, 36 governor). Recent polls set the baseline; scripts check them for skew (party-sponsored vs independent polls, unusual shifts since 2024); Undertow AI, our LLM layer, makes each final call with a short reason.
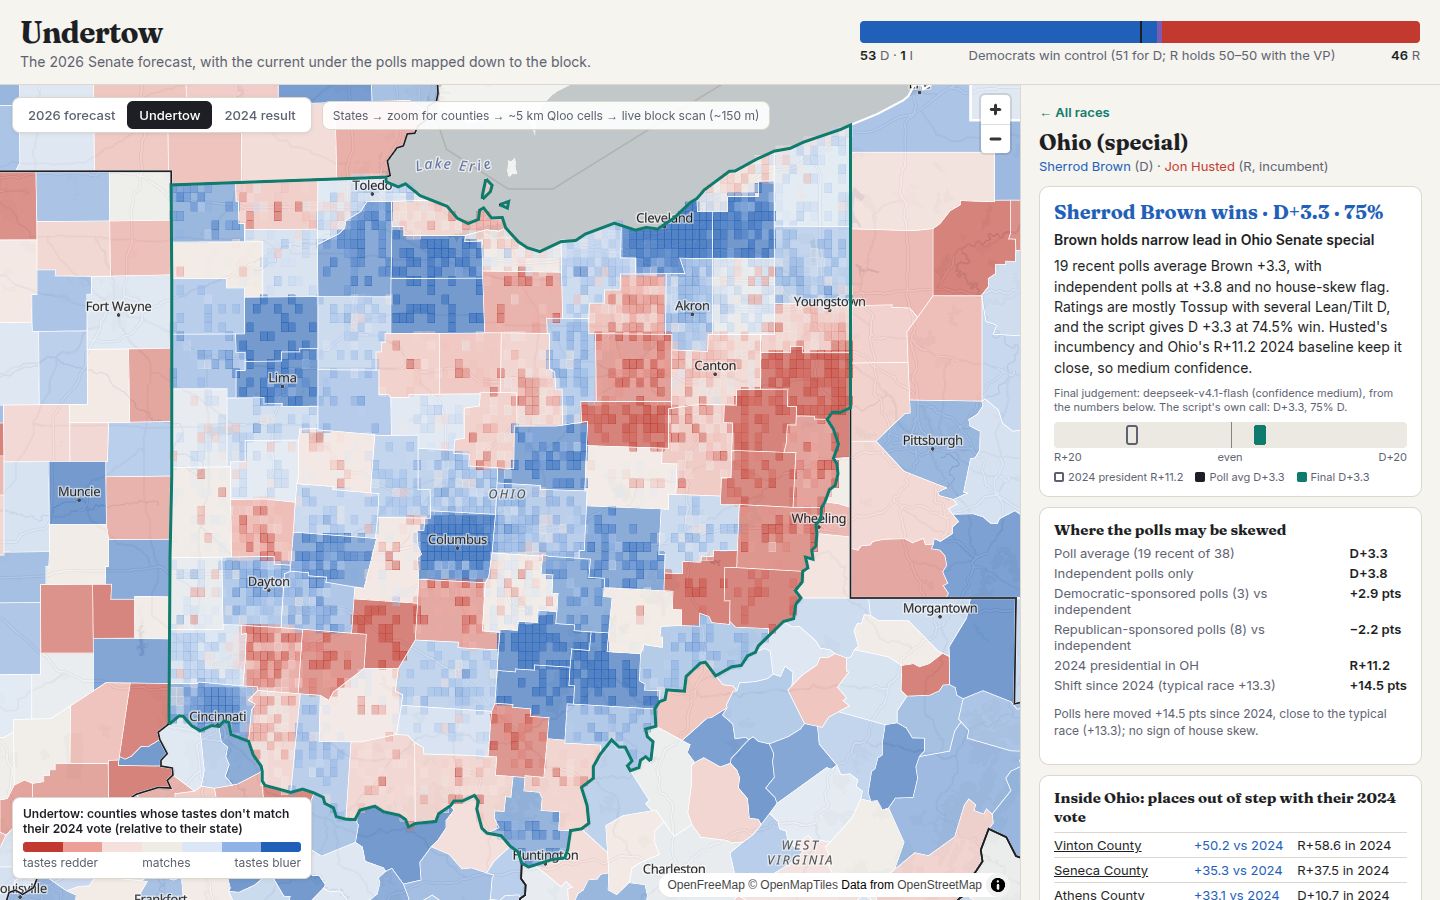
- Reads the culture for every race. Undertow AI writes a cultural read from Qloo's data only: which tastes the state loves more and less than the nation (and who their audiences are), which counties' tastes look bluer or redder than their 2024 vote, what tastes alone forecast, and how the signal did there in 2020→2024. Each read ends with places to watch on election night.
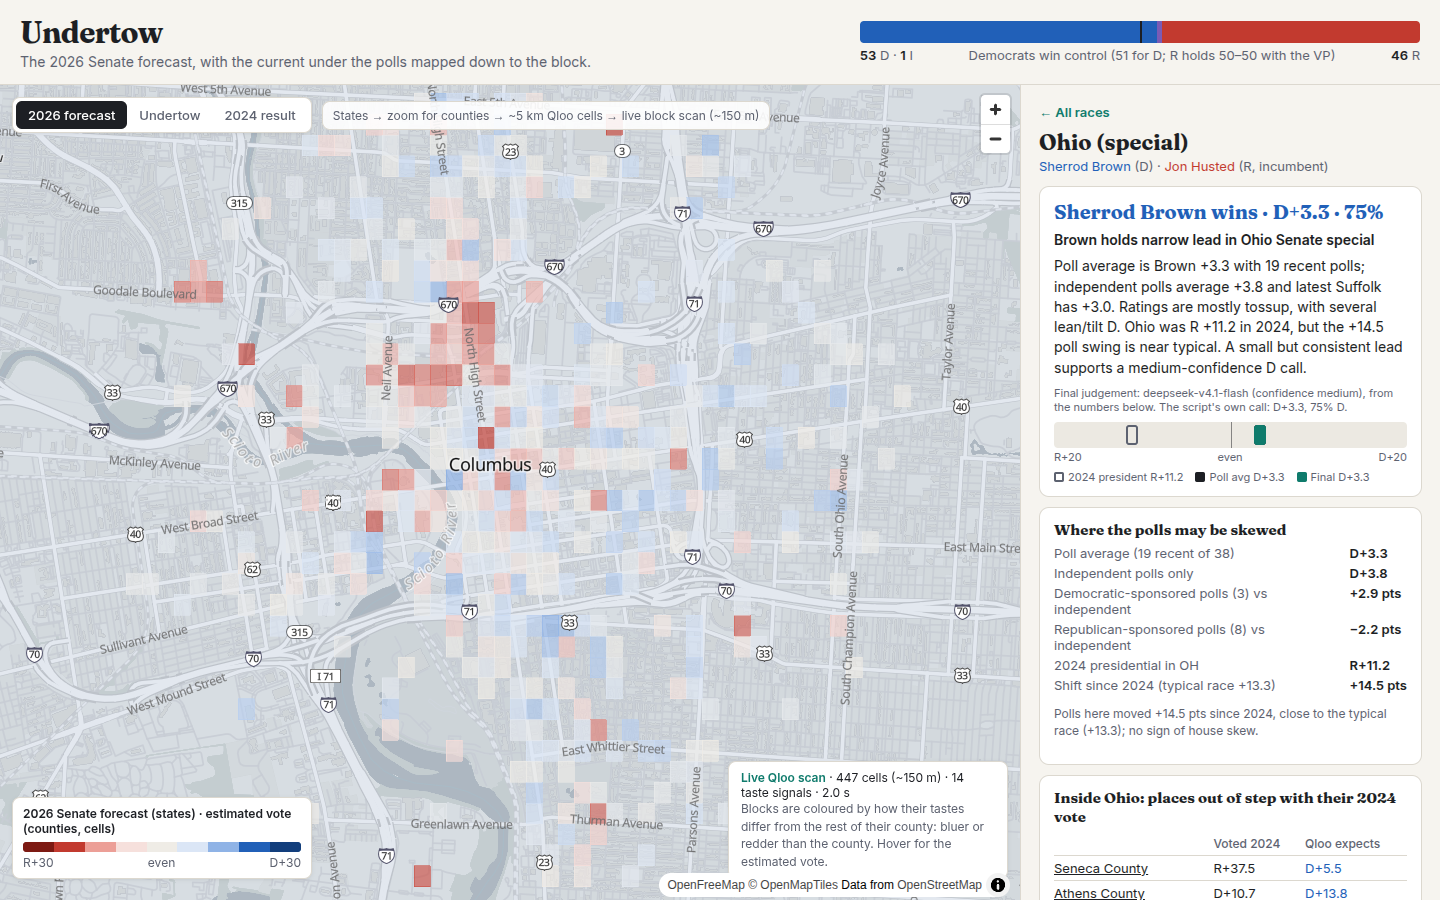
- Maps it at every scale. States → counties → Qloo's ~5 km heat cells → a live Qloo scan of ~150 m cells for any neighbourhood you zoom into or any ZIP code you search.
- Shows only the disagreements. A layer that greys out everything except where Qloo and the polls disagree: a different winner (Iowa's Senate race this year) or 8+ points apart.
- Compares with sliders. Drag a line across the map: 2026 forecast ↔ 2024 result, polls forecast ↔ Qloo-only forecast, Qloo's expected 2024 ↔ the actual 2024 result.
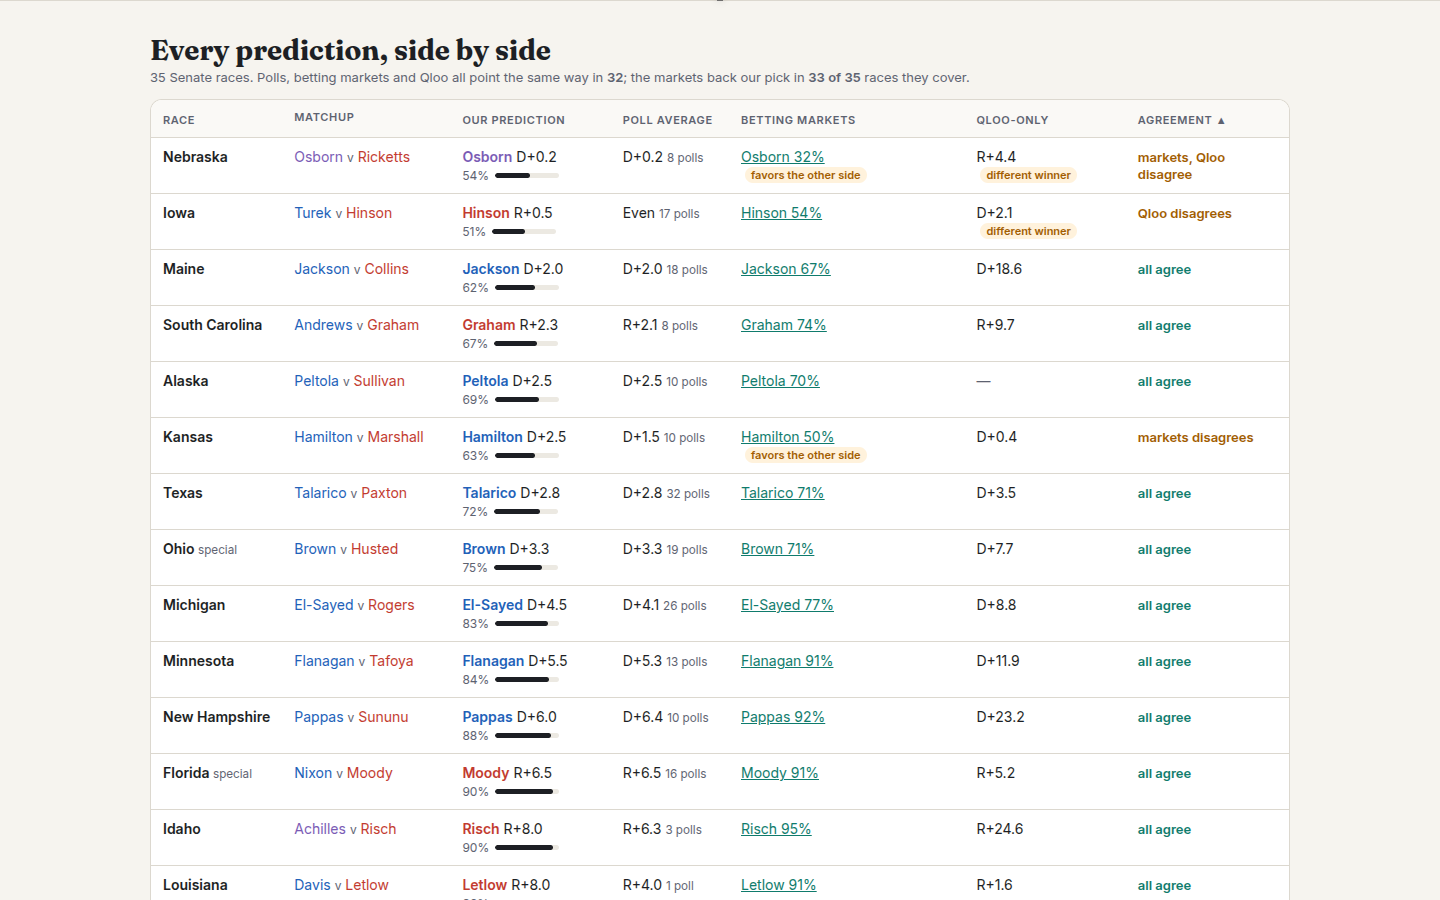
- Puts every prediction side by side in a sortable table: our call, the poll average, betting-market odds (Polymarket, shown for comparison only), Qloo-only, and a half-polls/half-Qloo blend.
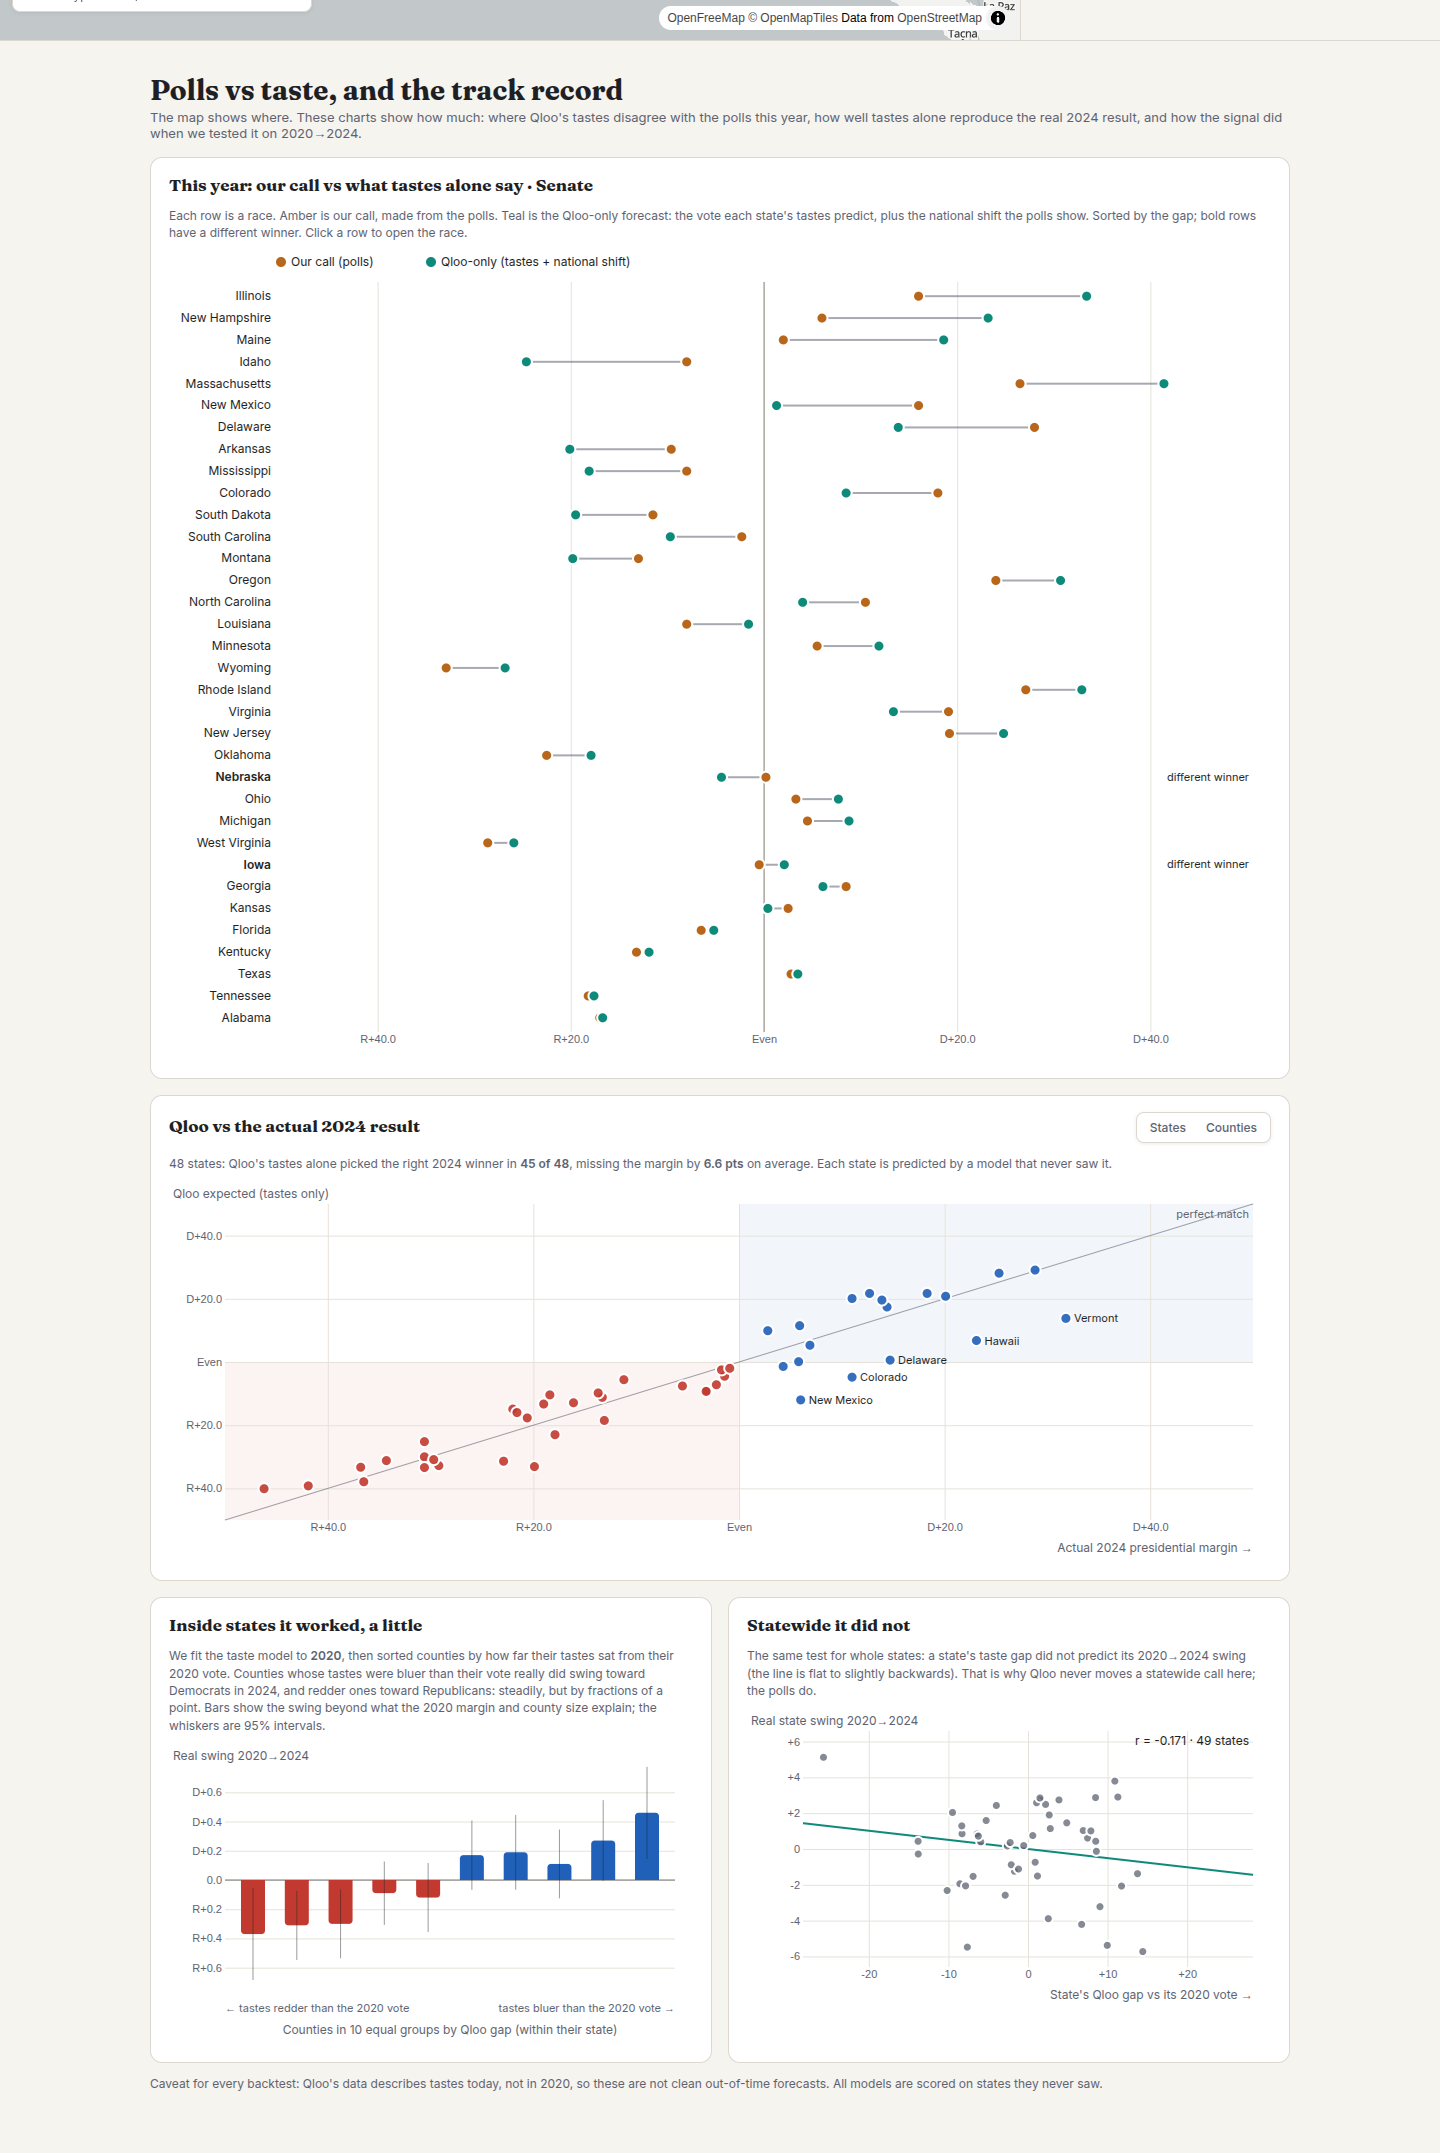
- Keeps score in public. D3 charts of polls vs taste for every race, Qloo vs the real 2024 result (by state or county), and the 2020→2024 backtests, including the ones that failed.
How Qloo is used
- Taste maps. We pulled Qloo heatmaps (
/v2/insights,filter.type=urn:heatmap) for 77 tastes across every state and nationwide, about 4,000 API calls, and mapped them onto 3,105 counties. - Taste → vote model. A taste is kept only if its pull points the same way in at least 80% of states after removing county size (24 survive: Duck Dynasty, Hannity and Dan Bongino lean Republican; Beyoncé, Kendrick Lamar and Succession lean Democratic). Every county and state is predicted by a model that never saw its state (leave-one-state-out). Ranking counties by how they vote: r ≈ 0.73 with Qloo vs ≈ 0.55 from county size alone.
- Who lives here. Qloo's
urn:demographicsgives each taste's audience age and gender; a county's profile is the mix of its tastes' audiences. - Live block scans. As you zoom, the server queries Qloo heatmaps around the map centre (
filter.location+ radius) for the strongest tastes and scores each ~150 m cell against its county. - The undertow. The gap between what a place's tastes predict and how it voted in 2024.
How the LLM is used (Undertow AI)
- Campaign Strategist agent: a tool-calling loop (get_race, rank_counties, scan_zips, find_channels, allocate_budget). The model decides which counties to scan and where to look for channels; the tools call Qloo live. The final plan is validated: every ZIP and channel must come from its own tool results, budgets are rescaled to the total, and the rules forbid invented candidate positions, incentives to vote and deceptive content. Runs are rate-limited and cached.
- Final judgement for each race: reads the script's numbers (poll averages, sponsor skew, 2024 baseline, published ratings) and makes the call with a reason. It has no tools; answers are validated (party, probability range, no more than 8 points from the script) and the script's call stands in if it fails.
- Cultural read for each race: turns Qloo-derived facts into an explanation and a watch list. It can only name places that appear in its input, which is checked automatically.
- Runs in batch when the forecast is refreshed, not on page views.
The track record (what we tested, honestly)
| Test | Result |
|---|---|
| Tastes alone redraw the 2024 map | right winner in 45 of 48 states (each predicted by a model that never saw it) |
| Inside states: did counties flagged on 2020 move that way in 2024? | yes in 34 of 45 states |
| 2024 swing states the polls got wrong | tastes (trained on 2020 only) called Michigan and Wisconsin correctly |
| Half polls, half tastes on 2024's 8 closest states | 7 of 8, vs 6 of 8 for the polls alone |
| Statewide undertow as a predictor of swing | did not work (r = −0.17), so it is shown as a clue, not used in calls |
| Margins | polls were closer (3.5 vs 6.2 pts), which is why our headline call keeps the polls and shows the blend beside it |
We also tested and dropped Qloo's age-group heatmaps (The Villages, FL read as average age) and Qloo's trend data (political names stop by late 2024; whole categories are rescaled over time; demographic filters are ignored). The app's Help panel lists all of it.
How we built it
Python pipeline (pandas, numpy, shapely, ridge regression with leave-one-state-out validation) builds the county model, backtests and forecast; polls are scraped from Wikipedia's polling tables; FastAPI serves the data and the live Qloo scans; the front end is MapLibre GL (OpenFreeMap tiles) with a second synced map for the comparison sliders, D3 for the charts, and a scroll-driven story mode with cross-fading layers. The Qloo key stays on the server.
Challenges we ran into
- Our first idea failed. Qloo's Progressive/Conservative audiences did not predict how counties vote (r ≈ 0.1); they track population density. Partisan-leaning tastes did.
- Statewide signals. Qloo scores places relative to the area you query, so state-by-state maps can't compare states. We added a nationwide query to make states comparable, then found the statewide undertow didn't predict swing, and said so.
- Keeping the AI honest. An early AI summary of Qloo trend data described a "barometer" that was really Qloo rescaling whole categories. Every number the AI sees is now checked first.
Accomplishments that we're proud of
- An agent that turns cultural data into a concrete, checkable media plan in about a minute, without touching anyone's personal data.
- A forecast you can walk through, from the national map to a single block, live.
- Calls you can check on Nov. 3, with a public record of what worked and what didn't.
- Qloo catching the two swing states the polls missed in 2024.
What we learned
Culture maps politics remarkably well: what people love predicts where they live politically better than how many of them there are. It is better at "where" than "how much", and the honest answer is to show both.
What's next
Score every call, cultural read and strategist plan against the Nov. 3 results; re-fit the taste model on 2026; add House districts and state legislatures (where campaigns have the least data and the most need); export straight to ad platforms; and the same engine for brands: "where should my next store, sponsorship or campaign go, and what do people there love?"
Built With
- cloudflare-tunnel
- d3.js
- fastapi
- javascript
- llm
- maplibre-gl
- numpy
- openfreemap
- pandas
- python
- qloo
- qloo-insights-api
- shapely

Log in or sign up for Devpost to join the conversation.