-
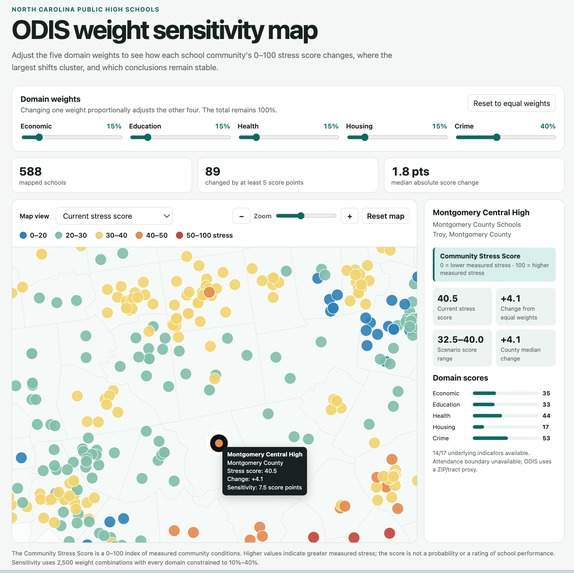
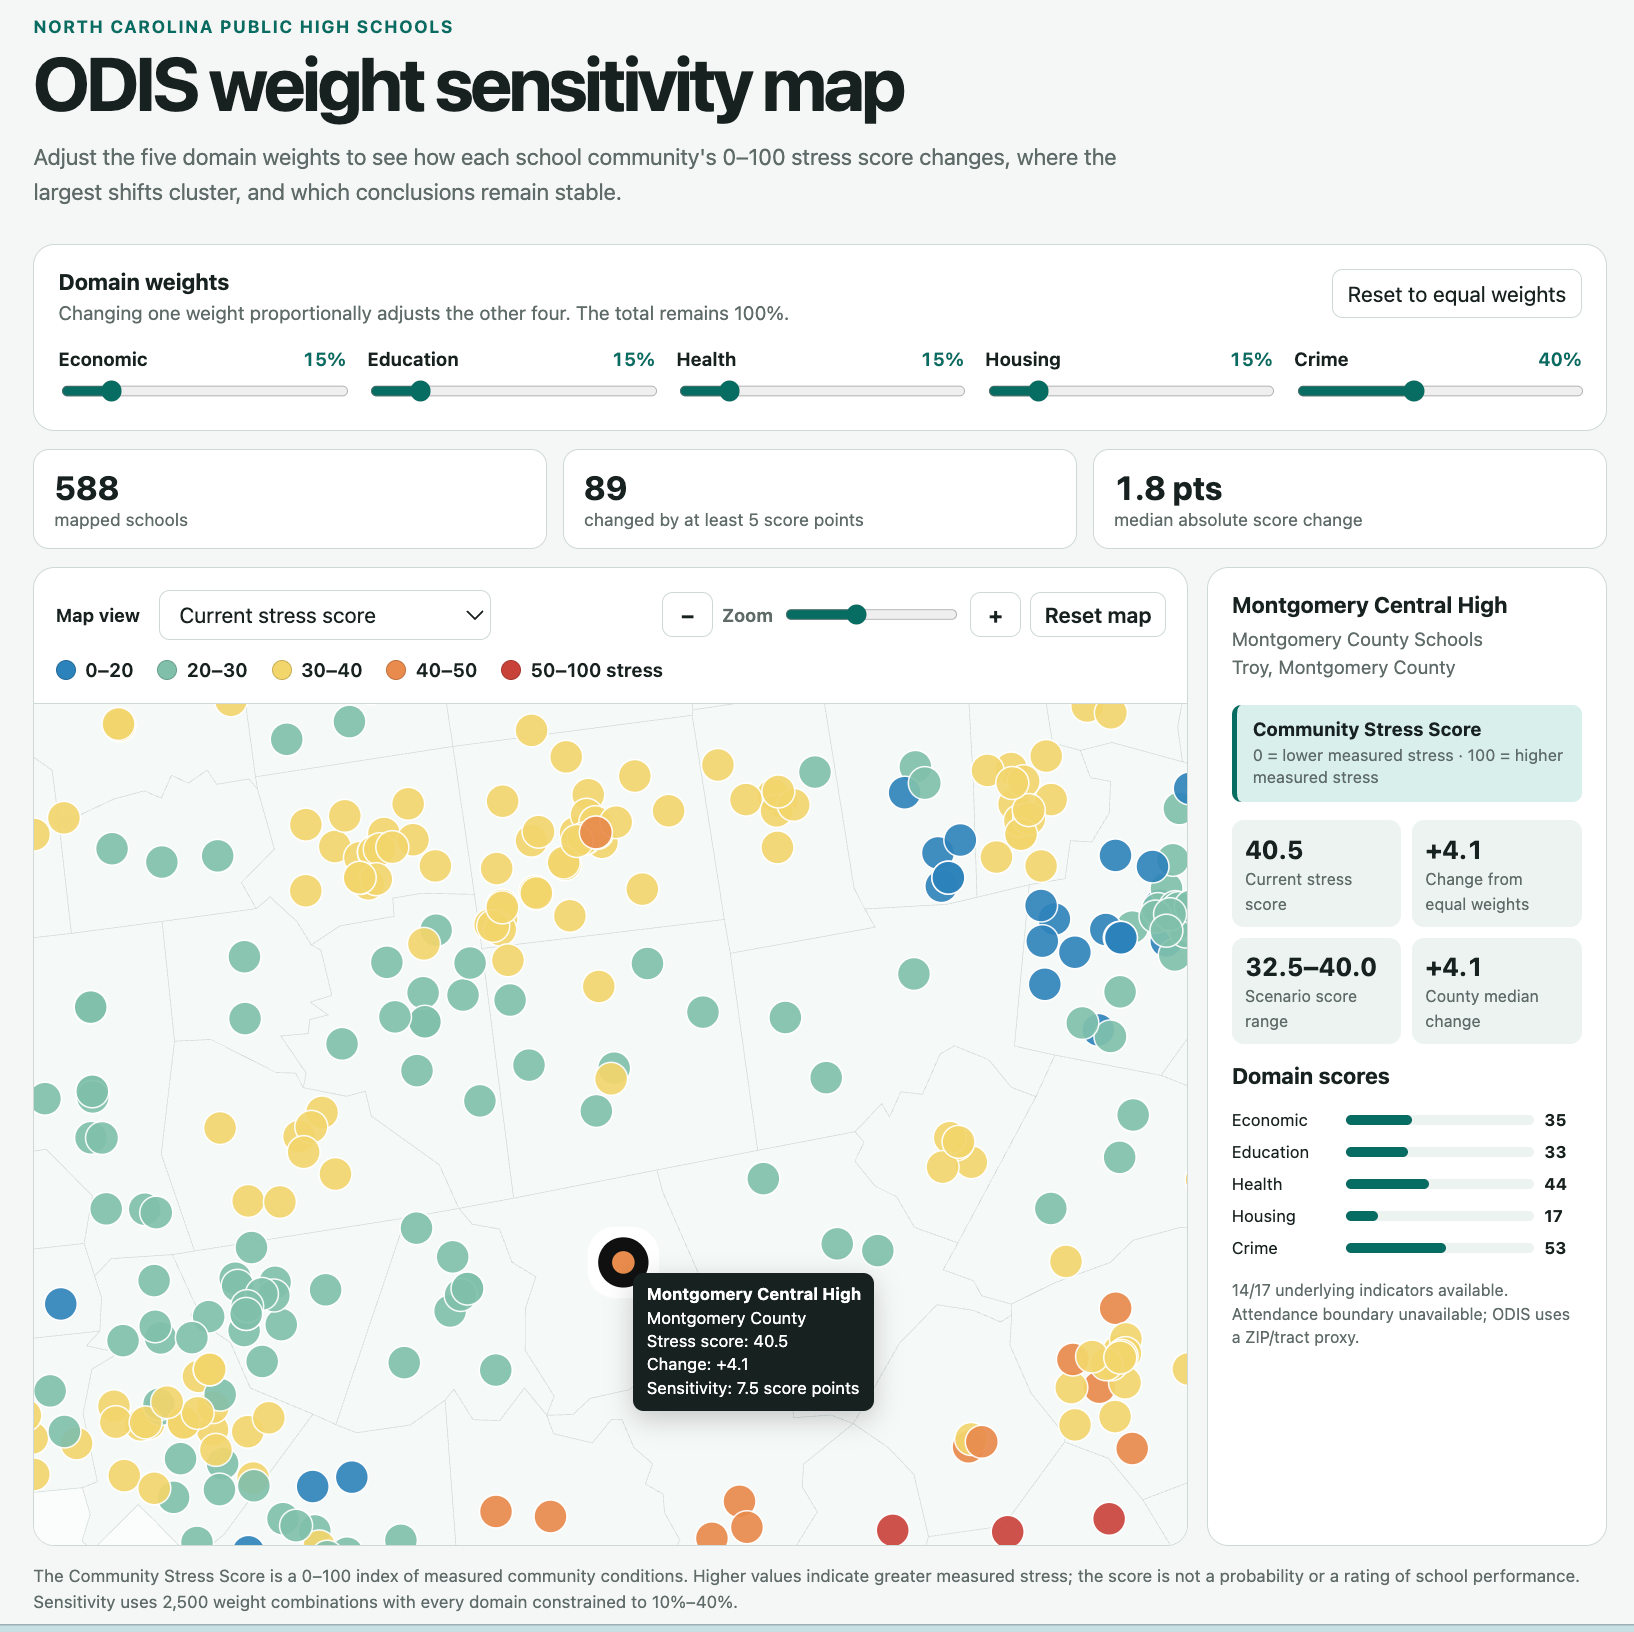
Interactive map showing how school-community stress changes as domain priorities change.
-
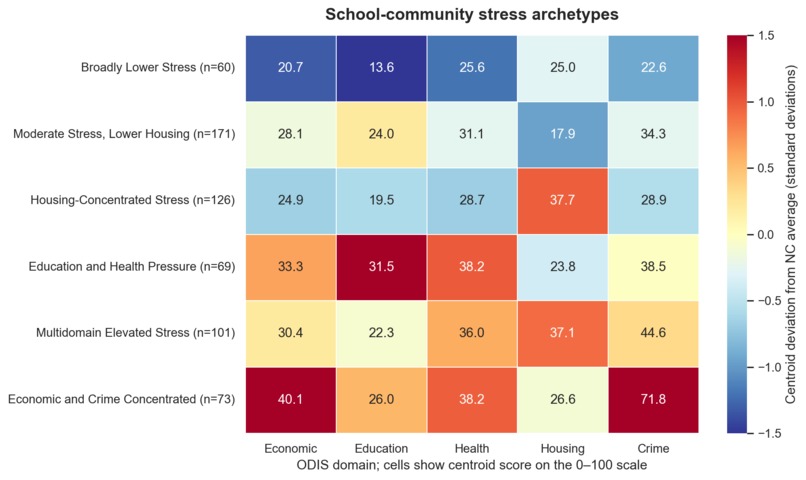
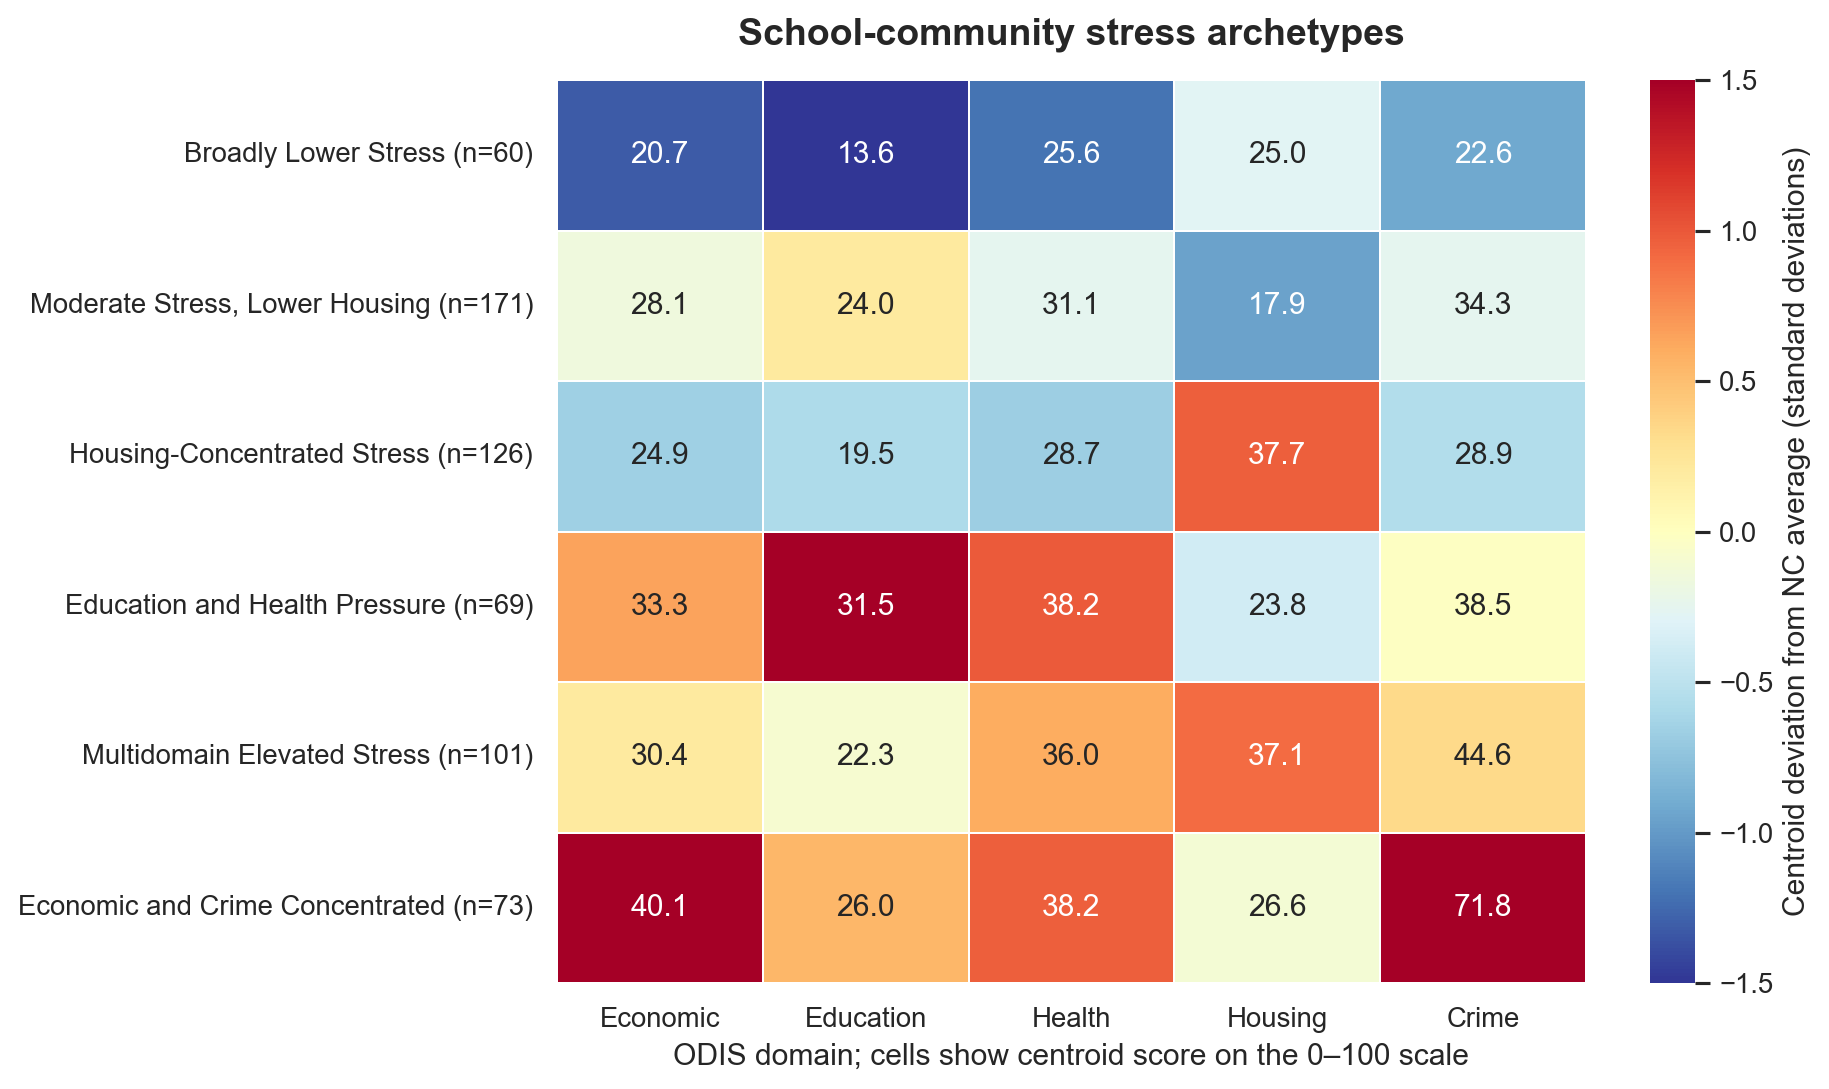
Six school-community stress archetypes identified from the five ODIS domains.
-
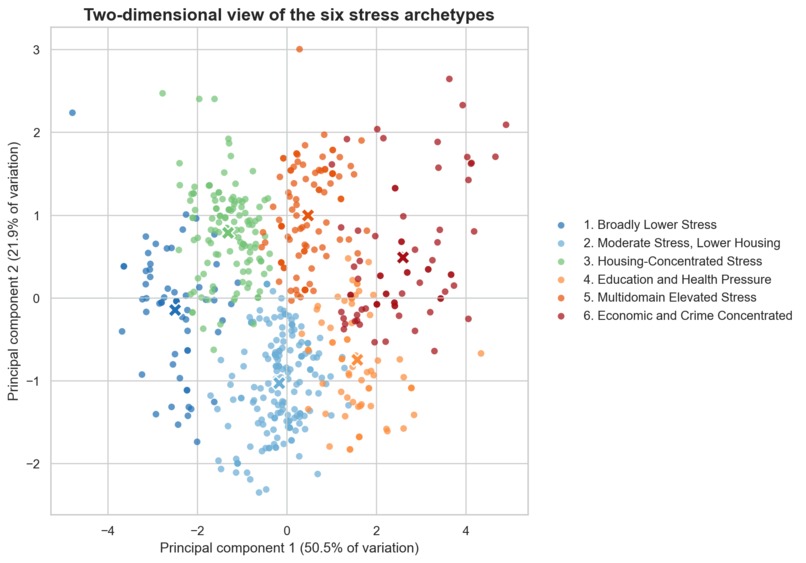
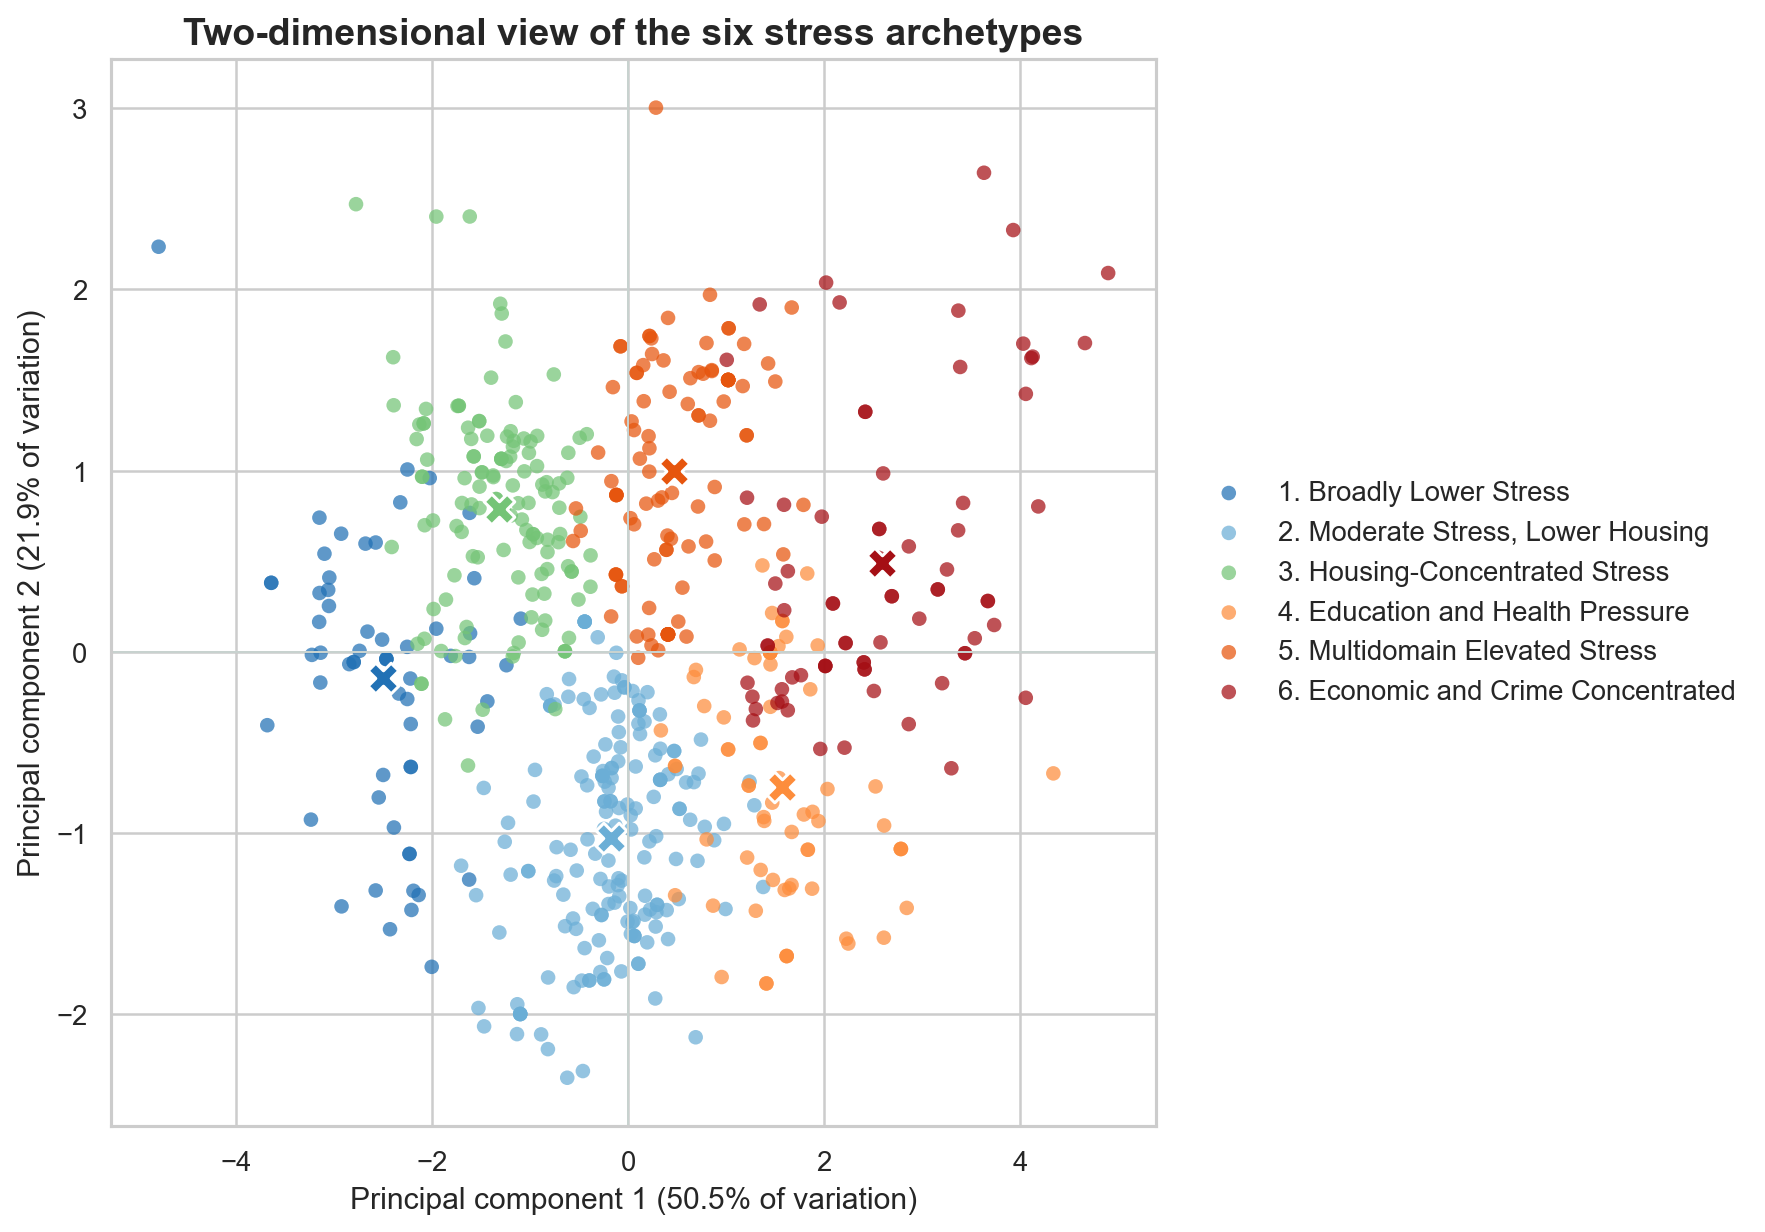
PCA visualization of the six K-means clusters. PCA supports visualization but was not used to fit the model.
-
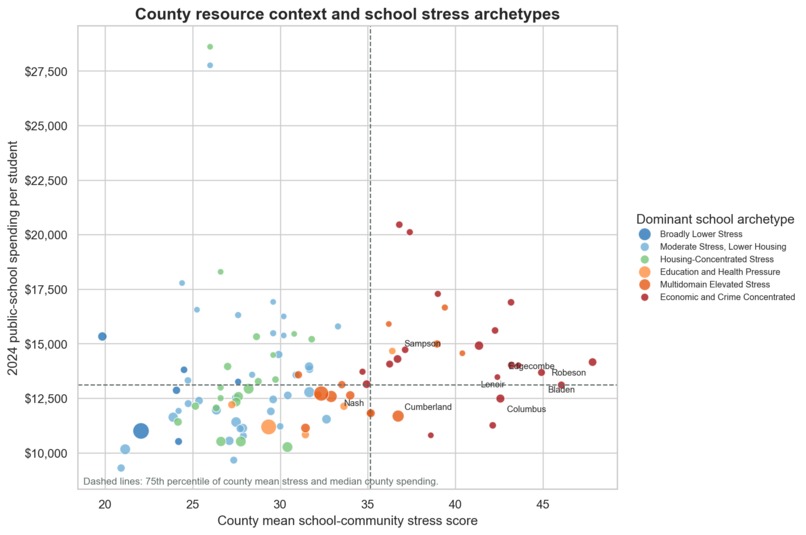
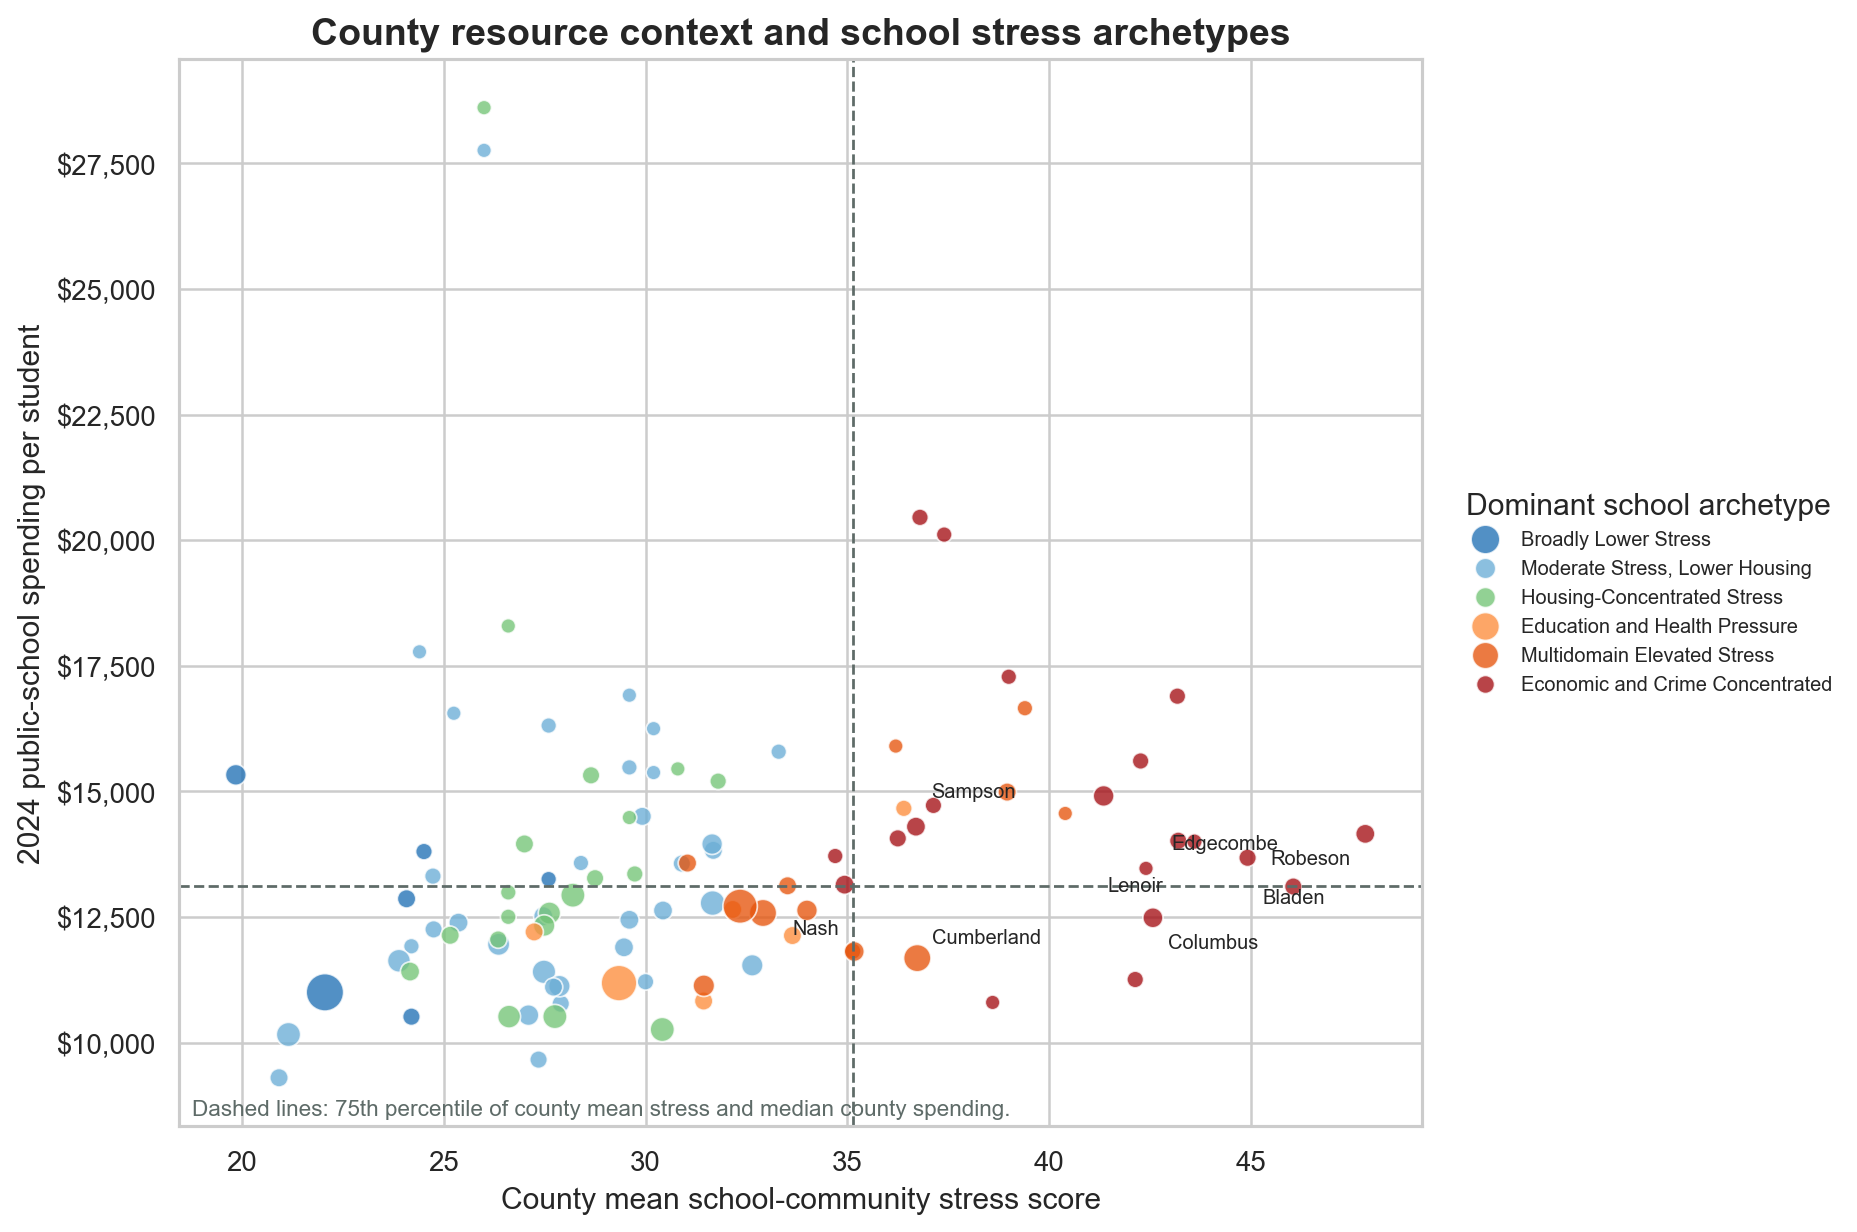
County-level LiNC context used to identify resource-alignment questions without making causal claims.
-
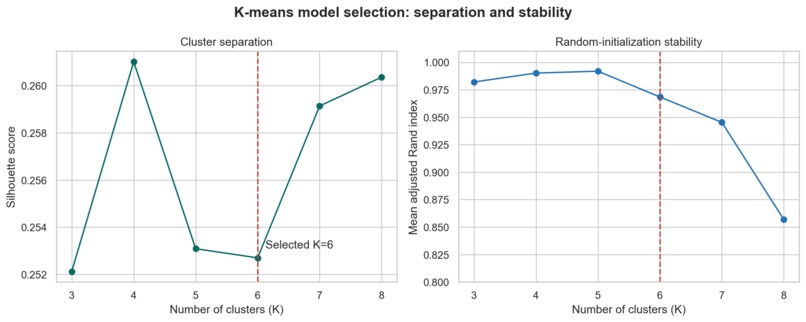
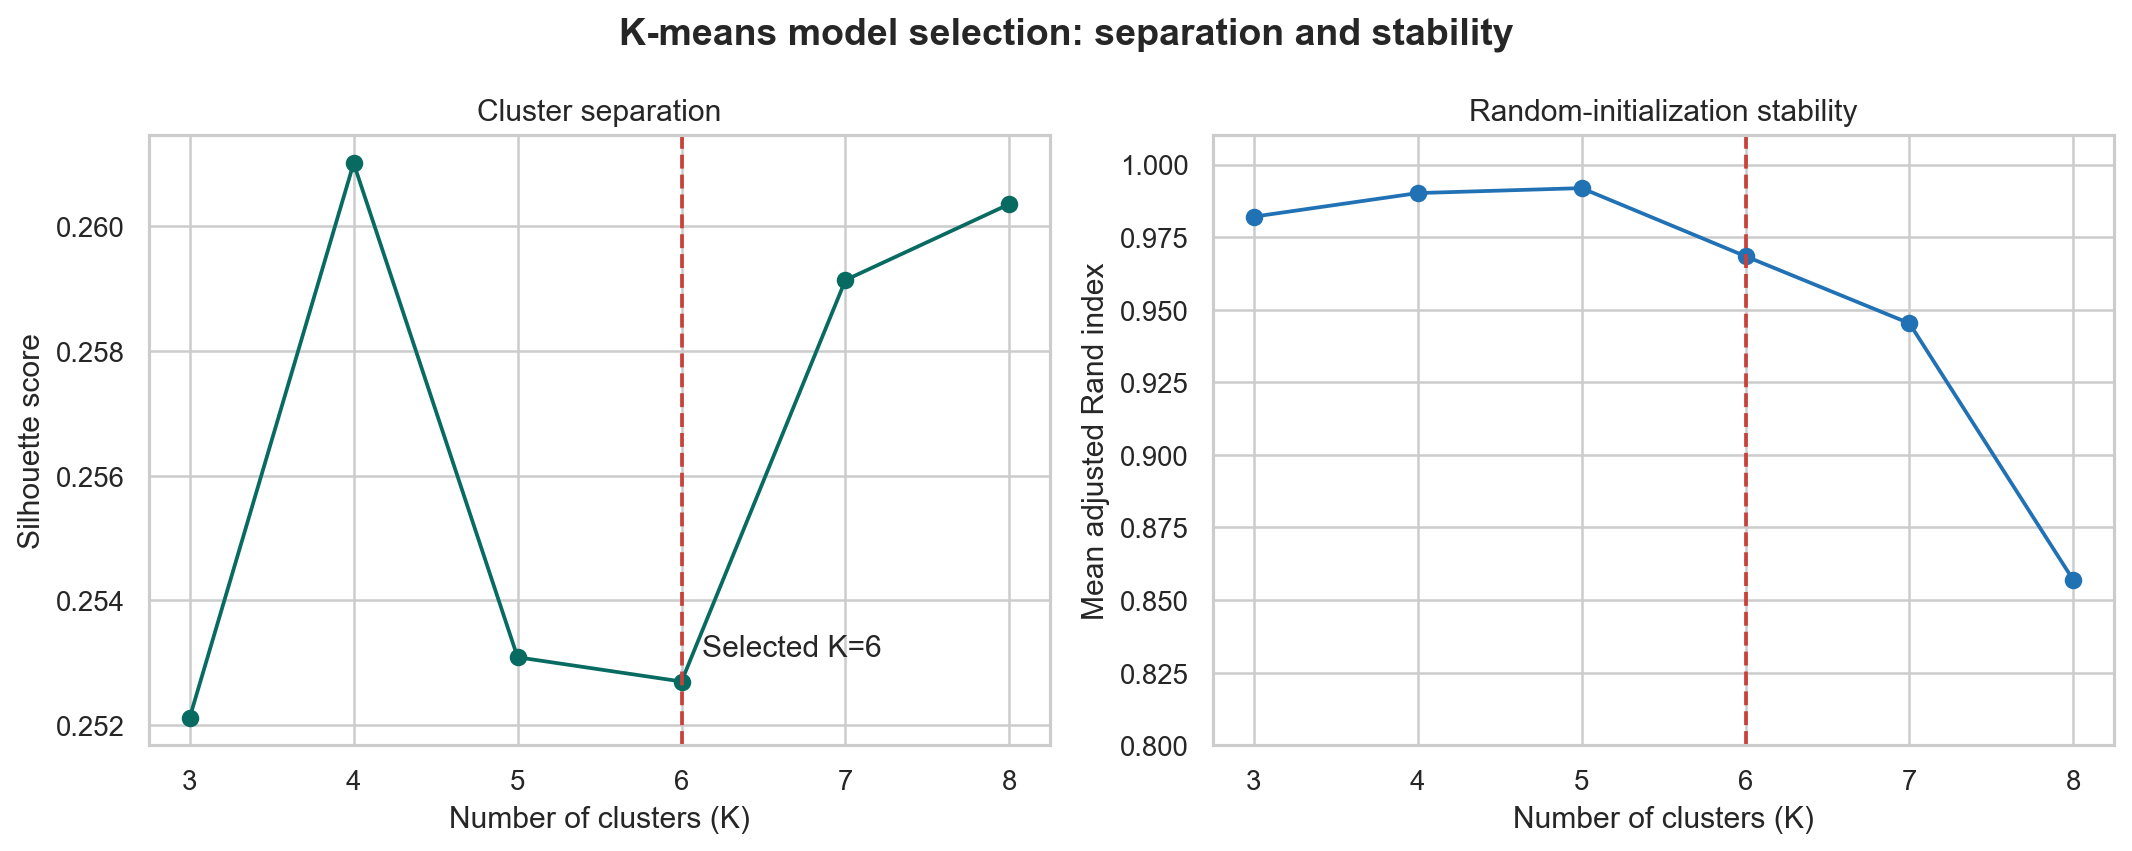
Model diagnostics used to compare candidate values of K from 3 through 8.
Inspiration
ODIS provides detailed indicators of economic, education, health, housing, and crime conditions for school communities. But having all of these indicators does not necessarily make it easy to use them for decision-making. When comparing hundreds of schools, users still have to determine which communities face similar combinations of challenges, whether a school’s overall stress level is robust to different scoring priorities, and how those patterns relate to the resources available around them. Our project turns these individual indicators into a more structured way to compare communities. We test how sensitive stress scores are to different weighting choices, identify recurring patterns of community stress across schools, find communities facing similar combinations of challenges, and connect those patterns with county-level resource data. The goal is not to replace the original indicators or create another ranking. It is to help educators, community organizations, and policymakers move from “What are this school’s indicators?” to “What type of challenges does this community face, which communities face similar challenges, and what resources surround them?”
What it does
Beyond the Score has two connected parts. First, the interactive map lets a user change the weights assigned to the five ODIS domains. The map immediately recalculates each North Carolina school's Community Stress Score, while a sensitivity layer shows which schools remain stable and which move substantially under reasonable alternative priorities. We sampled 2,500 weight combinations, constraining every domain to 10%–40%, rather than treating one weighting scheme as unquestionable. Second, our machine-learning pipeline uses K-means clustering on the five standardized ODIS domain scores. It does not use the existing composite score as an input. The model groups 600 North Carolina schools into six interpretable community-stress archetypes, such as broadly lower stress, housing-concentrated stress, education-and-health pressure, multidomain elevated stress, and economic-and-crime-concentrated stress. This reframes the question from “Which school ranks worse?” to “What pattern of challenges surrounds this school?” We then join two NC OSBM LiNC datasets after clustering: county education resources and county employment/income conditions. These data provide context for comparing archetypes and identifying counties that may deserve closer human review.
How we built it
We cleaned the ODIS records in Python and matched North Carolina schools to 2024–25 NCES EDGE public-school geocodes. The current map includes 588 successfully matched schools; 12 unmatched records are retained for manual review rather than silently discarded For the map, we used HTML, CSS, JavaScript, D3.js, and TopoJSON. Users can adjust five weights that always sum to 100%, zoom and pan, switch between stress and sensitivity views, and inspect school-level tooltips. For the machine-learning analysis, we standardized the five domain scores and evaluated K from 3 through 8 using silhouette score, inertia, Calinski–Harabasz score, Davies–Bouldin score, minimum cluster size, and stability across 20 random initializations. Although K=4 had the highest silhouette score (0.2610), we selected K=6 because it preserved useful, interpretable distinctions while retaining a minimum cluster size of 60 and strong random-initialization stability (mean adjusted Rand index = 0.9684). The selected model's silhouette score was 0.2527. PCA was used only for visualization; the clustering used all five standardized domains. We used two supplemental LiNC sources:
- Education (2024): spending per student, instructional personnel per 1,000 students, attendance, funding shares, and high-school dropout rate.
- Employment and Income: 2024 unemployment, 2024 HUD median family income, and 2023 poverty rate. LiNC variables were joined only after clustering, so the archetypes describe ODIS stress patterns rather than available resources. A transparent review rule flags counties in the top quartile of mean school-community stress and below the North Carolina county median for spending per student or instructional personnel. The 13 flagged counties are conversation starters, not automated funding recommendations.
Challenges
The modeling challenge was that no single K is objectively “correct.” We balanced quantitative validation, cluster stability, minimum group size, and whether the groups told meaningfully different social stories. Seven schools also had at least one missing domain, so we median-imputed values only for fitting and disclosed every affected record in the output.
Accomplishments we are proud of
Built a working interactive map with adjustable weights, zooming, tooltips, and clear stress/sensitivity legends. Mapped 588 North Carolina schools and retained an auditable list of 12 unmatched records. Clustered all 600 North Carolina ODIS schools into six stable and interpretable archetypes. Evaluated multiple K values and random initializations instead of presenting one unexplained model. Integrated two LiNC subject areas covering all 100 North Carolina counties. Produced school archetypes, nearest archetype peers, county context, model diagnostics, and reproducible visual outputs.
What we learned
Technically, we learned how to combine geospatial matching, scenario simulation, unsupervised learning, cluster validation, PCA visualization, and data from different geographic levels. Most importantly, we learned that social-good analytics should support human judgment, not replace it.
What's next
Our next step is to integrate the machine-learning results into the interactive website. Users would be able to explore the six school-community stress archetypes, compare their underlying economic, education, health, housing, and crime profiles, and find schools with similar patterns of community need. We would also add LiNC county-level education and employment context while clearly distinguishing county conditions from school-specific resources.


Log in or sign up for Devpost to join the conversation.