Inspiration
Air quality models trained on standard regional monitoring networks often assume relatively uniform urban or rural emission patterns. However, coastal port environments are uniquely dynamic, shaped by heavy maritime traffic, industrial activity, and complex land-sea breeze circulations.
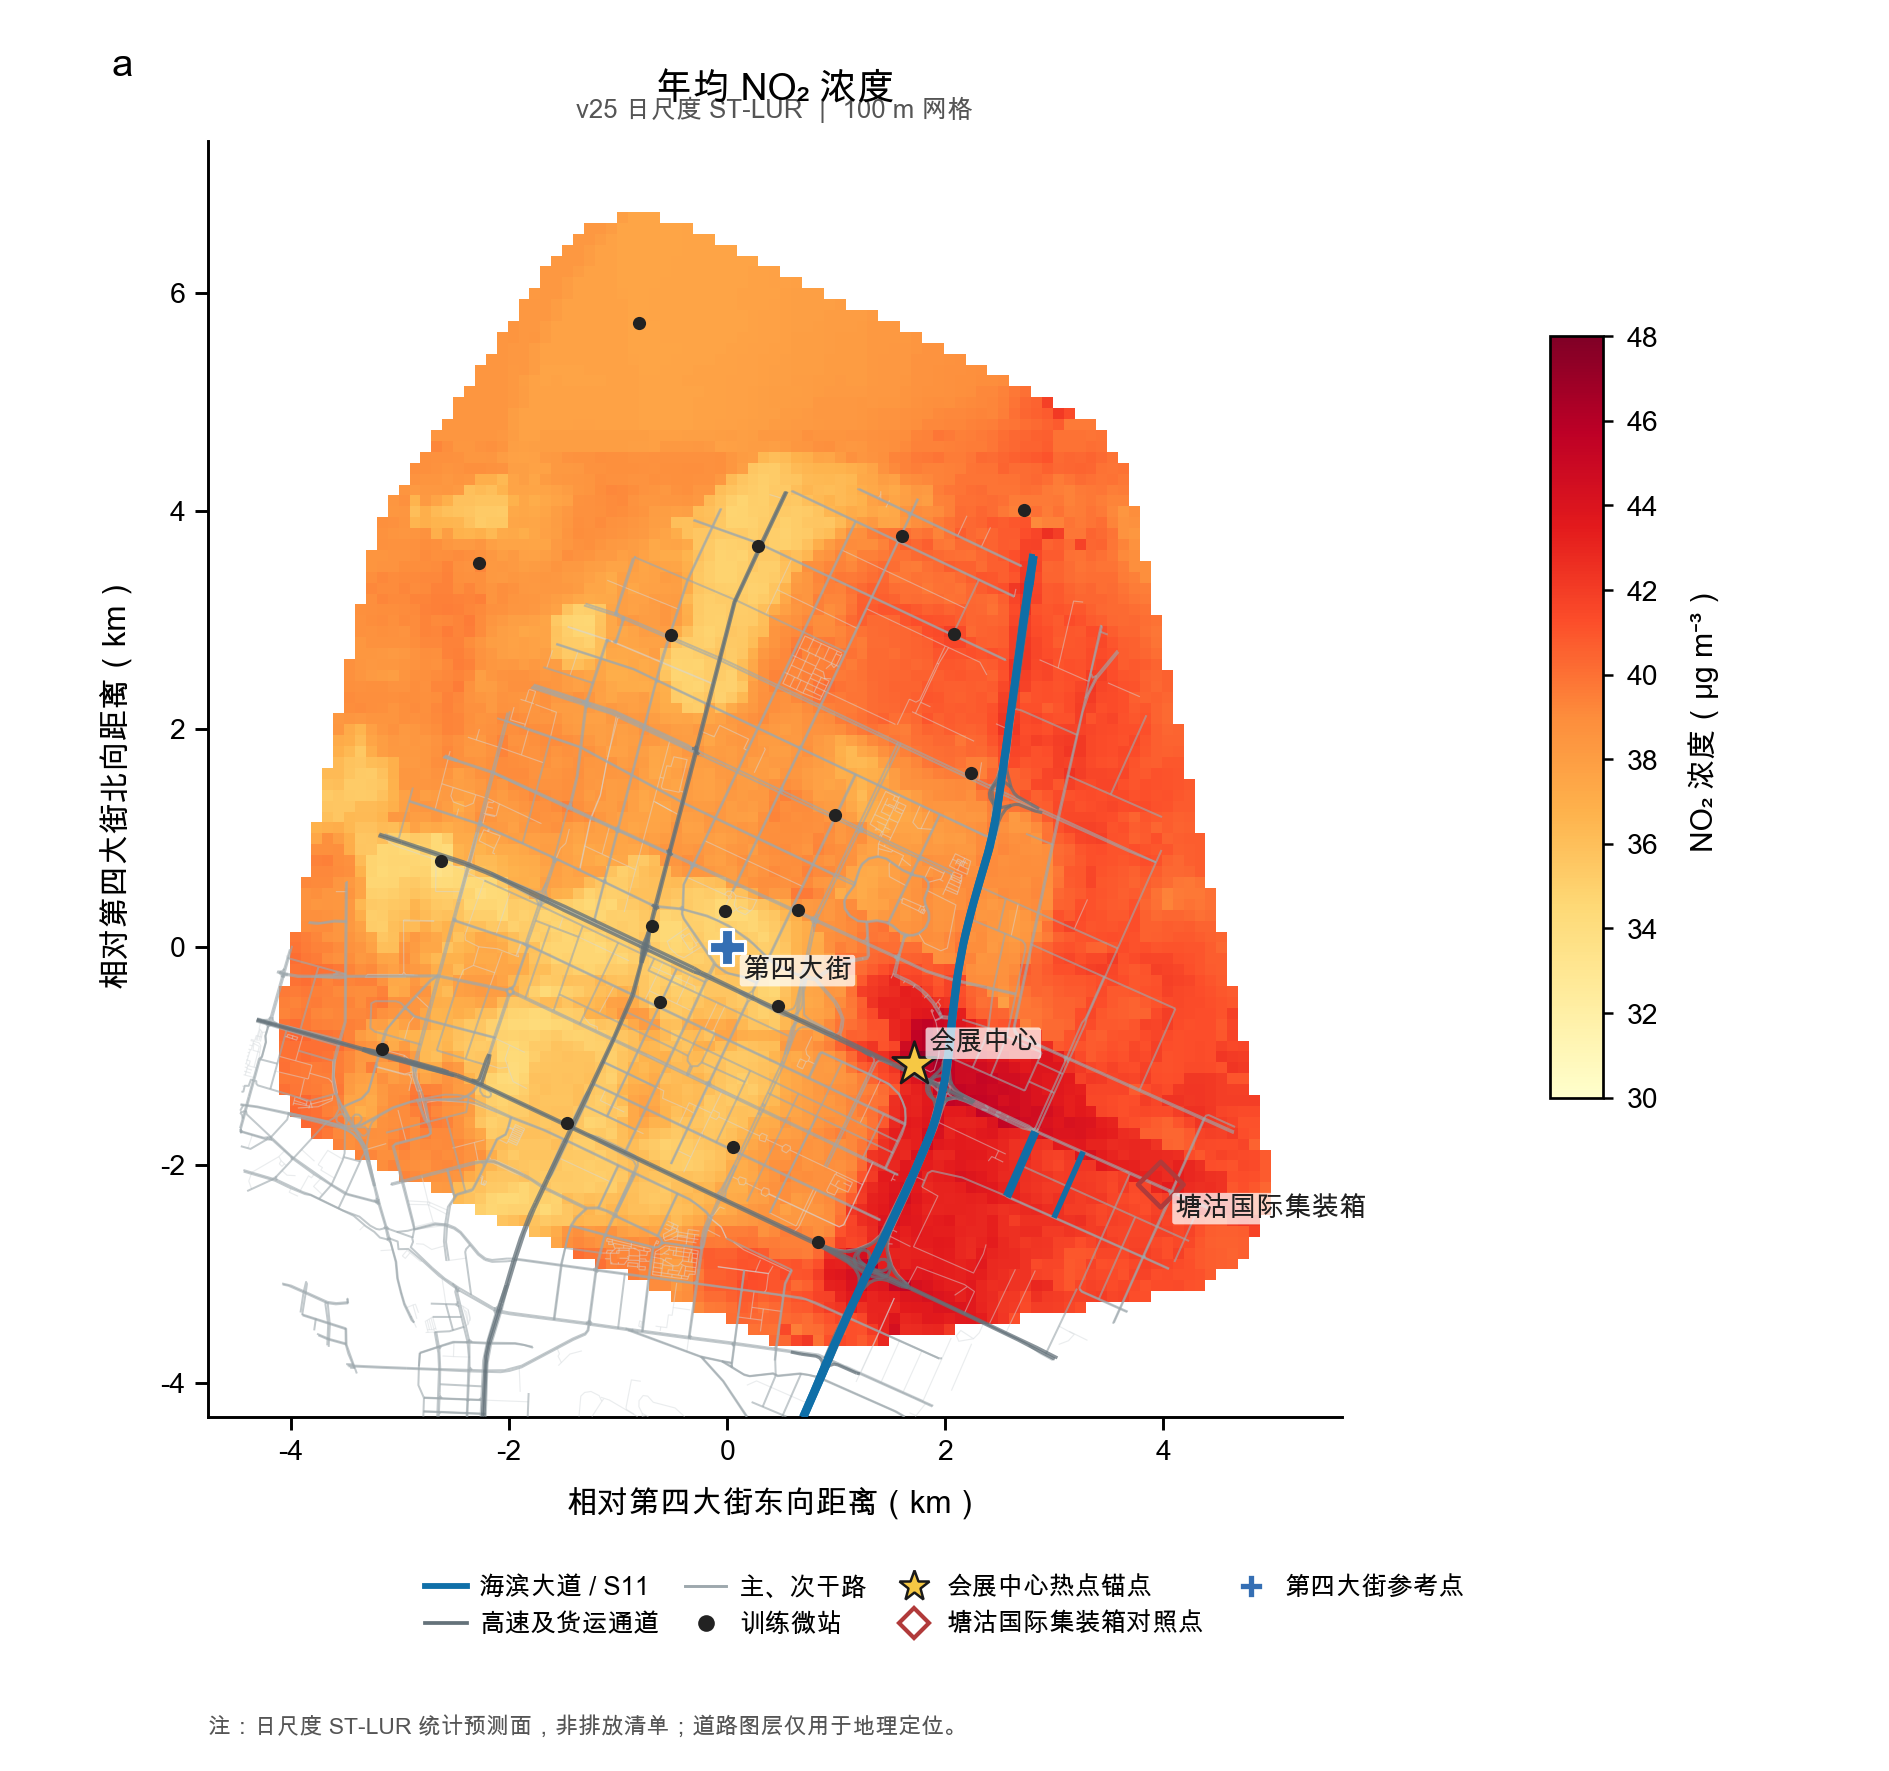
We noticed that during the summer, network-trained models consistently underestimated localized nitrogen dioxide ($\text{NO}2$) spikes at our coastal port site. Specifically, the observed concentrations significantly exceeded model predictions ($y{\text{obs}} \gg \hat{y}_{\text{pred}}$), revealing a systematic blind spot in broad-scale models. This discrepancy inspired us to investigate why regional networks miss these localized surges and to uncover the true physical and chemical drivers behind this summertime $\text{NO}_2$ excess.
What it does
This project benchmarks high-resolution observational data from a coastal port monitoring site against predictions generated by standard network-trained models. By isolating and analyzing the summertime prediction residuals:
$$\Delta \text{NO}2 = [\text{NO}_2]{\text{obs}} - [\text{NO}2]{\text{pred}}$$
our framework pinpoints when and why severe underestimations ($\Delta \text{NO}_2 > 0$) occur, linking them directly to localized meteorological regimes, shallow marine boundary layer dynamics, and port-specific emission patterns.
How we built it
- Data Integration & Preprocessing: We combined high-frequency ground-based $\text{NO}_2$ measurements at the coastal port with regional network observations, meteorological variables (wind speed $u$, wind direction $\theta$, temperature $T$, and solar radiation $I$), and
[optional: ship traffic AIS data / satellite tropospheric columns]. - Model Benchmarking: We evaluated
[e.g., Random Forest / XGBoost / Neural Network]models trained across the broader regional monitoring network to establish a baseline and quantify the summertime Normalized Mean Bias ($\text{NMB}$): $$\text{NMB} = \frac{\sum_{i=1}^{N} (\hat{y}i - y_i)}{\sum{i=1}^{N} y_i} \times 100\%$$ - Residual & Regime Analysis: Using
[e.g., SHAP feature attribution / meteorological regime clustering], we decomposed the summertime residuals ($\Delta \text{NO}_2$) to isolate the exact environmental conditions and photochemistry ($\text{NO}_x$–$\text{O}_3$ titration) driving the uncaptured excess.
Challenges we ran into
- Spatial & Temporal Mismatch: Aligning localized, high-resolution port observations with coarser regional network datasets required careful outlier filtering and temporal synchronization.
- Untangling Meteorology from Emissions: Coastal zones experience abrupt shifts in wind vectors and planetary boundary layer height ($H_{\text{PBL}}$). Separating the physical trapping of pollutants under shallow marine layers from actual spikes in shipping emissions was a major analytical hurdle.
- Out-of-Distribution Generalization: Because coastal ports represent micro-environments that are underrepresented in standard monitoring networks, models trained on regional distributions struggled to extrapolate to extreme coastal regimes without overfitting.
What we learned
- Regional Averages Hide Local Risks: A model achieving a high overall coefficient of determination ($R^2$) across a regional network can still exhibit severe negative bias ($\text{NMB} \ll 0$) in complex micro-environments, potentially leading to underestimated health risks for coastal communities.
- Domain Physics is Crucial in Environmental ML: Purely data-driven models trained on inland or standard urban stations miss critical coastal physics—such as sea-breeze recirculation and marine boundary layer suppression—highlighting the necessity of embedding domain-specific physical features into air quality modeling.
Built With
- air-quality
- atmospheric-science
- environmental-data
- geopandas
- jupyter-notebook
- lightgbm
- machine-learning
- matplotlib
- netcdf
- numpy
- pandas
- plotly
- python
- scikit-learn
- scipy
- seaborn
- shap
- statistical-modeling
- time-series-analysis
- xarray
- xgboost
