Inspiration
I spent the first day researching and came upon multiple environmental issues such as Sewage spills in English rivers, UK bottom trawling, wasted wind generation, wildfire detection through NASA FIRMS — each one was either UK-only or already being done better by someone else. Then I found UNEP's methane response data and the numbers genuinely concerned me.
UNEP (the UN Environment Programme) runs a system called MARS. Satellites spot big methane leaks anywhere on the planet, and MARS emails the government and the company so they can go fix it. The detection part works fine.
Then I looked at the response rate. In 2024 MARS sent about 1,200 notifications and got 15 replies back. Programme-wide, over 900 sources (roughly 88%) have never been answered by anyone.
So the problem isn't satellites. It's paperwork. Only 24 countries have even nominated someone to receive these alerts, and where they have, the response rate is about three times higher. Everyone can see the leaks. Nobody replies.
Methane's also the fastest lever we have on warming. The IPCC puts about 0.5°C of the ~1.07°C we've already seen down to methane, and unlike CO2 it clears out of the atmosphere in roughly a decade. UNEP reckons a 45% cut this decade would avoid about 260,000 premature deaths a year and nearly 0.3°C of warming by 2045. And methane is just natural gas, so a leak is a company letting a product it could sell float away.
What it does
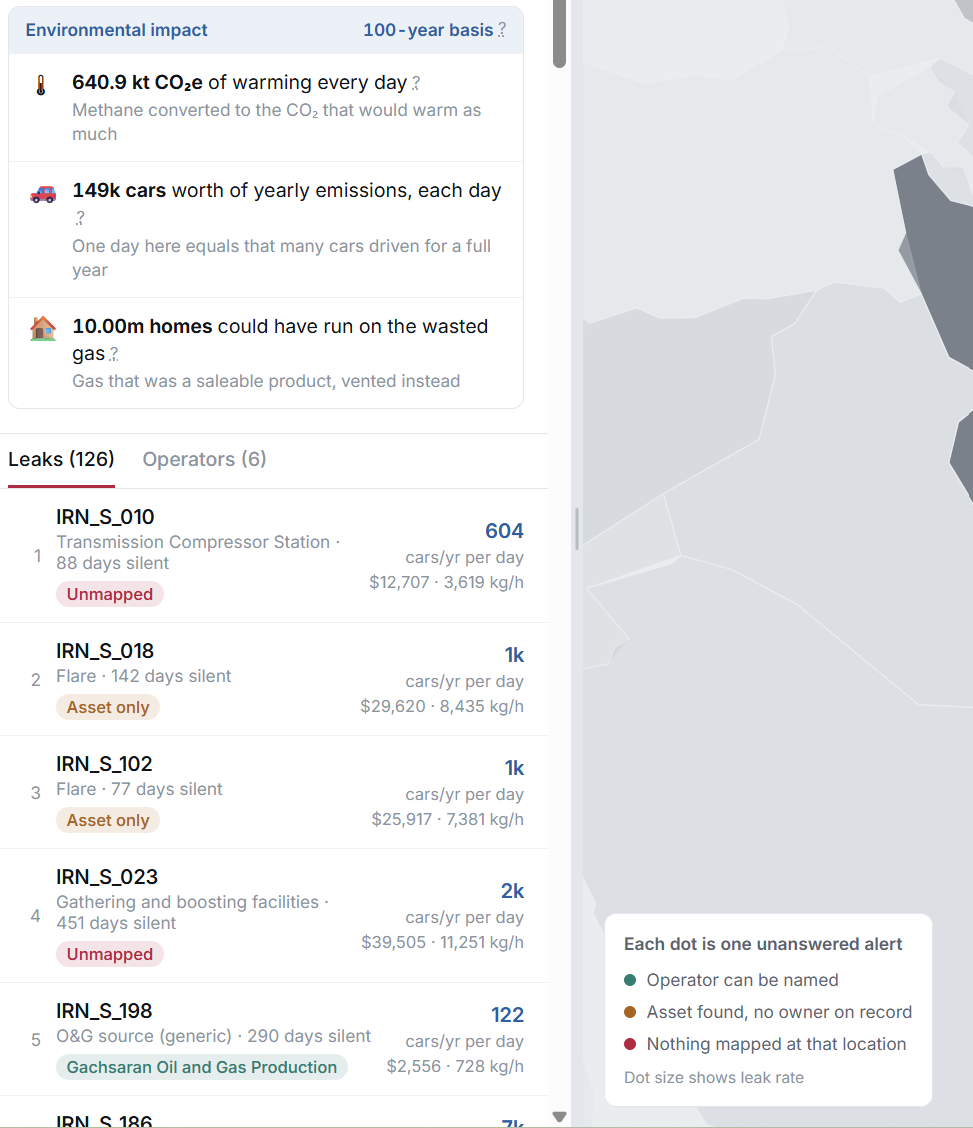
Unanswered pulls the leaks nobody replied to out of UNEP's data and tries to work out who's likely responsible.
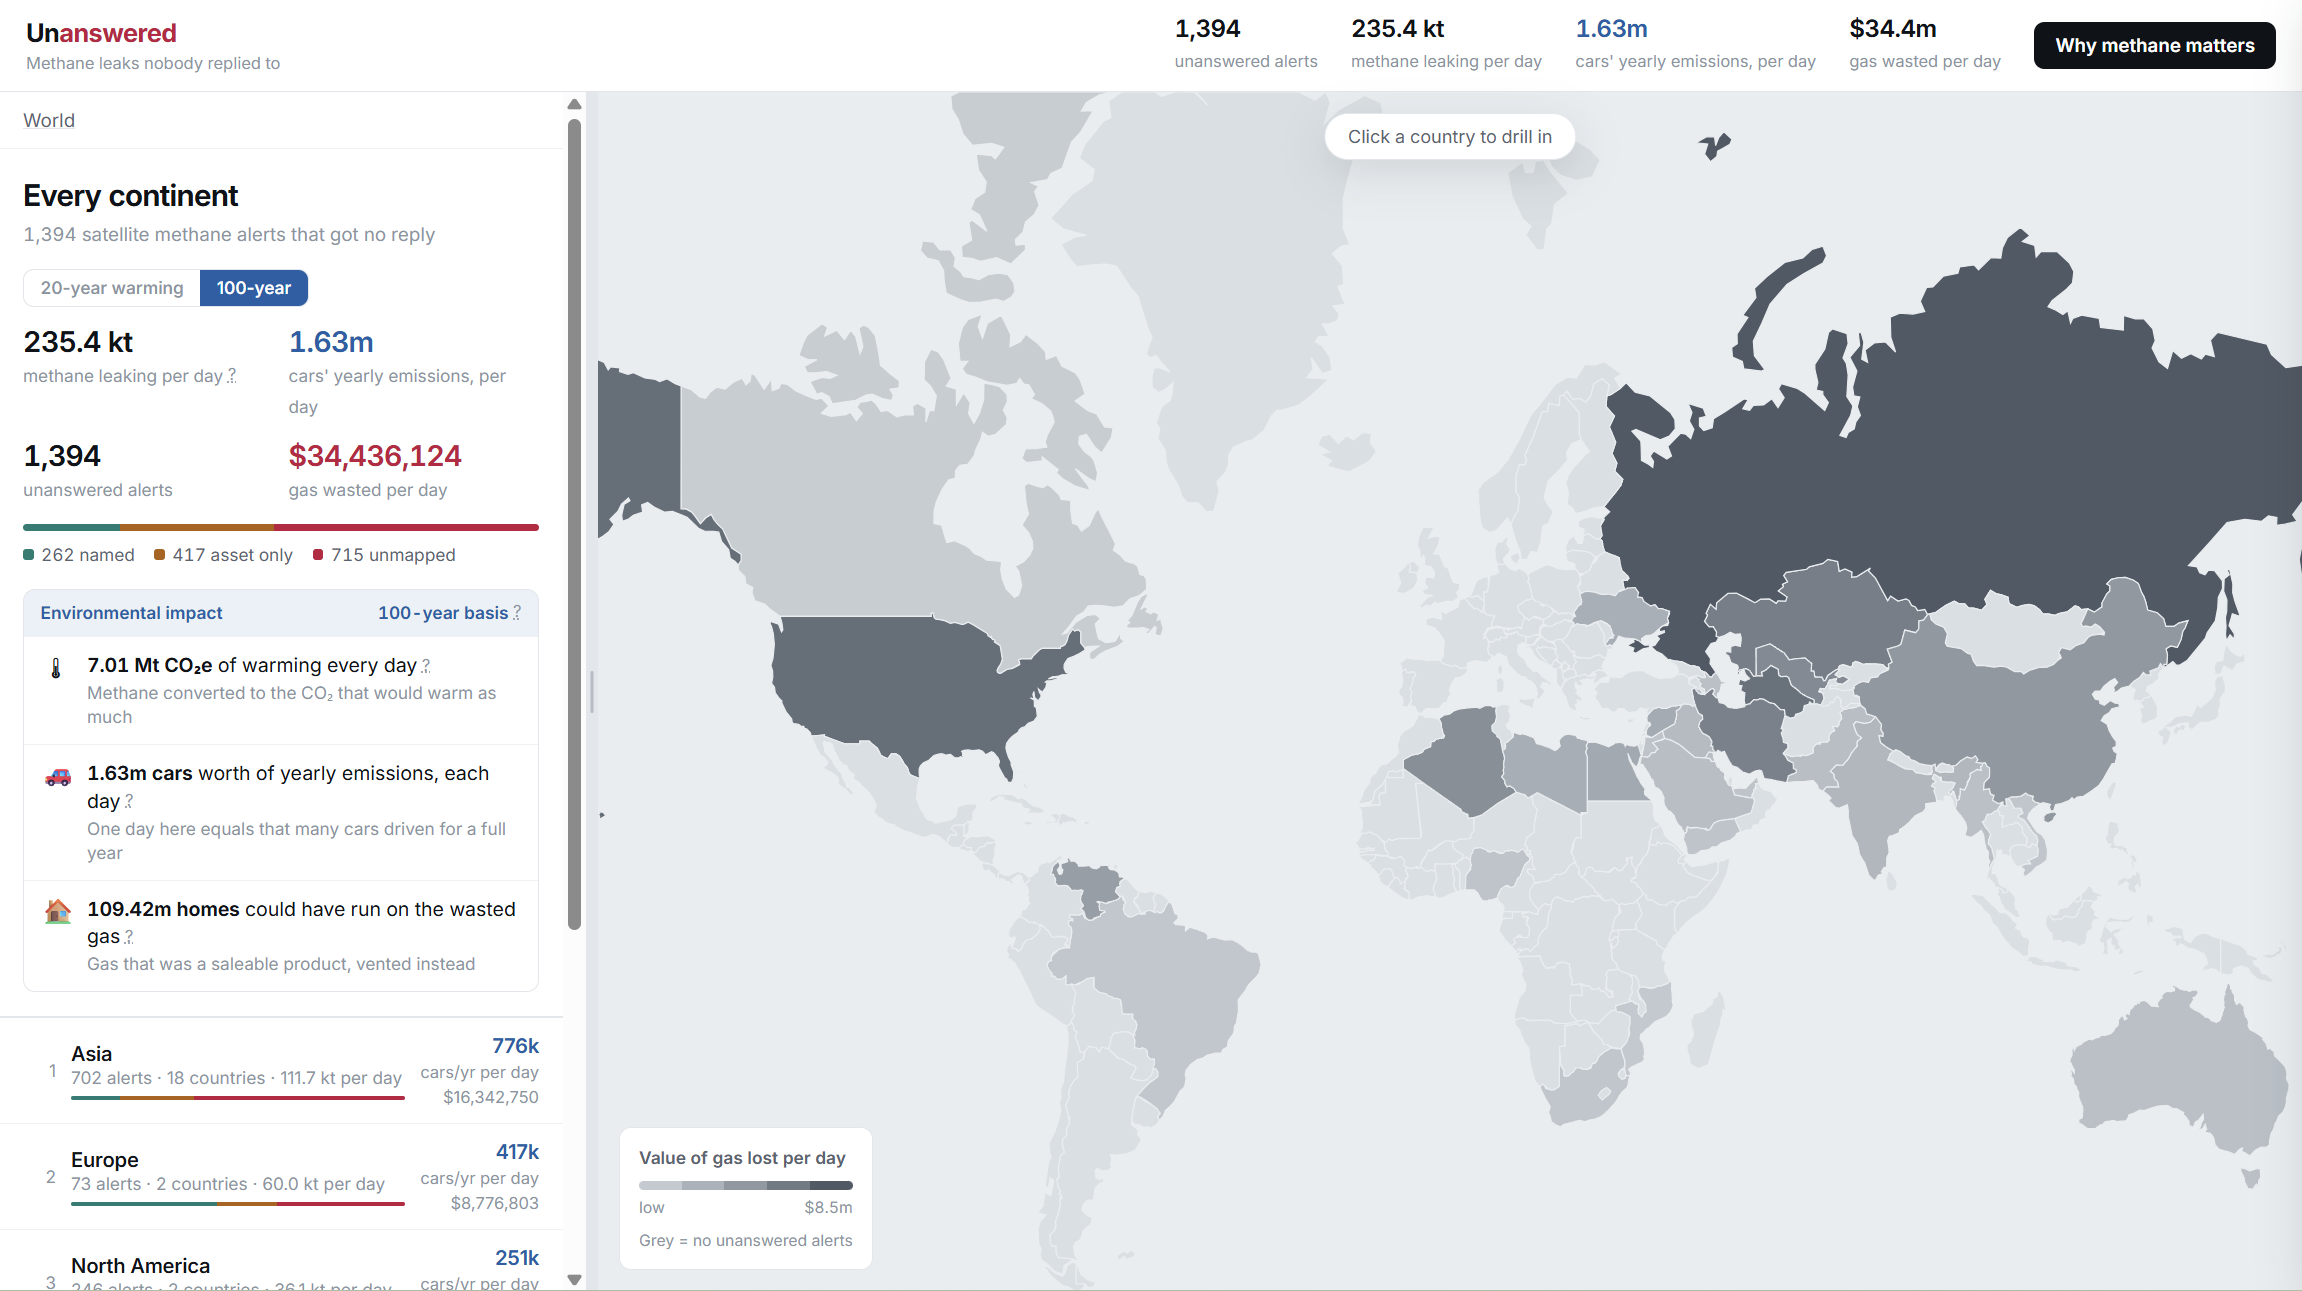
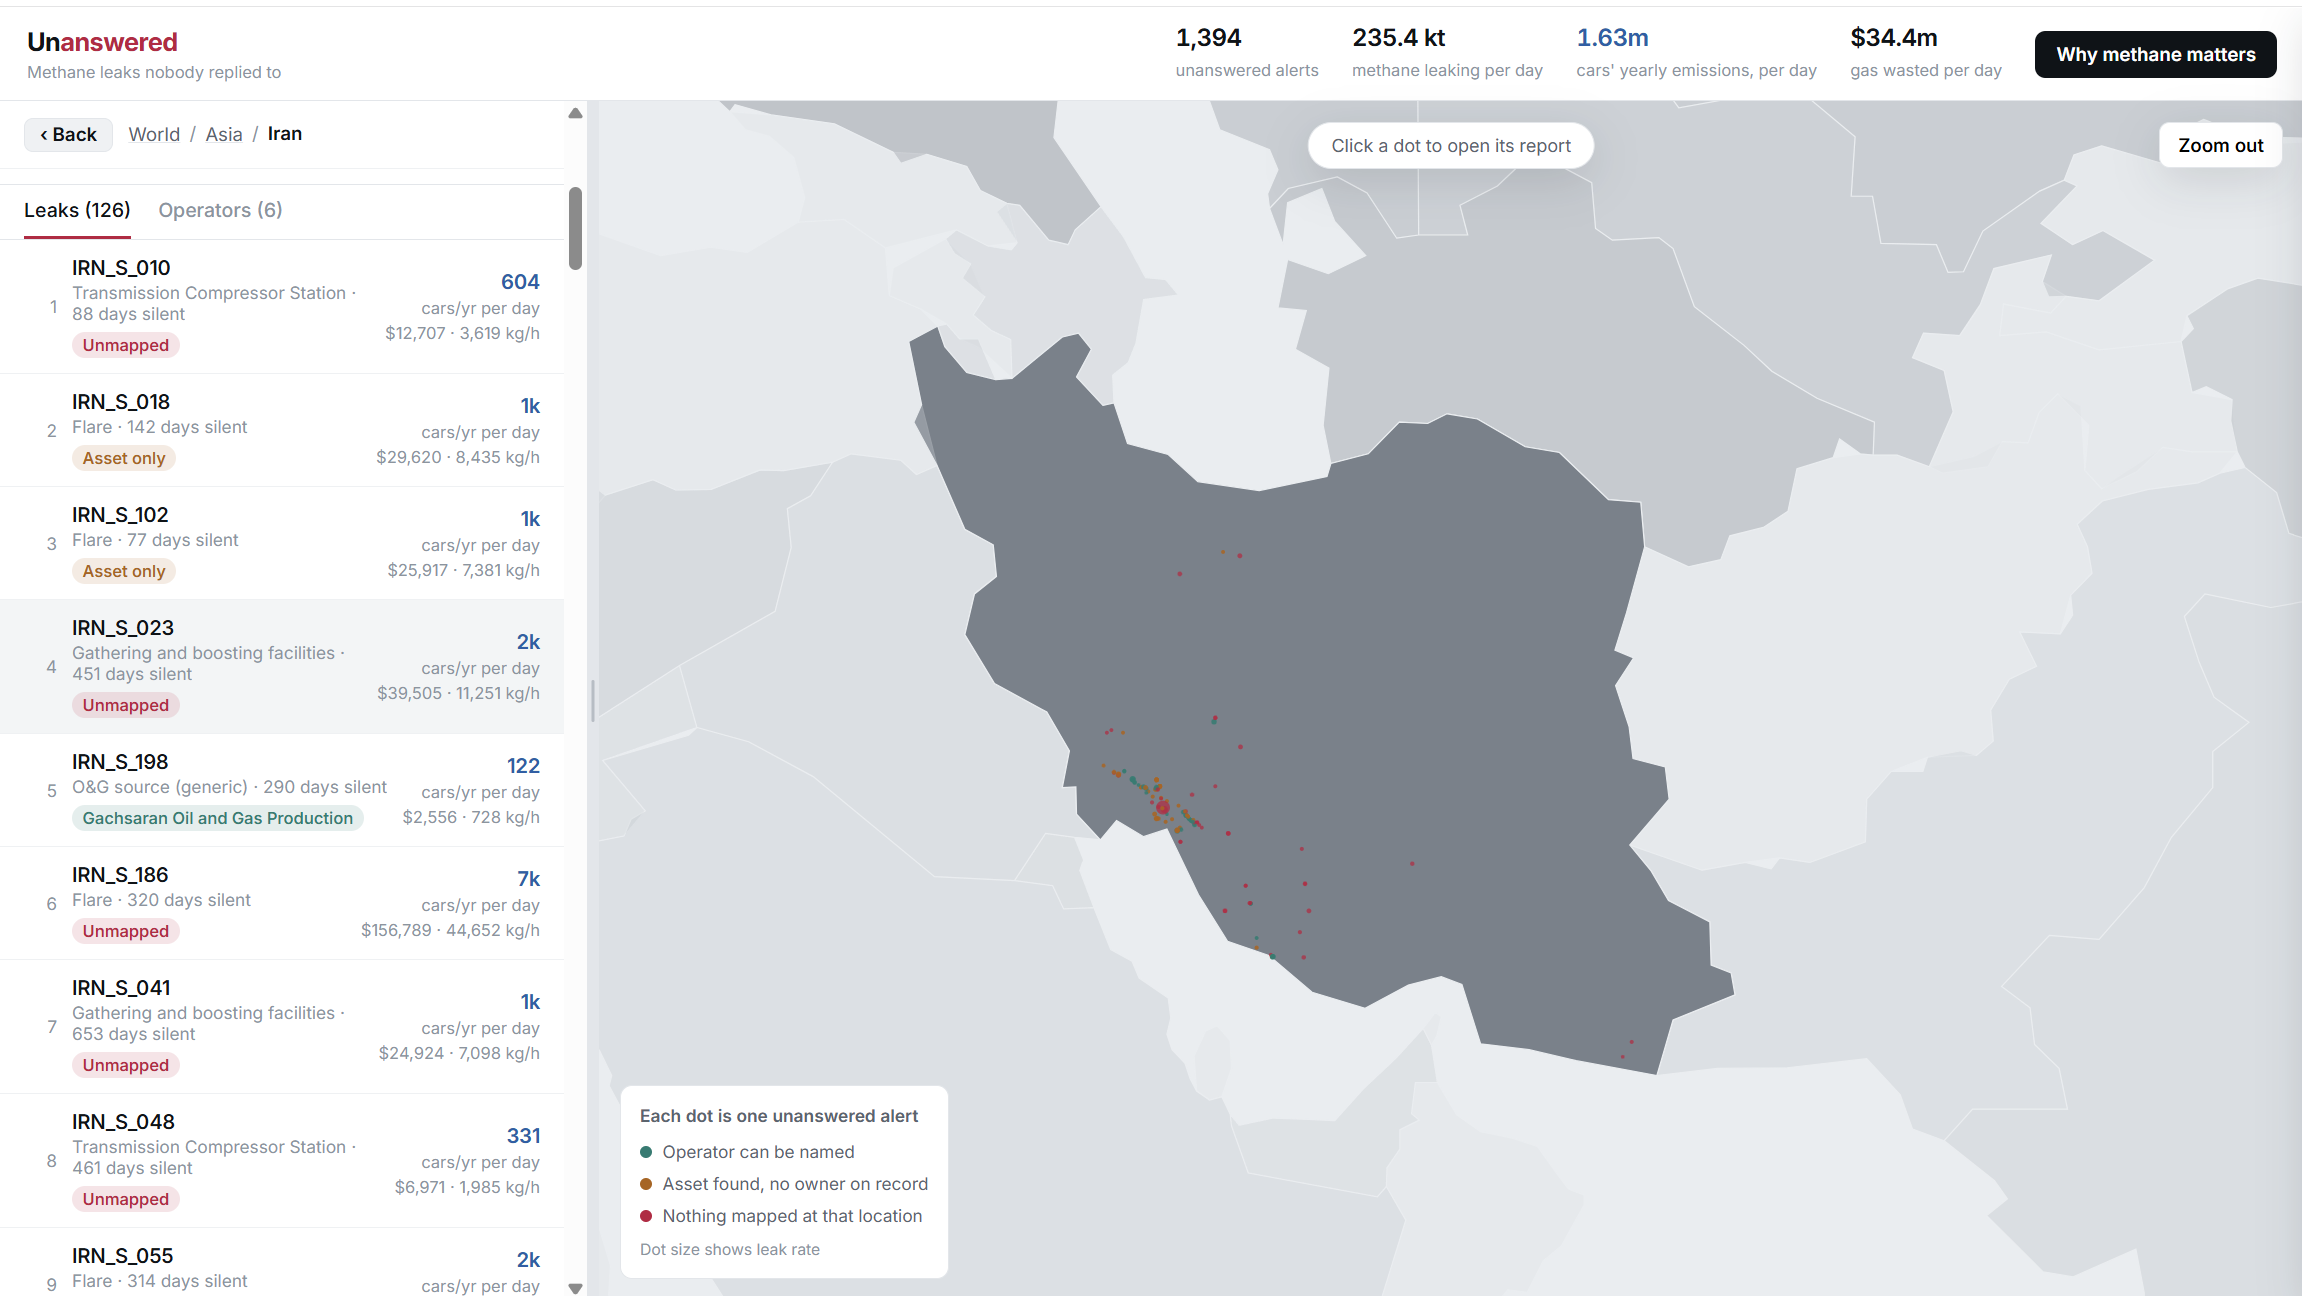
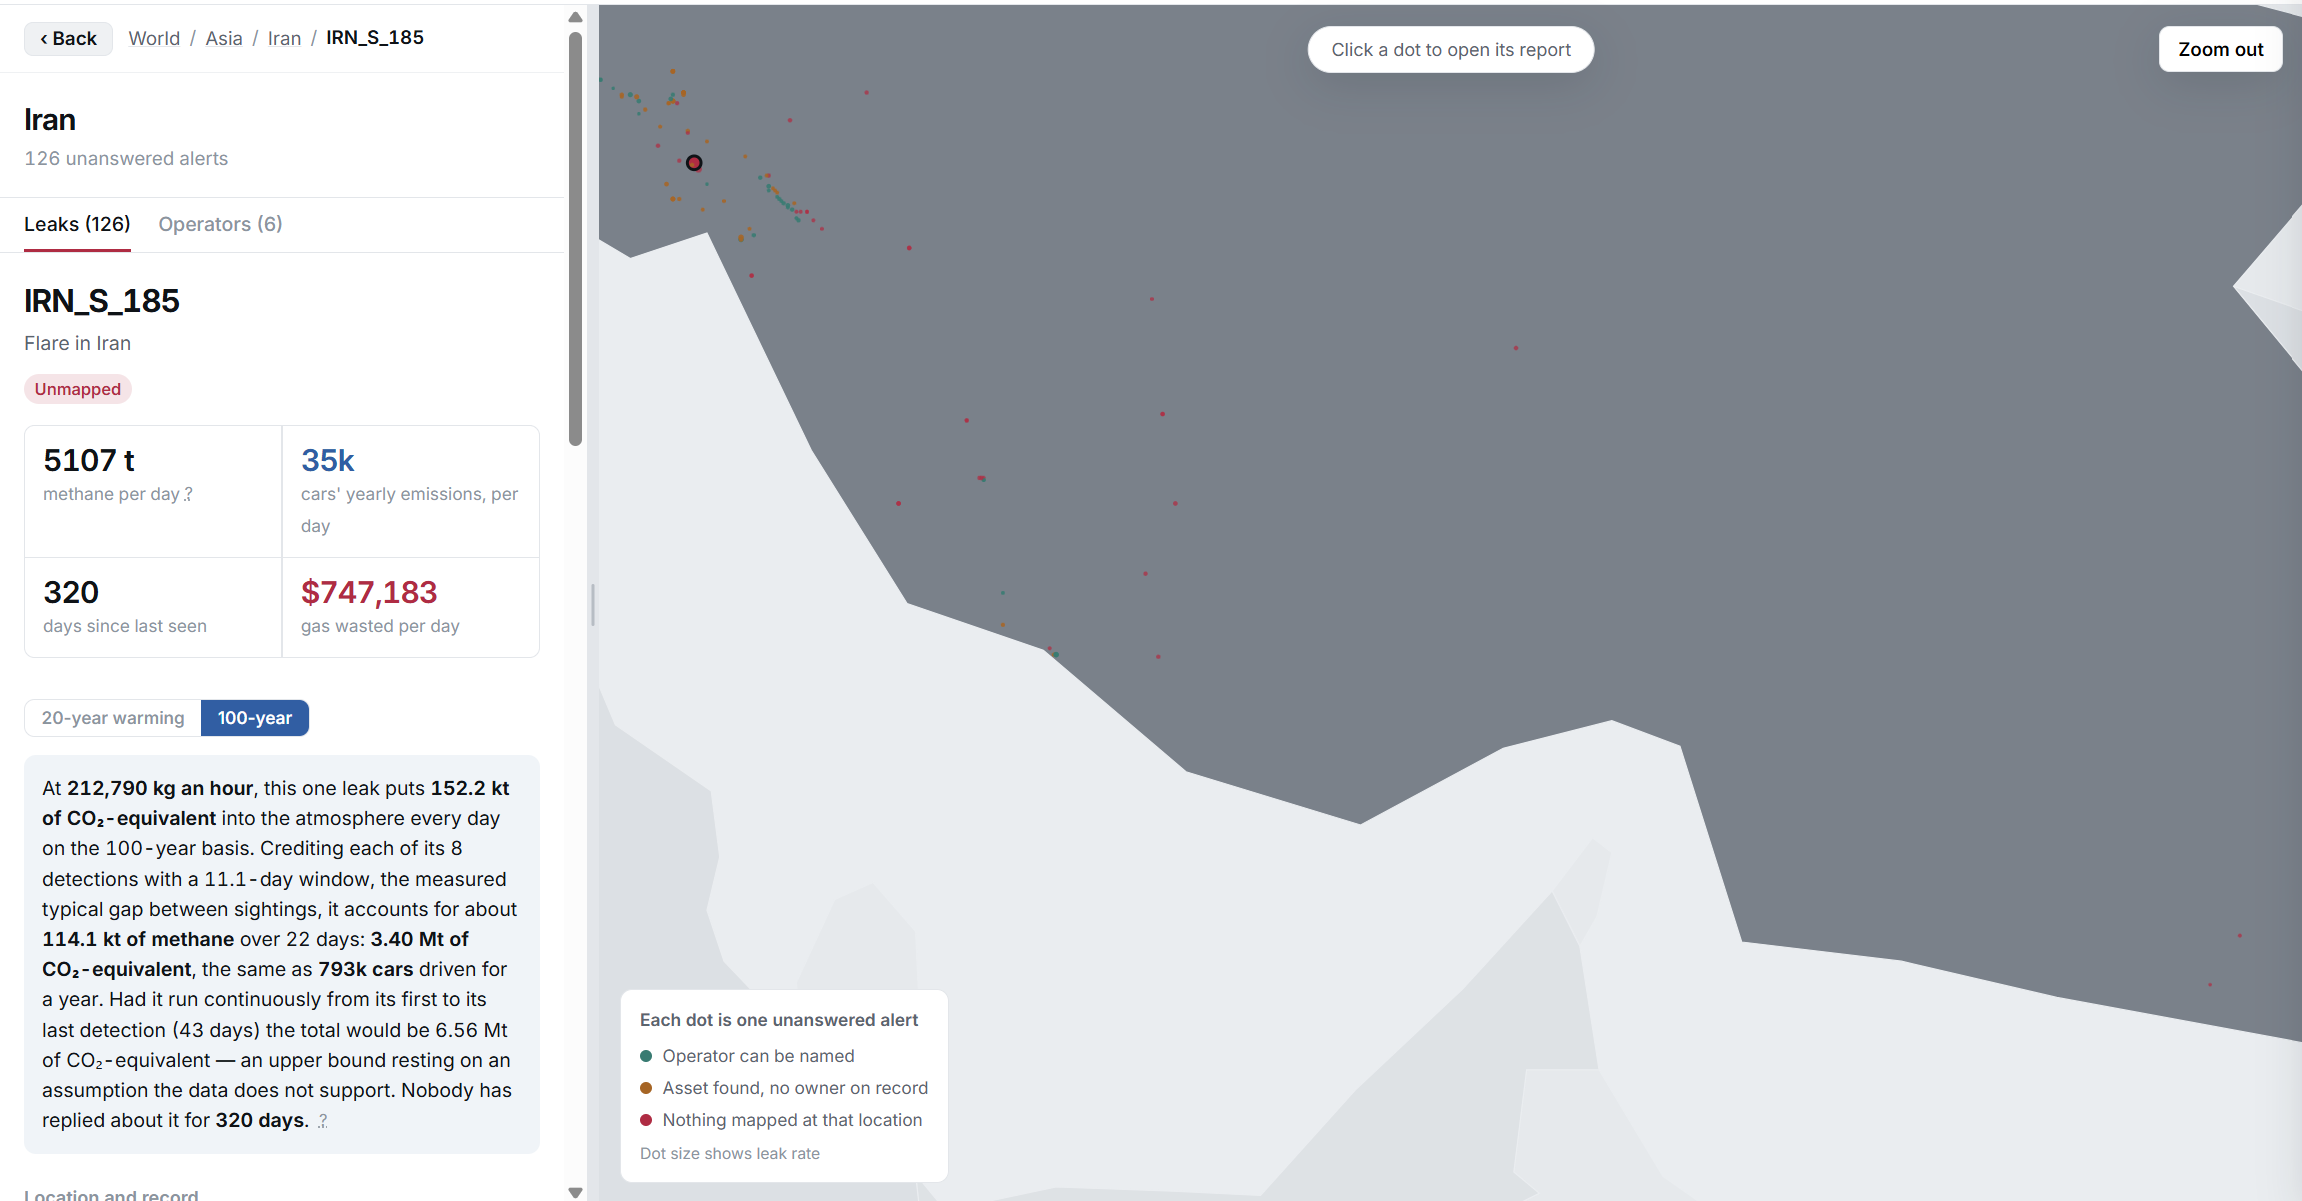
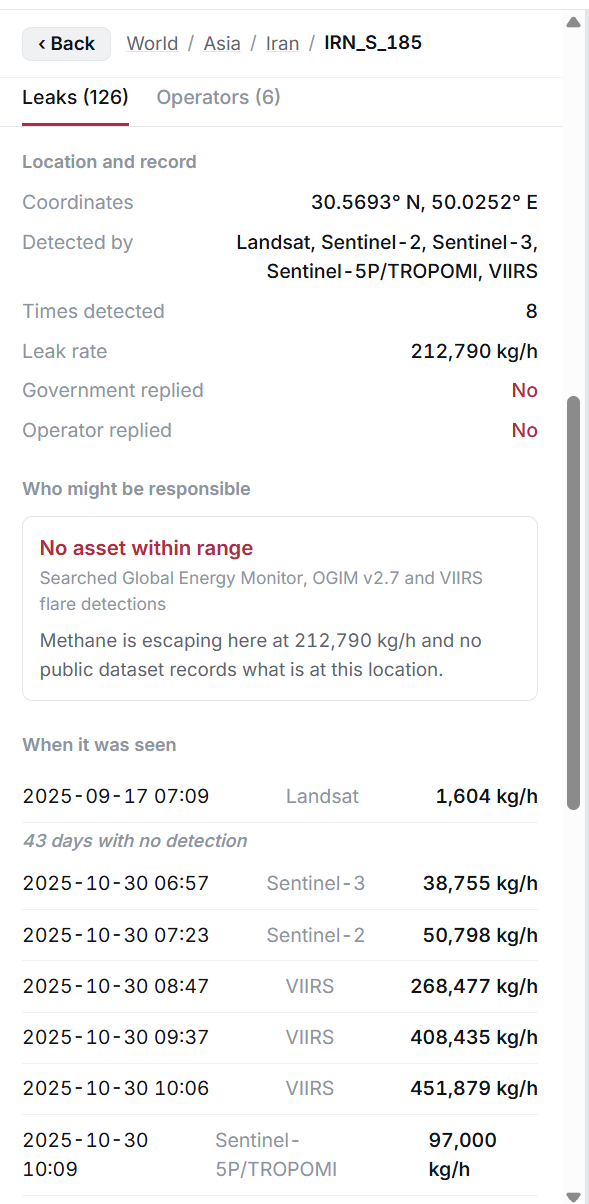
There are 1,394 of them. For each one I match the coordinate against 4.76 million pieces of infrastructure (pipelines, wells, LNG terminals, extraction sites) and show which ones are close enough to be plausible, with the real distances. Then I price the leak, both in wasted gas and in CO2-equivalent warming, with a toggle between methane's 20-year and 100-year impact.
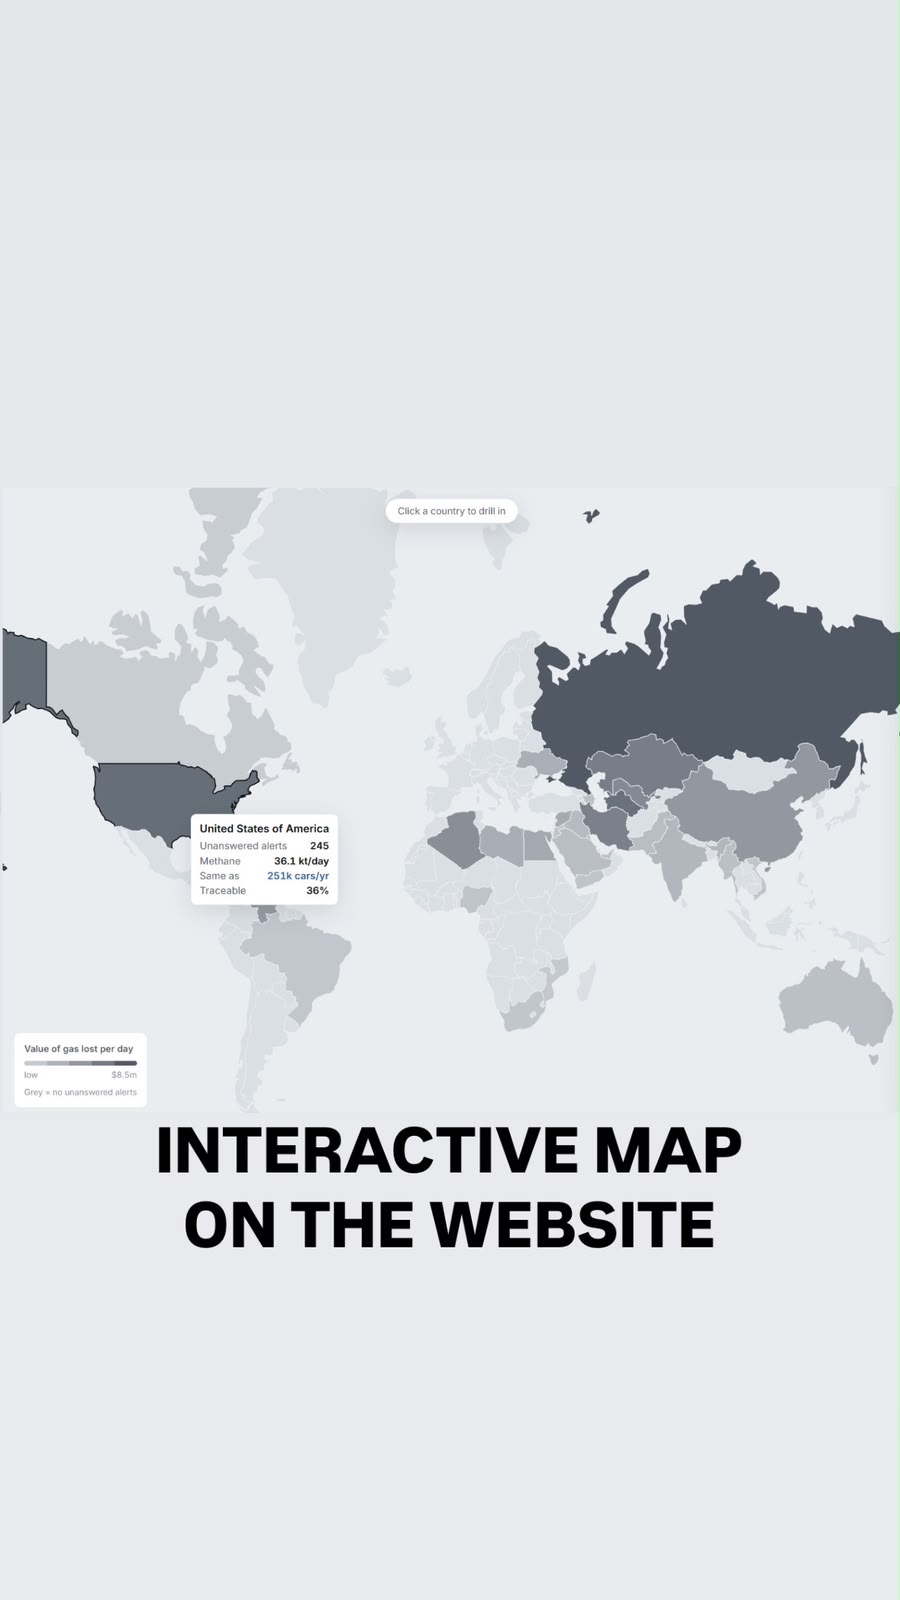
The map is coloured by how traceable a leak is, not how big it is. Teal means I could name a likely operator, amber means I found the infrastructure but not the owner, crimson means nothing public exists at all.
That's where the interesting bit came from. Of 1,394 cases I could only name an operator for 262, about 19%. Turkmenistan alone accounts for 190 unmapped cases out of 214, which is 15% of the entire global backlog. Not because those leaks are special, but because there's no public registry to check against. Algeria is 150 of 212. The US is mostly teal.
So the map ends up showing where the world is transparent enough to hold someone responsible, which wasn't what I set out to build.
Total scale: around 235,000 tonnes of methane a day at the rates detected, roughly $34M a day of gas.
How we built it
Python 3.14 with FastAPI, GeoPandas/Shapely/PyProj for the geospatial work, Pandas and PyArrow for the pipeline. Frontend is plain HTML/CSS/JS with a hand-built SVG map. Vercel for the frontend, Render for the API.
Data comes from UNEP IMEO's MARS dataset, Global Energy Monitor's pipeline and ownership trackers, and EDF's OGIM v2.7 (4.5M wells).
The matching doesn't use a haversine sphere. I project locally using WGS84 radii of curvature, because over 10km a sphere is off by about 56m against 8m for the ellipsoid, and my thresholds are in the tens of metres so that actually matters. Pipelines get densified to 2km before matching, and every plume/asset pair gets its own threshold of √(plume σ² + asset σ²) rather than one global radius.
The rule I care most about: a case only gets a named operator if exactly one company is implicated. If two competing companies both plausibly match, it drops to asset-only and I show no name. That demoted 94 cases that would have looked better left alone.
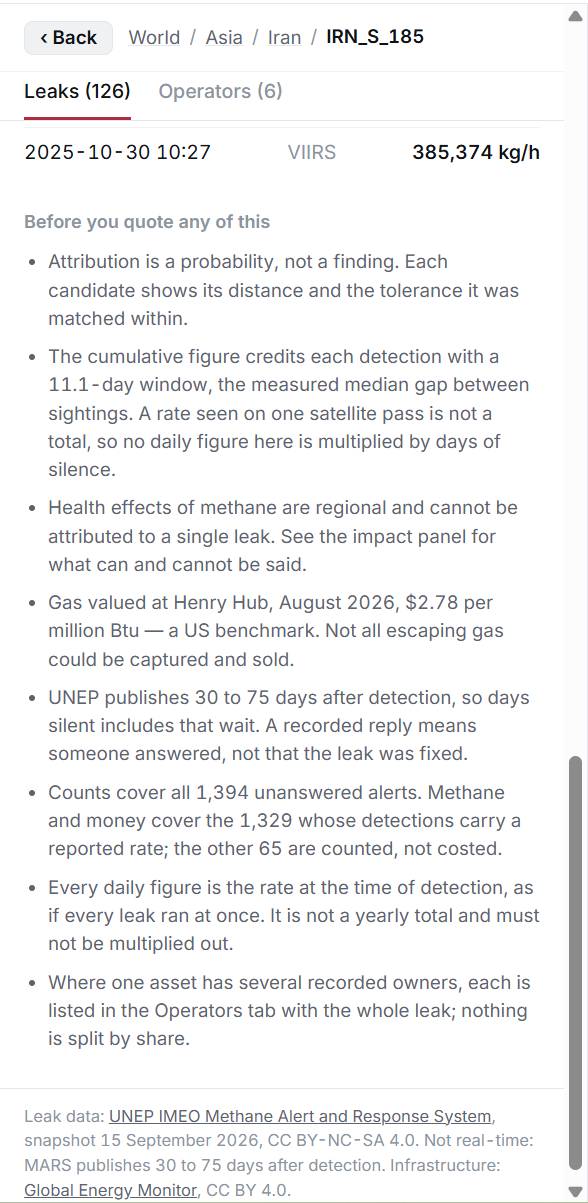
Costing uses GWP-100 of 29.8 and GWP-20 of 82.5 from IPCC AR6, and Henry Hub pricing. Each detection is capped at a measured 11.1-day window rather than multiplying the leak rate by every day of silence, which would overstate everything by about 10x.
Heavy geospatial work runs offline as a build step, so production only needs FastAPI and Uvicorn. 203 tests pass, including an AST guard that fails the build if GeoPandas ever creeps into the runtime package.
Challenges we ran into
The worst one by a mile: the leak detail panel looked brilliant. Detection timestamps, per-detection rates, candidate names, distances, tolerances. Then I actually read the code and found the whole thing was coming from a random number generator seeded on the case ID. It was fake data dressed up as evidence.
That's a genuinely dangerous bug in a project whose entire pitch is "I won't name a company unless the geometry backs it up". I deleted the generator, wired the real detections and candidates through, and pinned it three ways including a JSDOM test that fails if any RNG exists in the page at all. Once real numbers went in, 155 of 417 asset cases turned out not to sit on the asset type I'd assumed, and a warning I'd been showing was wrong for 48 of 93 cases.
There was also a 1000x costing error, caught by tests. MARS uses two mass units in the same table (ch4_fluxrate is kg/h, total_emission is tonnes) and mixing them gives you numbers that look completely reasonable and are off by three orders of magnitude.
My laptop is a Snapdragon X Plus and win-arm64 geospatial wheels don't exist. Lost most of a day to that before moving the whole environment over to WSL2.
Vercel also serves a literal index.html in preference to honouring vercel.json rewrites, which took an embarrassing amount of time to work out.
Accomplishments that we're proud of
Not guessing. A version of this that names a company for every single leak would look more finished and be worse. The probabilistic language, the demotion rule, the 11.1-day cap, never annualising the daily figure — all of those made the numbers smaller and the project more defensible.
And the transparency finding wasn't planned. I built the traceability colouring thinking it was a UI detail and it turned into the actual point of the whole thing.
What we learned
A sphere isn't good enough when your thresholds are in metres, and uncertainty compounds rather than being a number you pick because it sounds right.
Tests beat polish. Both of my worst bugs looked perfectly fine on screen.
Real scientific datasets are messier than they look. MARS has three different null conventions, GEM has 28 outlines truncated at Excel's character limit and 110 Polish ones in the wrong CRS.
Mostly: "looks convincing" and "is true" are completely separate things, and that gap is where an AI-assisted build goes wrong fastest.
What's next for Unanswered
An exportable evidence pack per case, so a regulator could take one PDF into a conversation with an operator.
Monthly automated re-ingest so the backlog updates as UNEP publishes.
Seeing whether regional registries in Central Asia can shrink the unmapped tier, since that's where the real gap is.
Caveats, stated plainly: attribution is probabilistic and says "likely operator", never "responsible for". Nothing here is an accusation. This is a live backend serving a snapshot from 15 September, not a live feed, because MARS publishes on a 30-75 day lag anyway. A logged response means a reply, not a repair. Henry Hub is a US benchmark and not all escaping gas is recoverable. The health figures are global and don't attach to any single leak. Per UNEP's own guidance, none of this is a ranking of national emissions.
Built during the hackathon: nothing existed before. Empty repo on 15 September 2026, everything since.

Log in or sign up for Devpost to join the conversation.