-
-
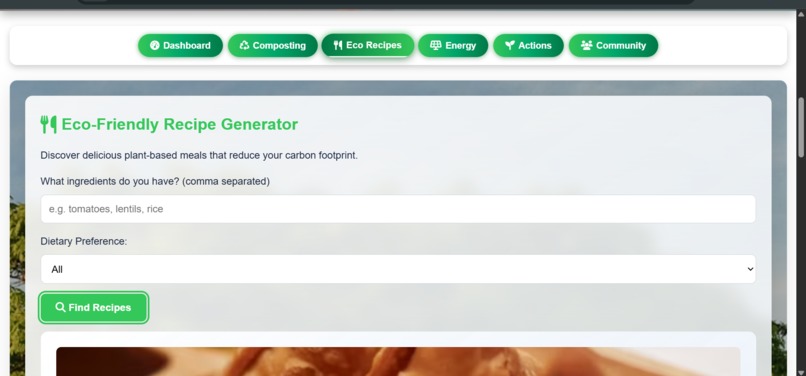
The recipe interface
-

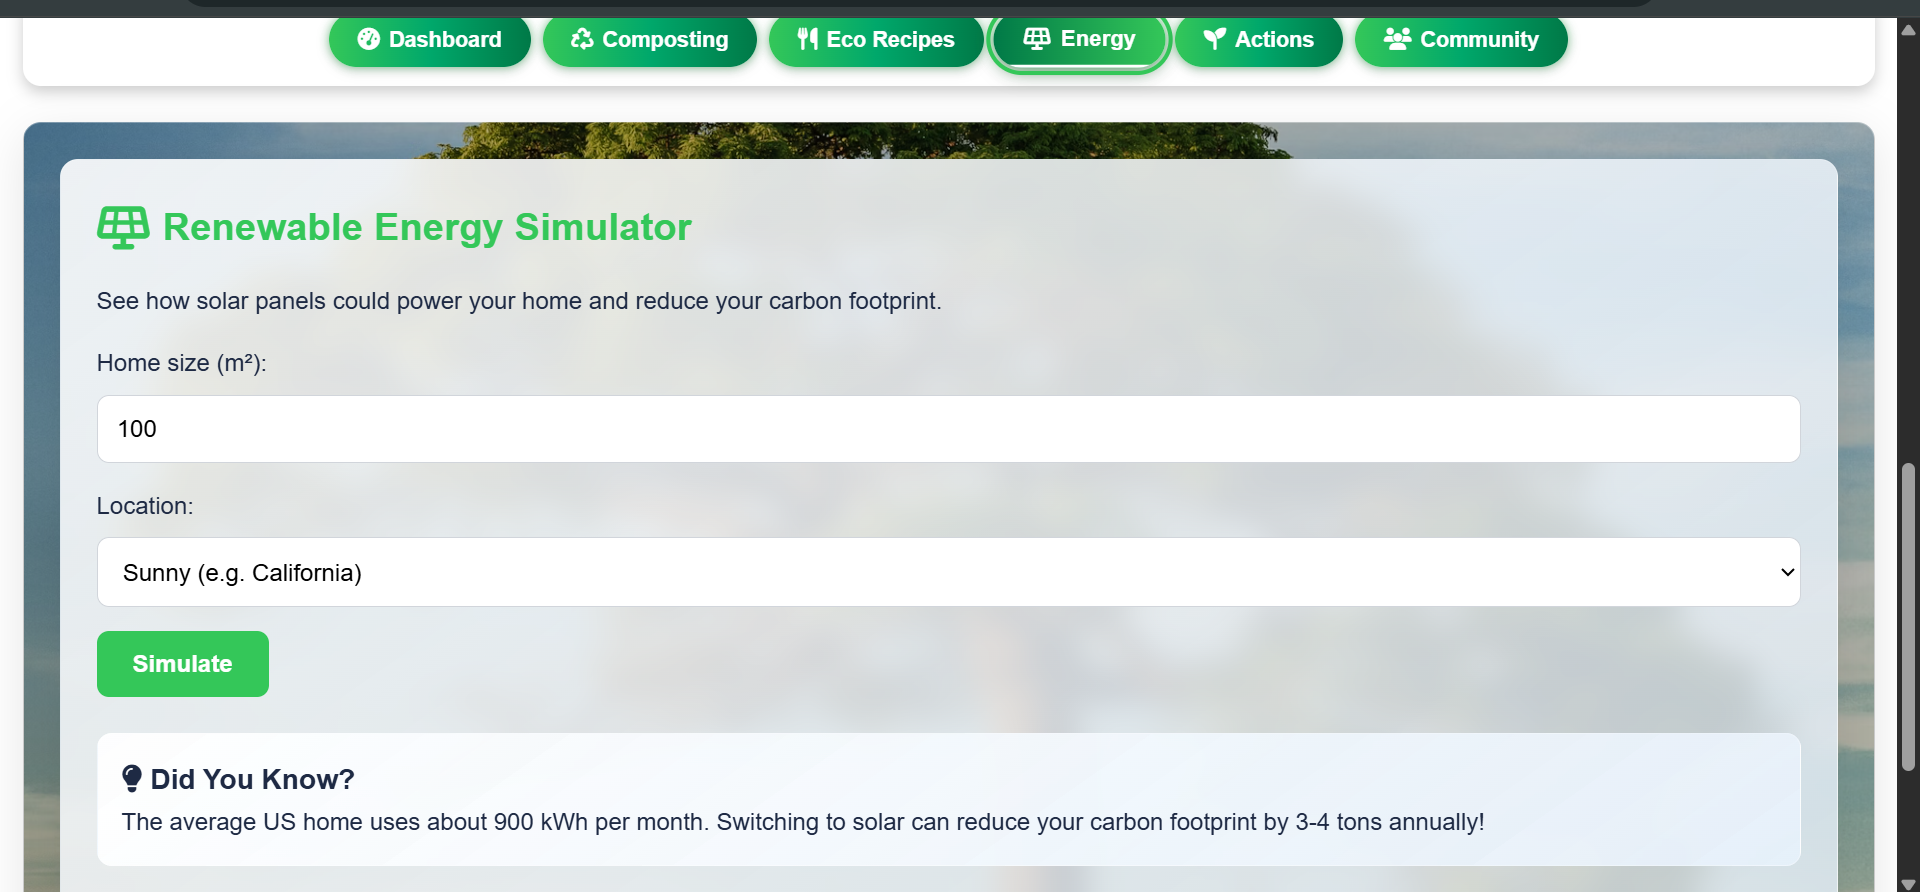
The energy interface
-
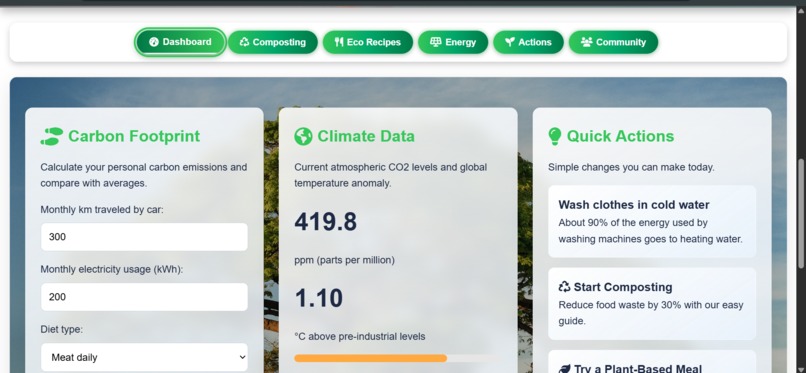
The dashboard interface
-

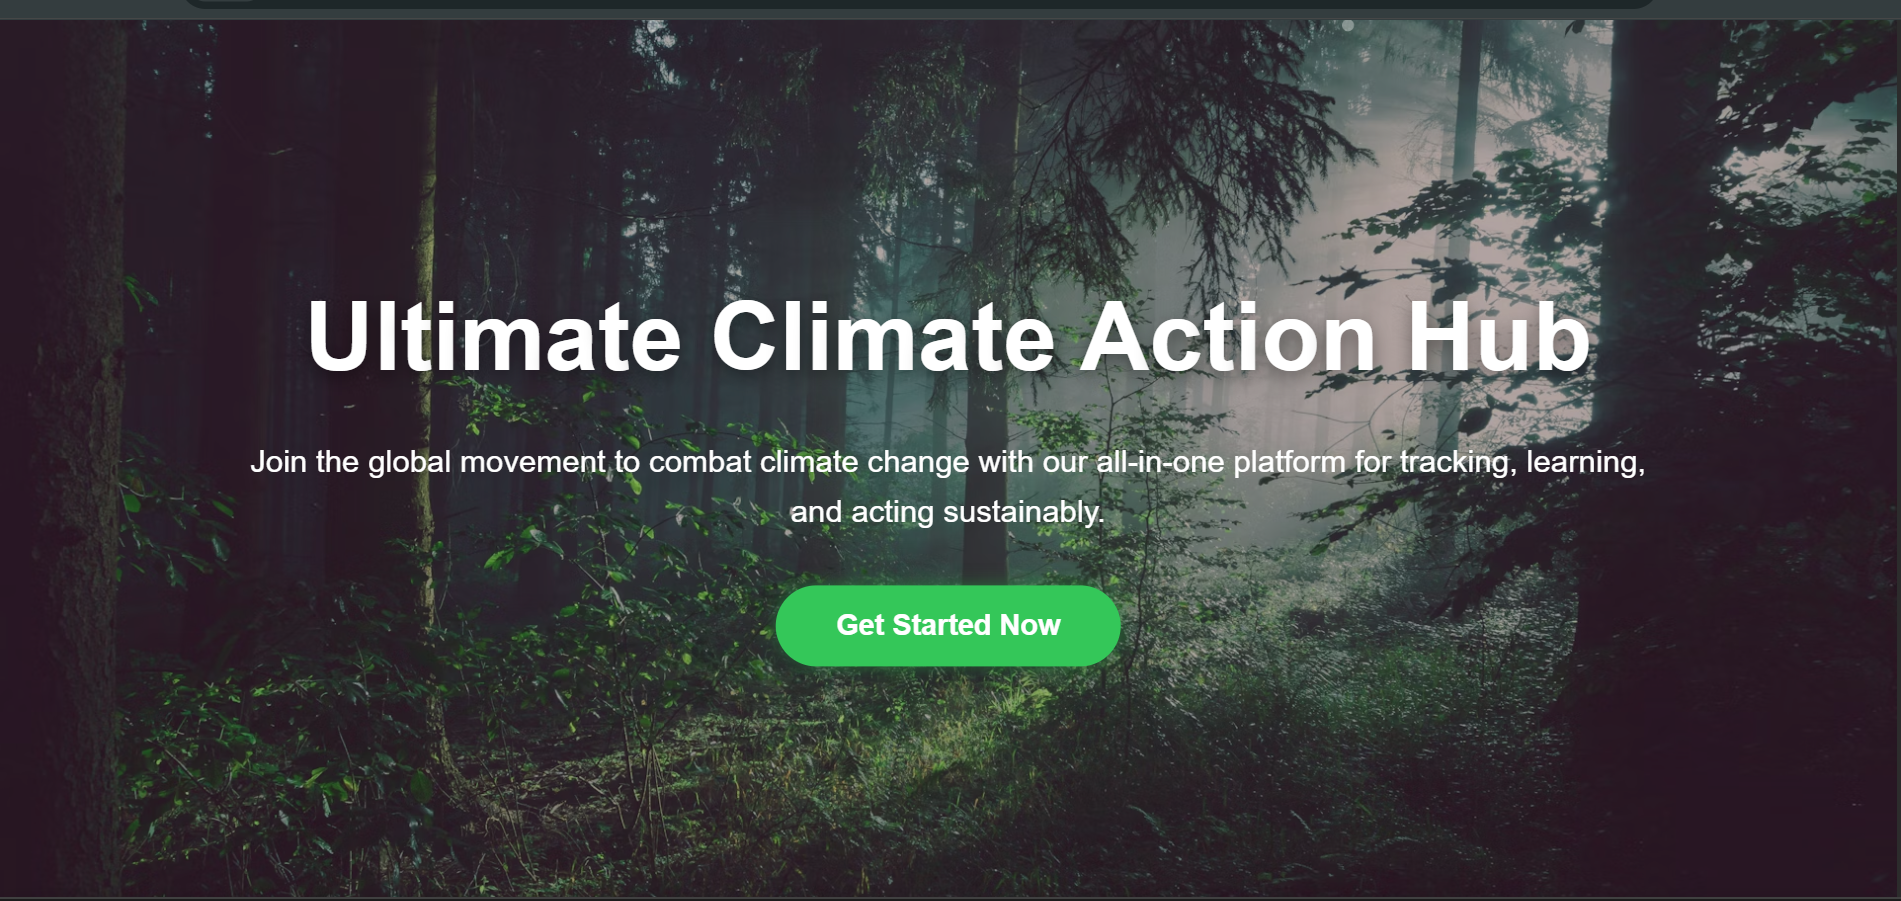
Landing Page of the Ultimate Climate Action Hub


About the Project
Inspiration
The Ultimate Climate Action Hub was inspired by the urgent need to address climate change, as highlighted by the United Nations Sustainable Development Goal 13 (Climate Action). Witnessing the devastating effects of global warming—rising temperatures, extreme weather, and biodiversity loss—motivated us to create an engaging platform that empowers individuals to take meaningful action. We wanted to make sustainability accessible, fun, and impactful by combining education, interactive tools, and community engagement. The idea of turning small, everyday choices into collective impact drove us to build a hub where users could track their carbon footprint, learn eco-friendly practices, and connect with others in the fight for a greener future.
What We Learned
Building this project was a deep dive into web development, user experience design, and climate science. Key learnings included:
Frontend Development: Mastering Anime.js for smooth animations and Chart.js for data visualization enhanced our ability to create engaging interfaces.
Responsive Design: Using CSS media queries and fluid typography (clamp) ensured accessibility across devices, from mobile to desktop.
Accessibility: Implementing ARIA labels and keyboard navigation taught us the importance of inclusive design for WCAG compliance.
Climate Science: Researching carbon footprint calculations, composting techniques, and renewable energy systems deepened our understanding of sustainable practices.
How I Built the Project
The project was built as a client-side web application using modern web technologies. The process included:
Planning: Defined core features (carbon calculator, recipe generator, challenges) aligned with SDG 13. Sketched wireframes for a tab-based interface.
Design: Created a vibrant, nature-inspired UI with gradients and Unsplash backgrounds. Used Figma to prototype card layouts and animations.
Development:
HTML/CSS: Structured the app with semantic HTML and styled it with responsive CSS, including media queries and clamp for fluid scaling.
JavaScript: Implemented interactivity, from form handling to dynamic content generation (e.g., recipes, leaderboard).
Anime.js: Added animations for text, cards, and transitions to enhance user engagement.
Chart.js: Built a bar chart for carbon footprint comparisons.
Font Awesome: Integrated icons for visual clarity.
Testing: Tested across browsers (Chrome, Firefox) and devices (mobile, tablet, desktop) to ensure responsiveness and performance. Optimized particle animations for mobile by reducing counts.
Content Creation: Developed educational content for composting, recipes, and tips, ensuring accuracy and relevance.
Challenges I Faced
Animation Performance: Balancing Anime.js animations for smooth performance on low-end devices was tricky. We reduced particle counts and simplified mobile transitions to address this.
Responsive Design: Ensuring consistent layouts across screen sizes required extensive testing with media queries and flexible units.
Accessibility: Adding ARIA labels and keyboard navigation for tabs was initially complex but critical for inclusivity.
Mock Data: Without access to real-time APIs, we simulated climate data and events with randomized values, which required careful calibration to maintain realism.
Time Constraints: The hackathon’s tight deadline pushed us to prioritize features and streamline development, teaching us efficient task delegation.
Built With
Languages: HTML5, CSS3, JavaScript
Frameworks/Libraries:
Anime.js (animations) Chart.js (data visualization) Font Awesome (icons)
Platforms: Client-side web application, compatible with modern browsers
Other Technologies:
Unsplash (background images) CDN-hosted libraries (Anime.js, Chart.js, Font Awesome) Tools: VS Code, Figma (for UI prototyping), Git (version control)
Built With
- anime.js
- chart.js
- css3
- html5
- javascript


Log in or sign up for Devpost to join the conversation.