-
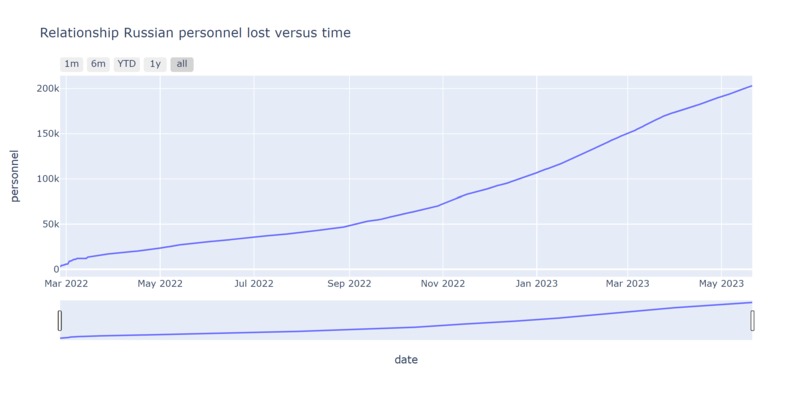
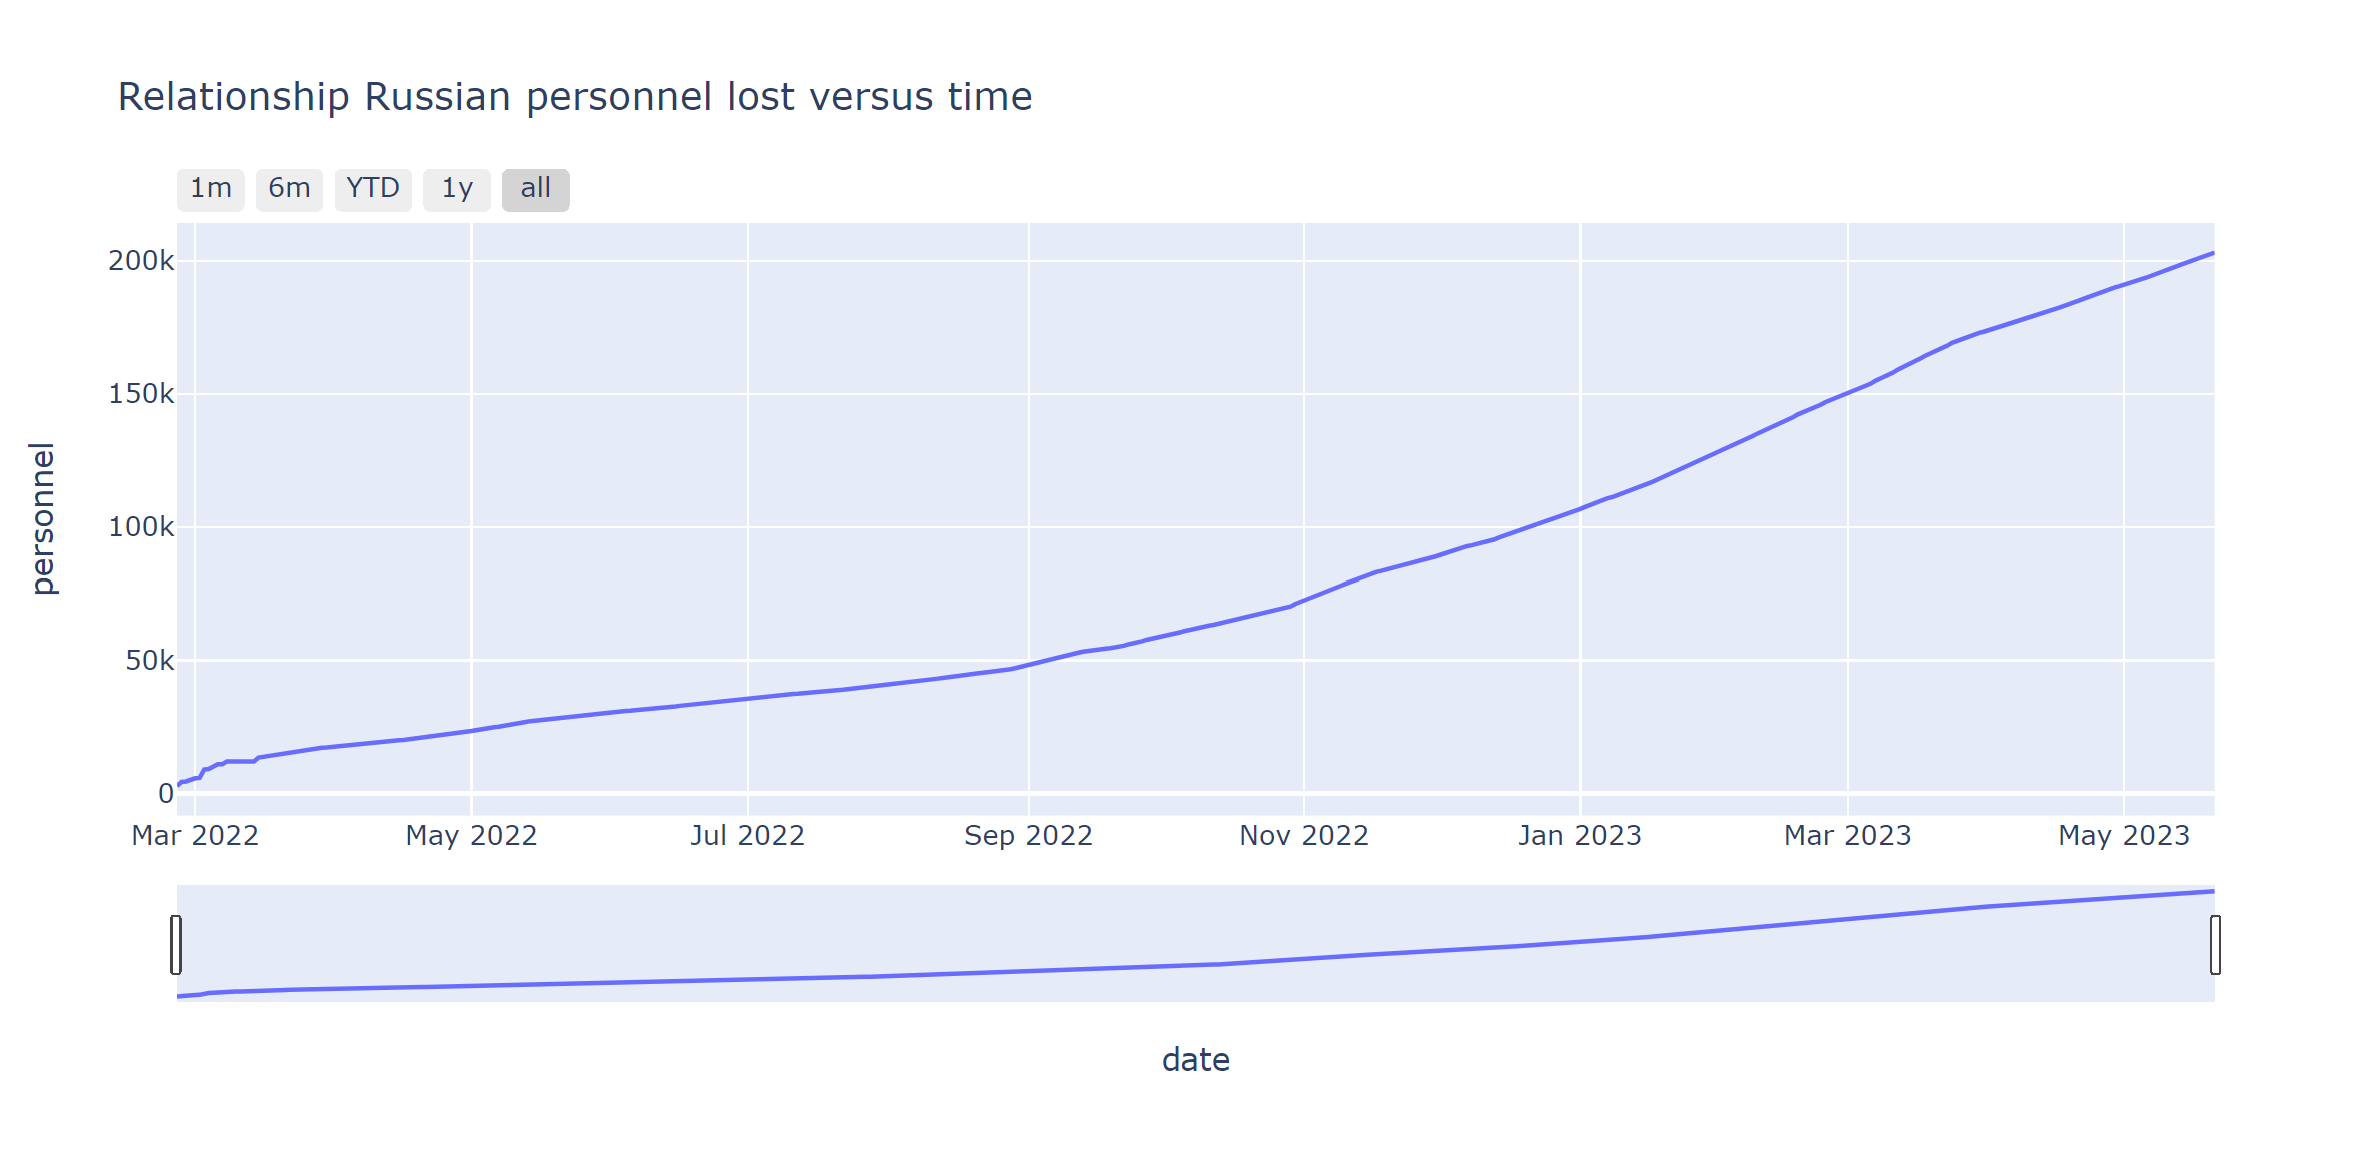
Russian personnel lost versus time
-
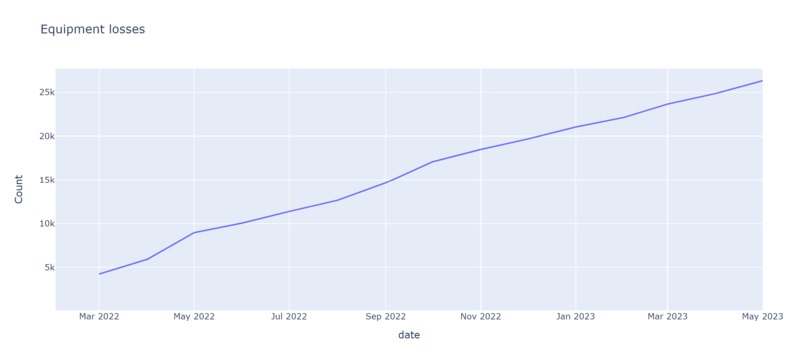
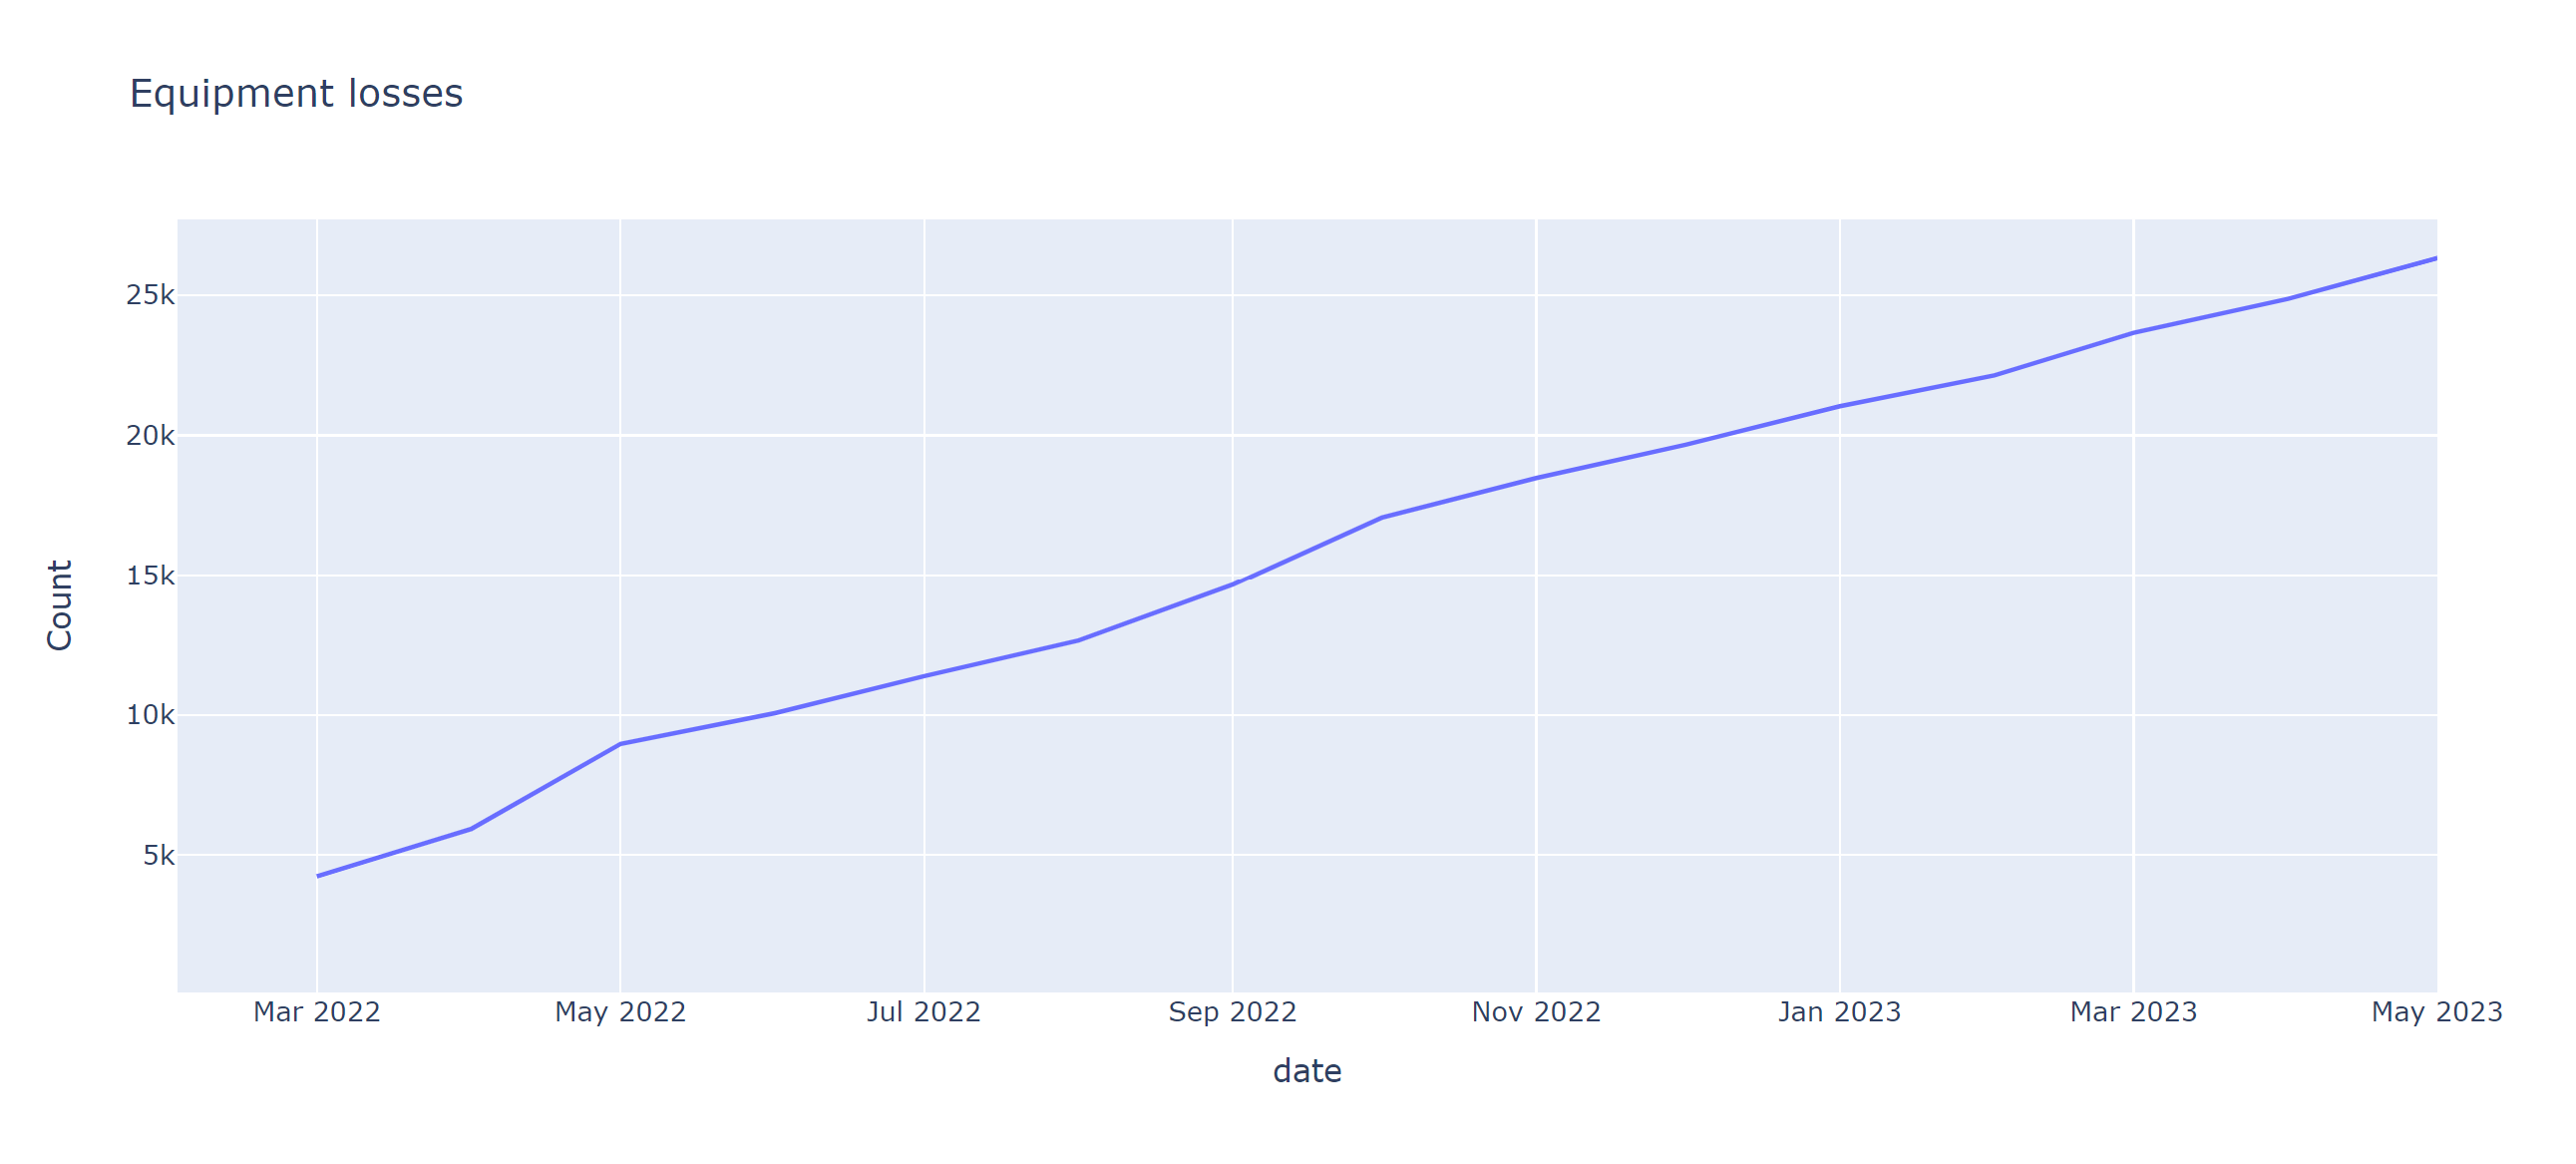
Russian equipment lost versus time
-
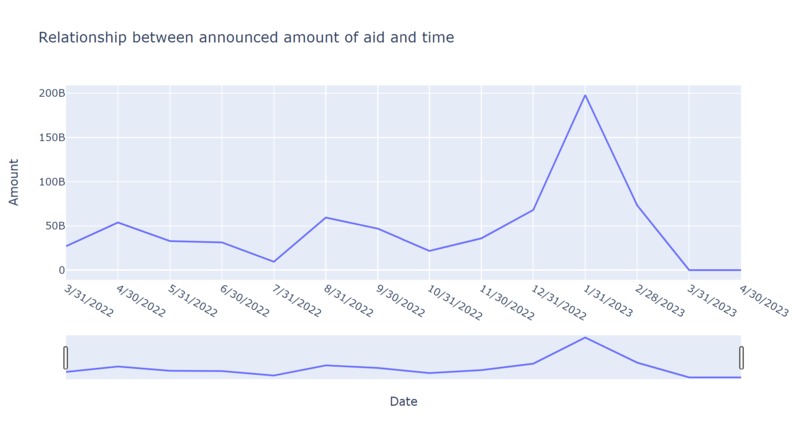
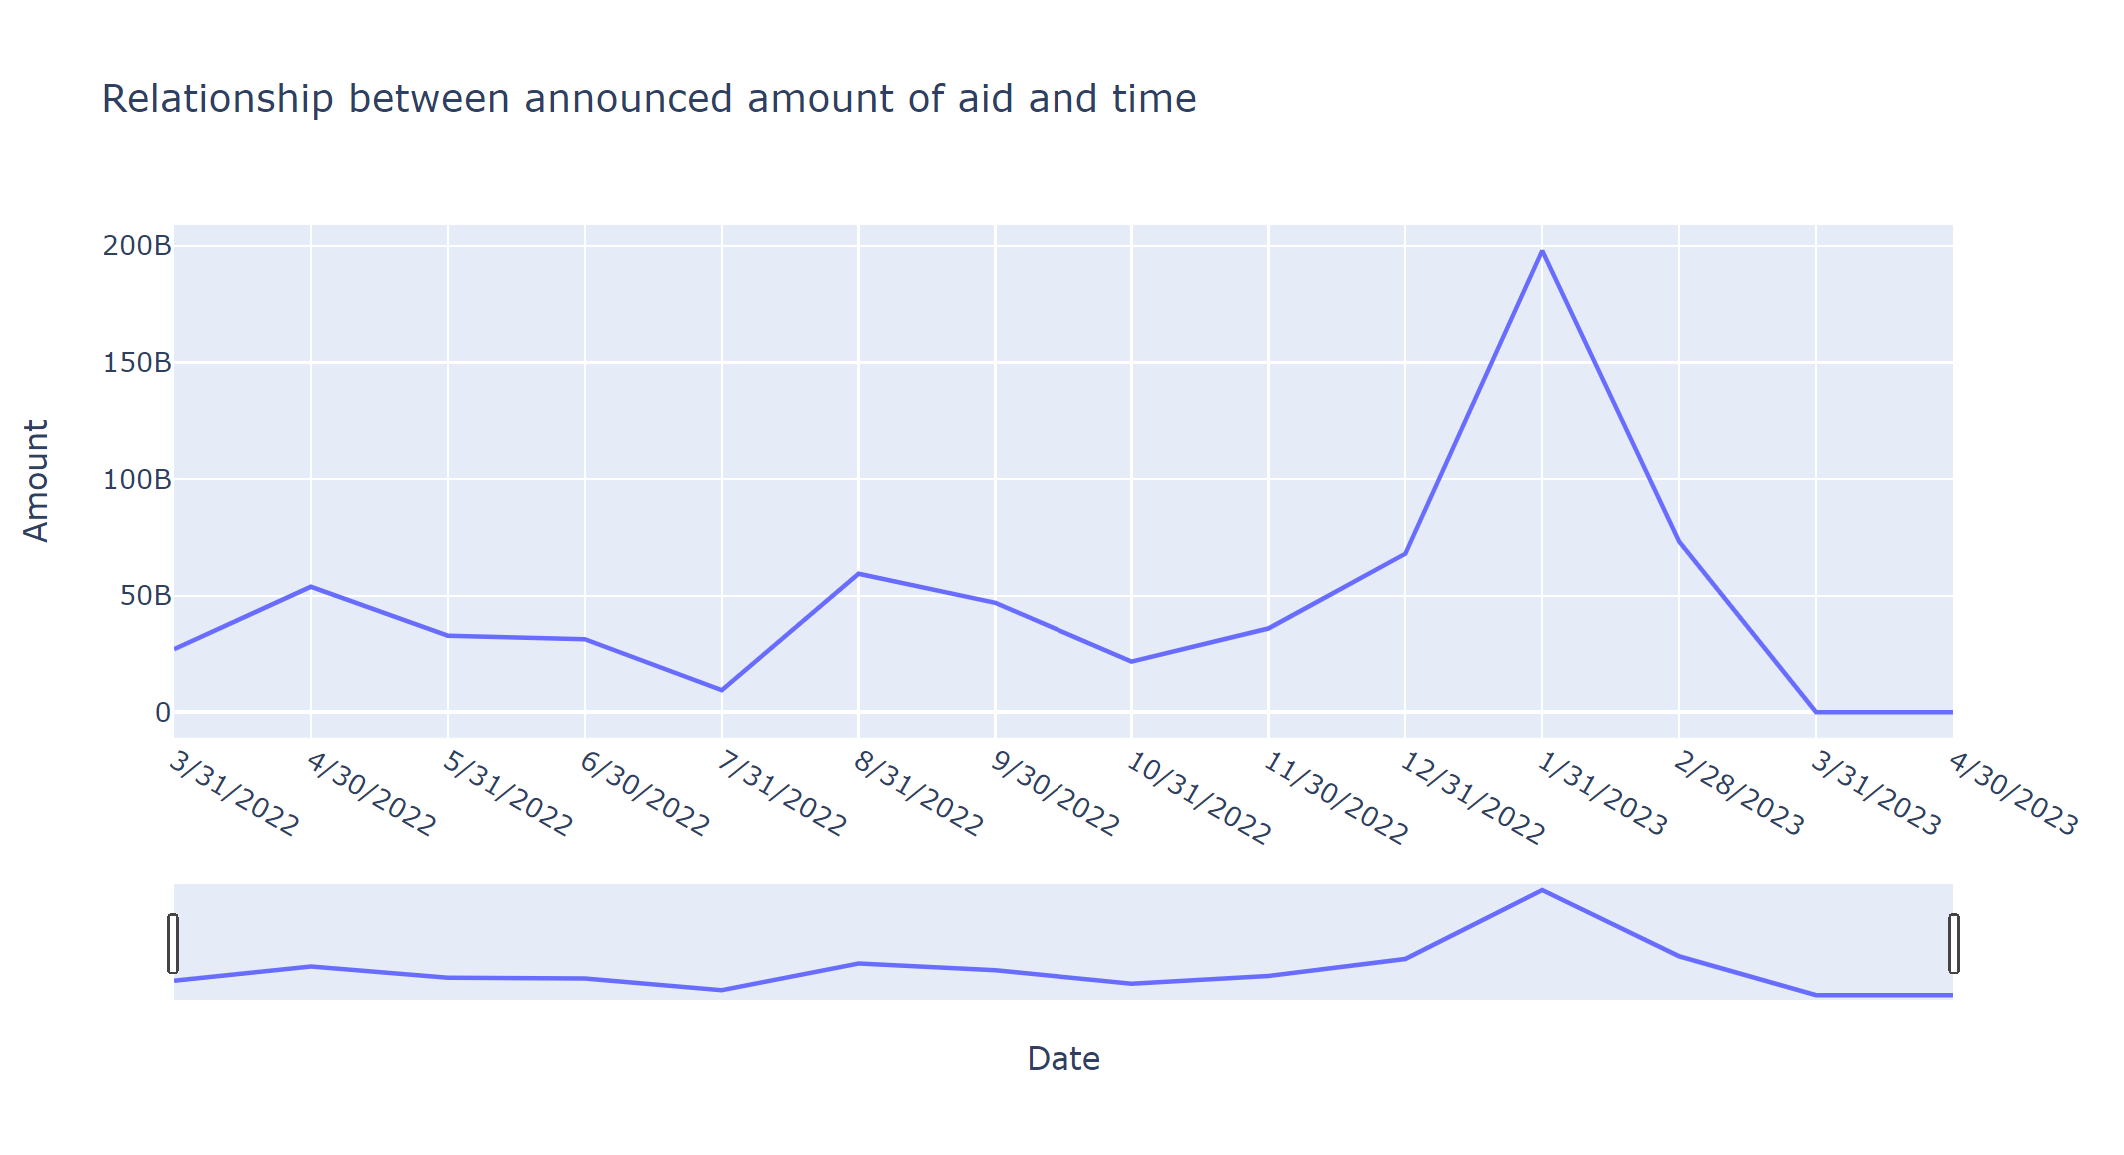
Announced amount of aid versus time
-
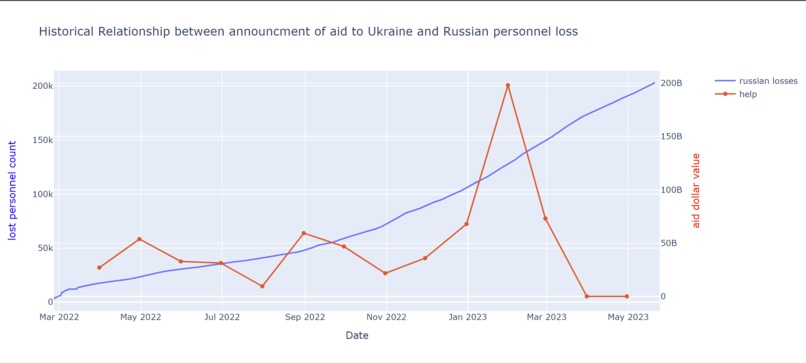
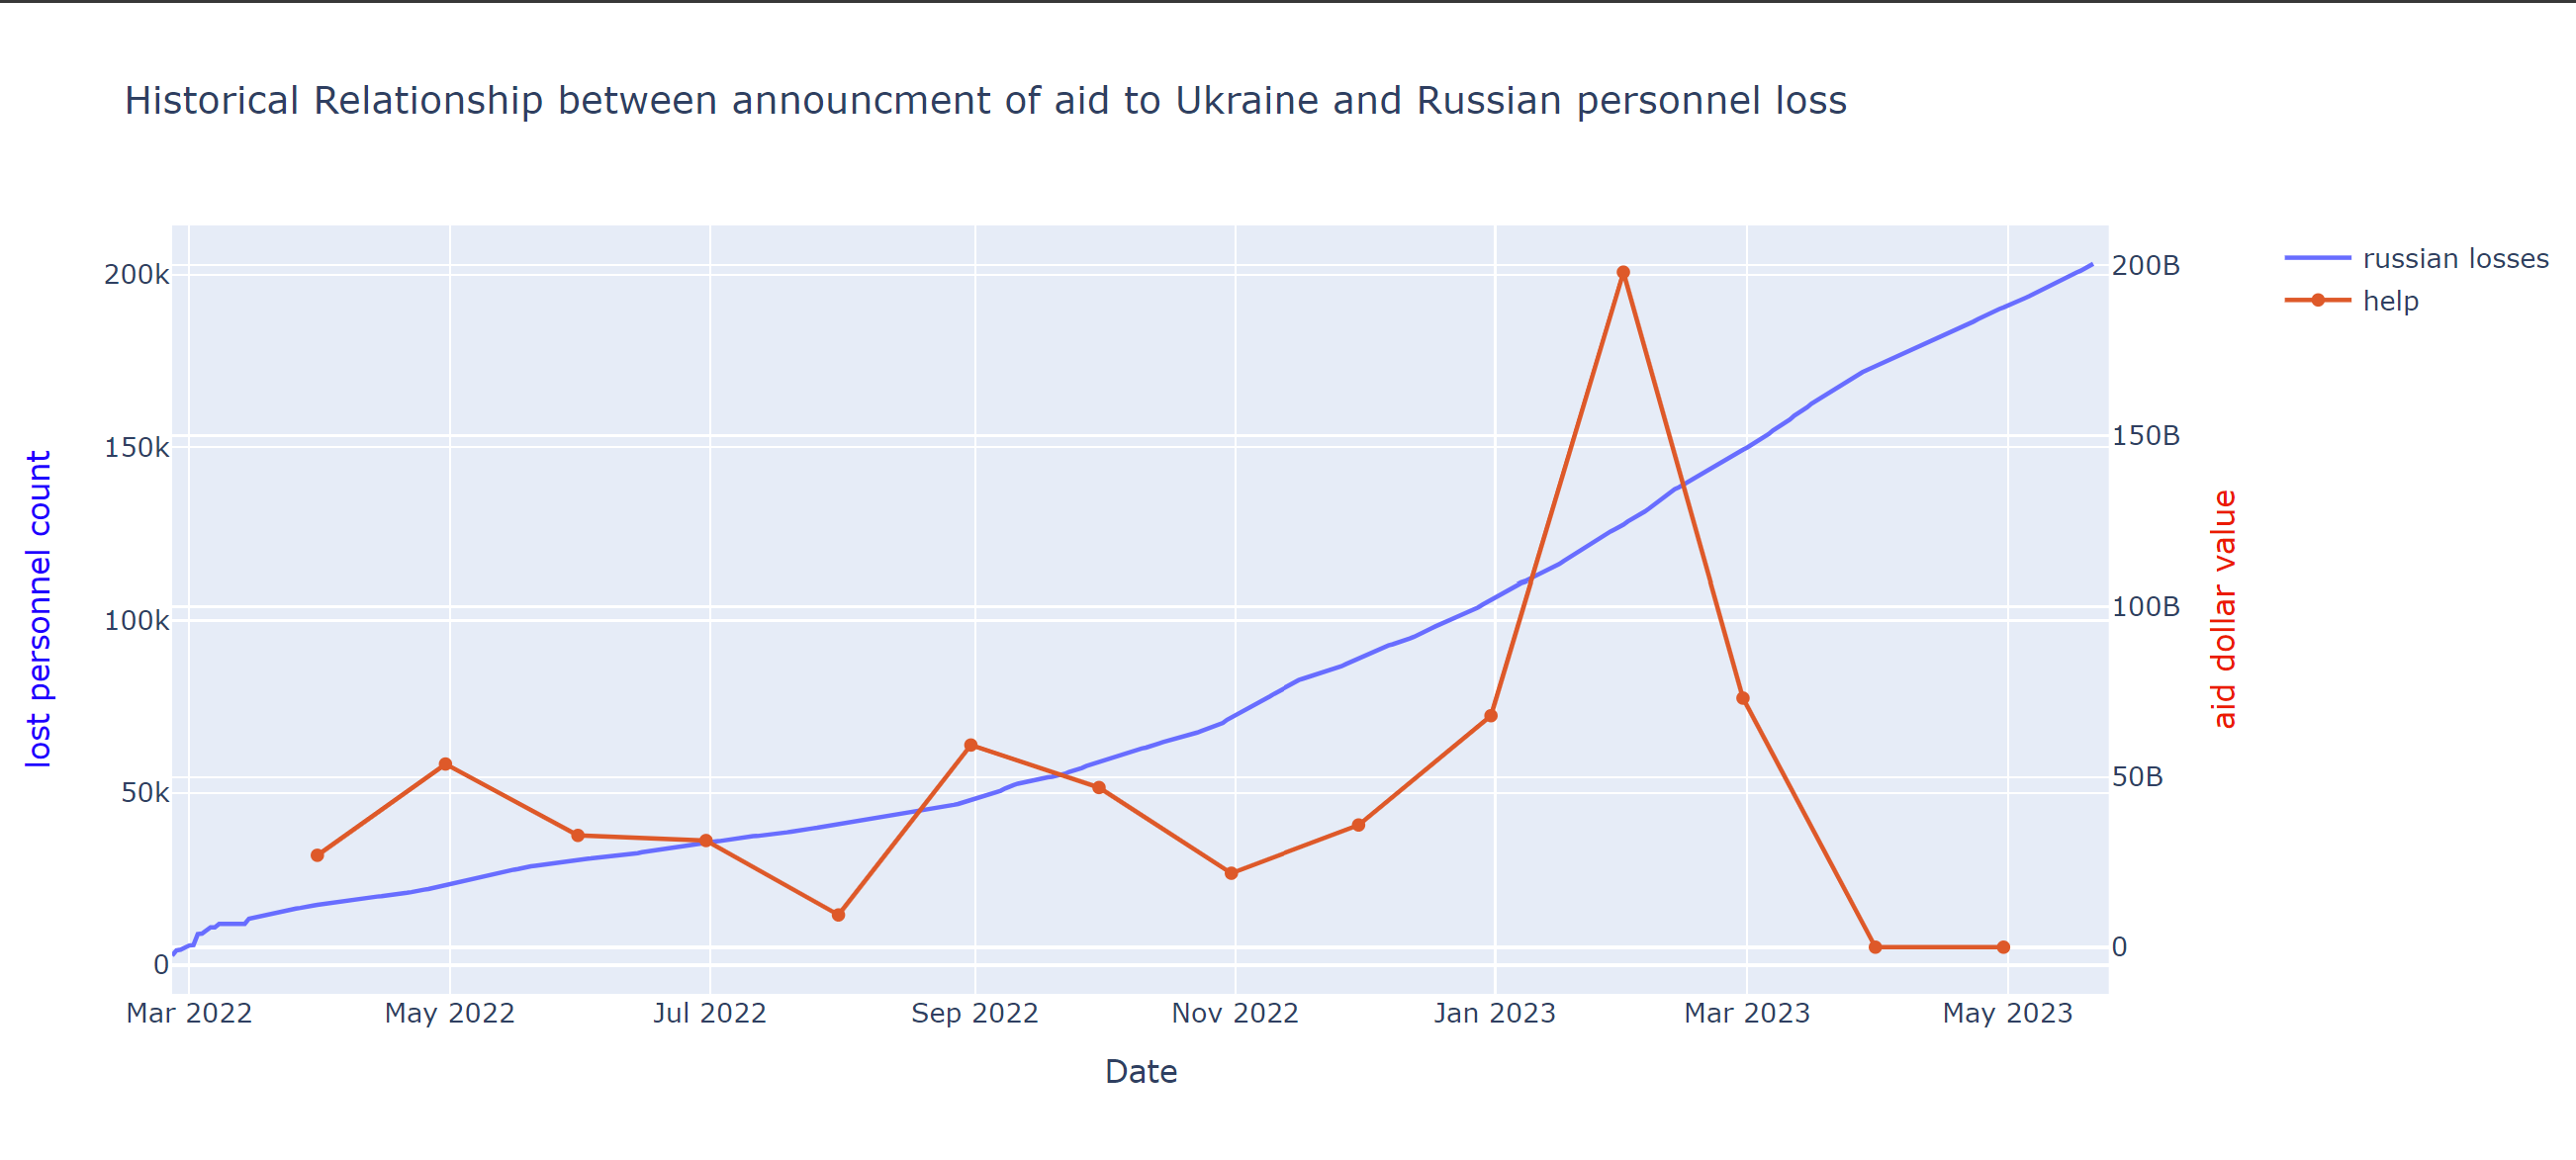
Announced amount of aid versus Russian personnel lost
-
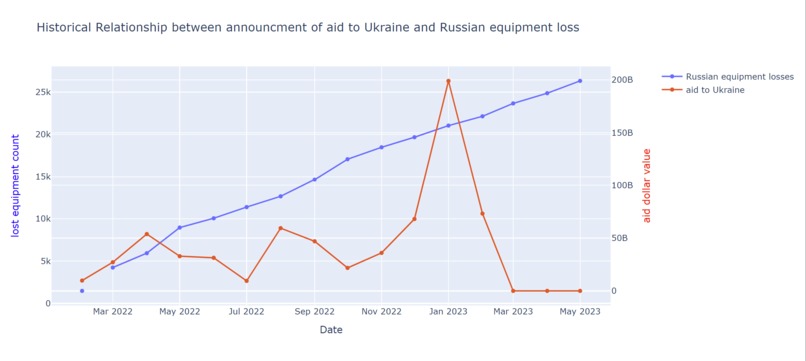
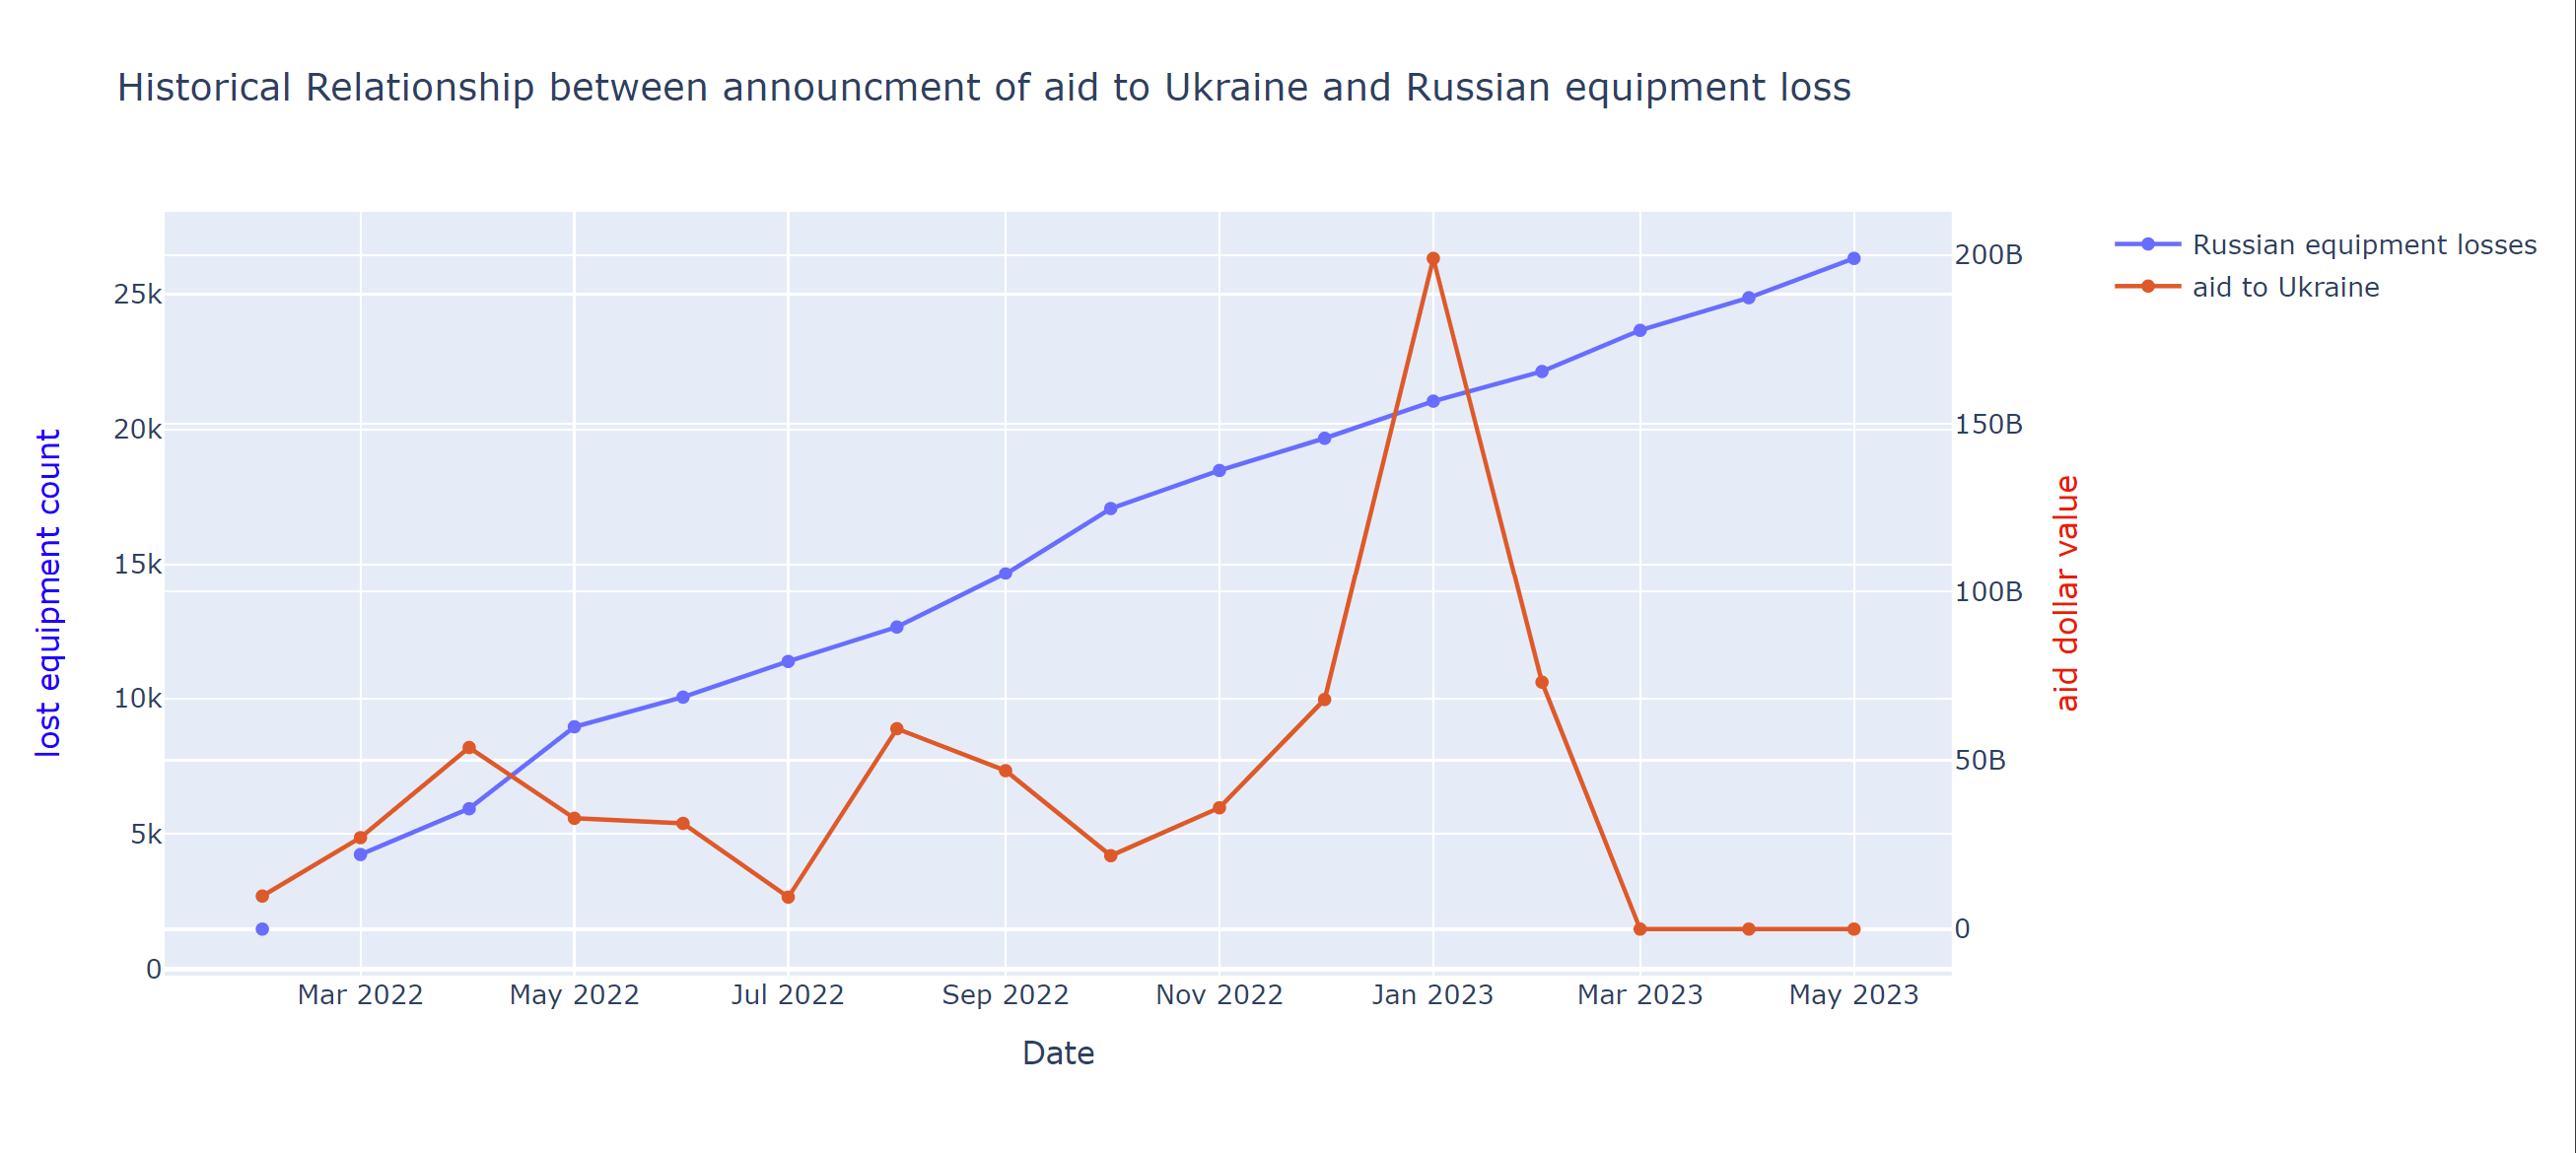
Announced amount of aid versus Russian equipment lost
-
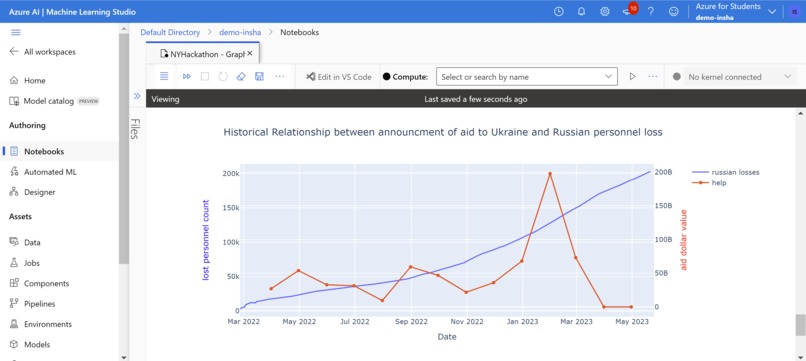
Screenshot of our project in Azure Machine Learning System

Inspiration
Inna was born and raised in the northern part of Ukraine. From 24th February 2022 - August 6th, 2022 Inna was in a town that was a three-hours drive from the Ukrainian capital. Dilrabo is from Uzbekistan, from a post-Soviet Union country, which was next the most affected countries by the war. Dilrabo and Inna were watching the Ukrainian Eurovision performance and were reminded of the harsh war situation. This inspired them to address this problem using their knowledge of Data Science.
What it does
This project shows how foreign aid for Ukraine impacts the chances of its victory based on the number of equipment and personnel Russian lost
How we built it
First of all, we found datasets of Russian equipment and human losses and the amount of aid (financial, military, humanitarian) from foreign countries. The analysis and visualization parts were created in GoogleCollab and Jupyter Notebook using Python language and Pandas, Plotly, and Numpy libraries. Finally, we downloaded our project in Azure Machine Learning Studio.
Challenges we ran into
- Analysis of big datasets
- Showing on graph plot two graphs with two y-axes
- Setting Azure Workspace through terminal and Jupyter notebook
- Transforming dataset by standardizing "datetime" objects and aggregating raw data into readable time periods
Accomplishments that we’re proud of
- Visualization of information from two big datasets on one graph using Pandas, Plotly, and Numpy libraries
- Deploying into Azure Machine Learning Workspace
What we learned
- How to visualize the information from two big datasets on one graph using Pandas, Plotly, and Numpy libraries
- How to deploy into Azure Machine Learning Workspace
What’s next for Ukrainian-Russian War Analysis
Completing a Machine Learning Model using linear regression/clustering algorithm that will predict the amount and type of aid needed to gain Ukrainian victory in the war.


Log in or sign up for Devpost to join the conversation.