-
-

Project Icon
-
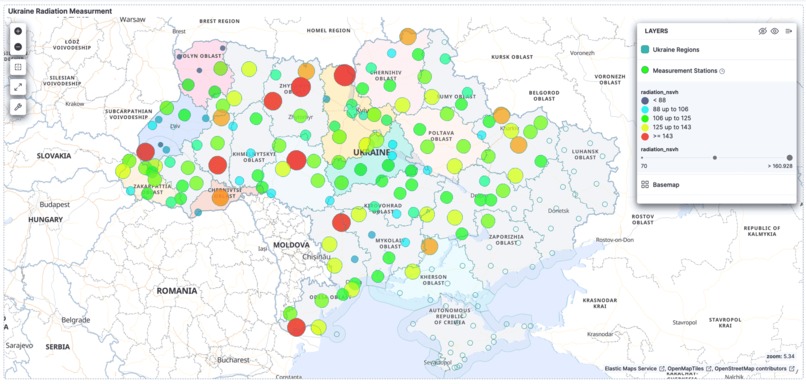
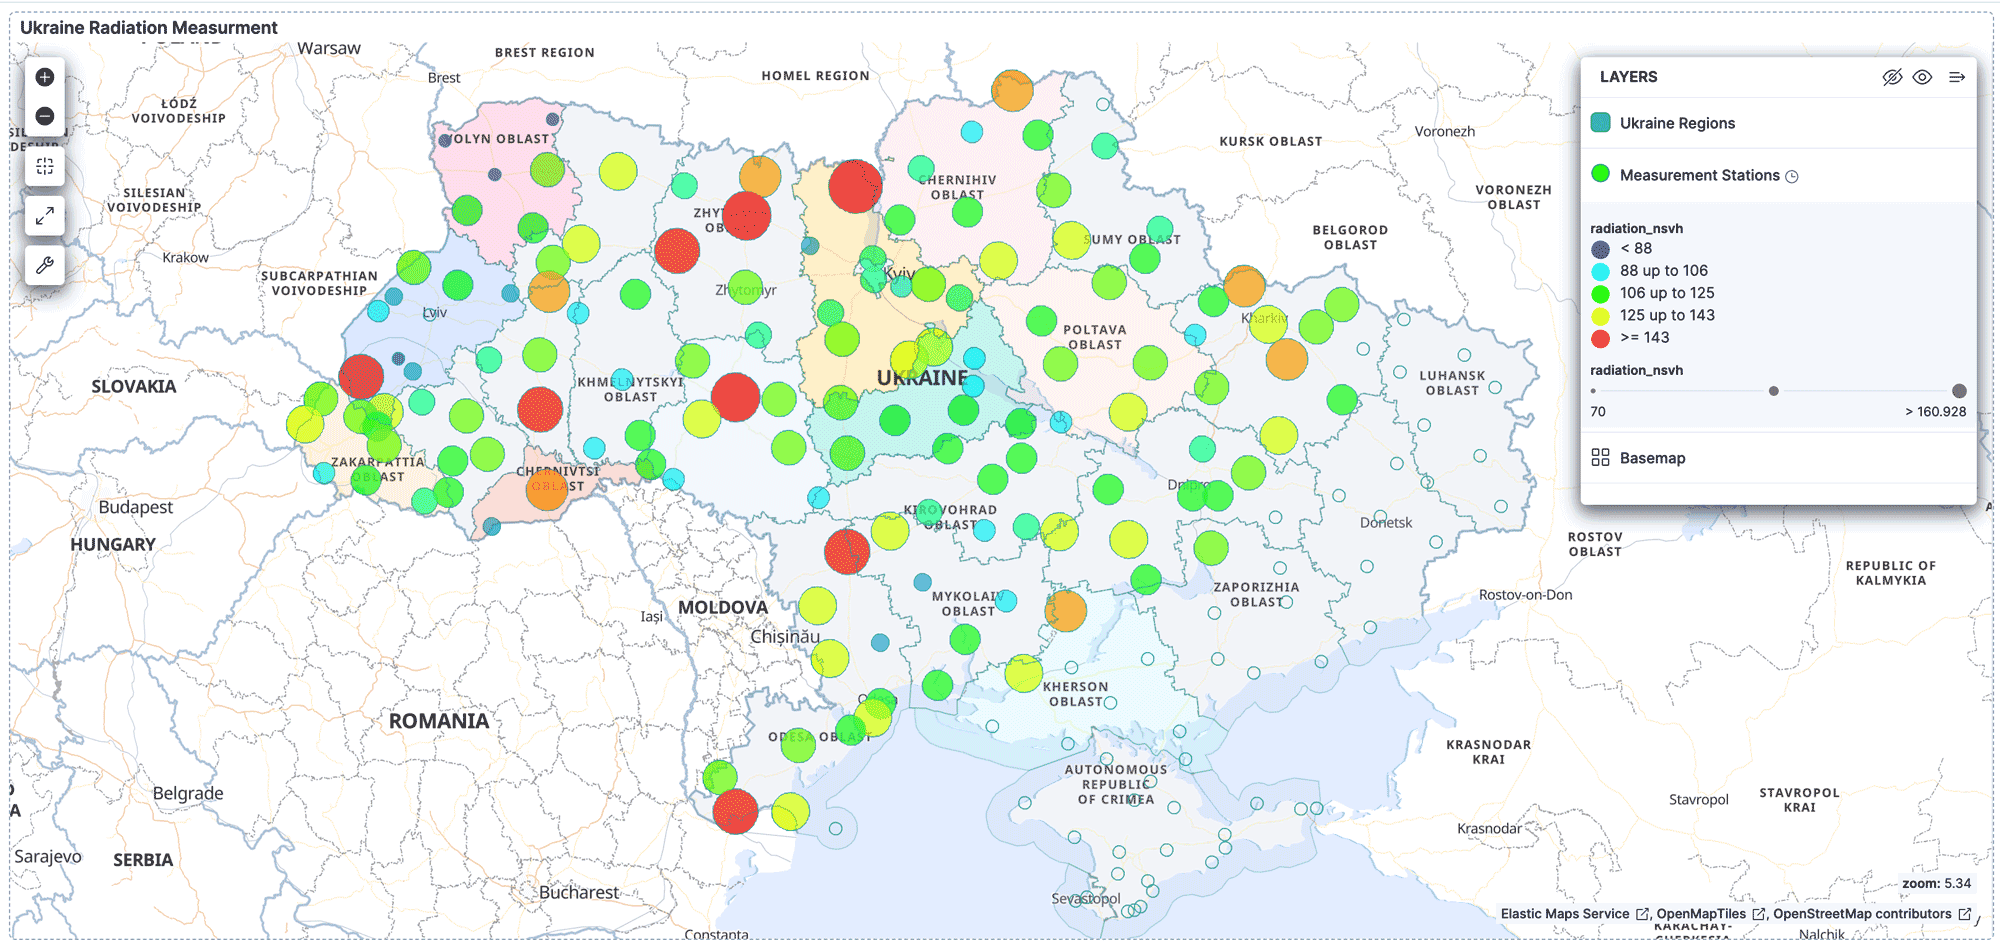
Dashboard Radiation Map
-
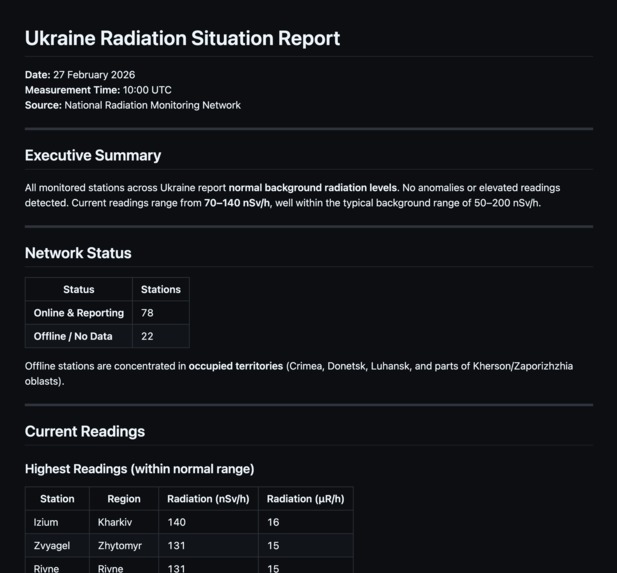
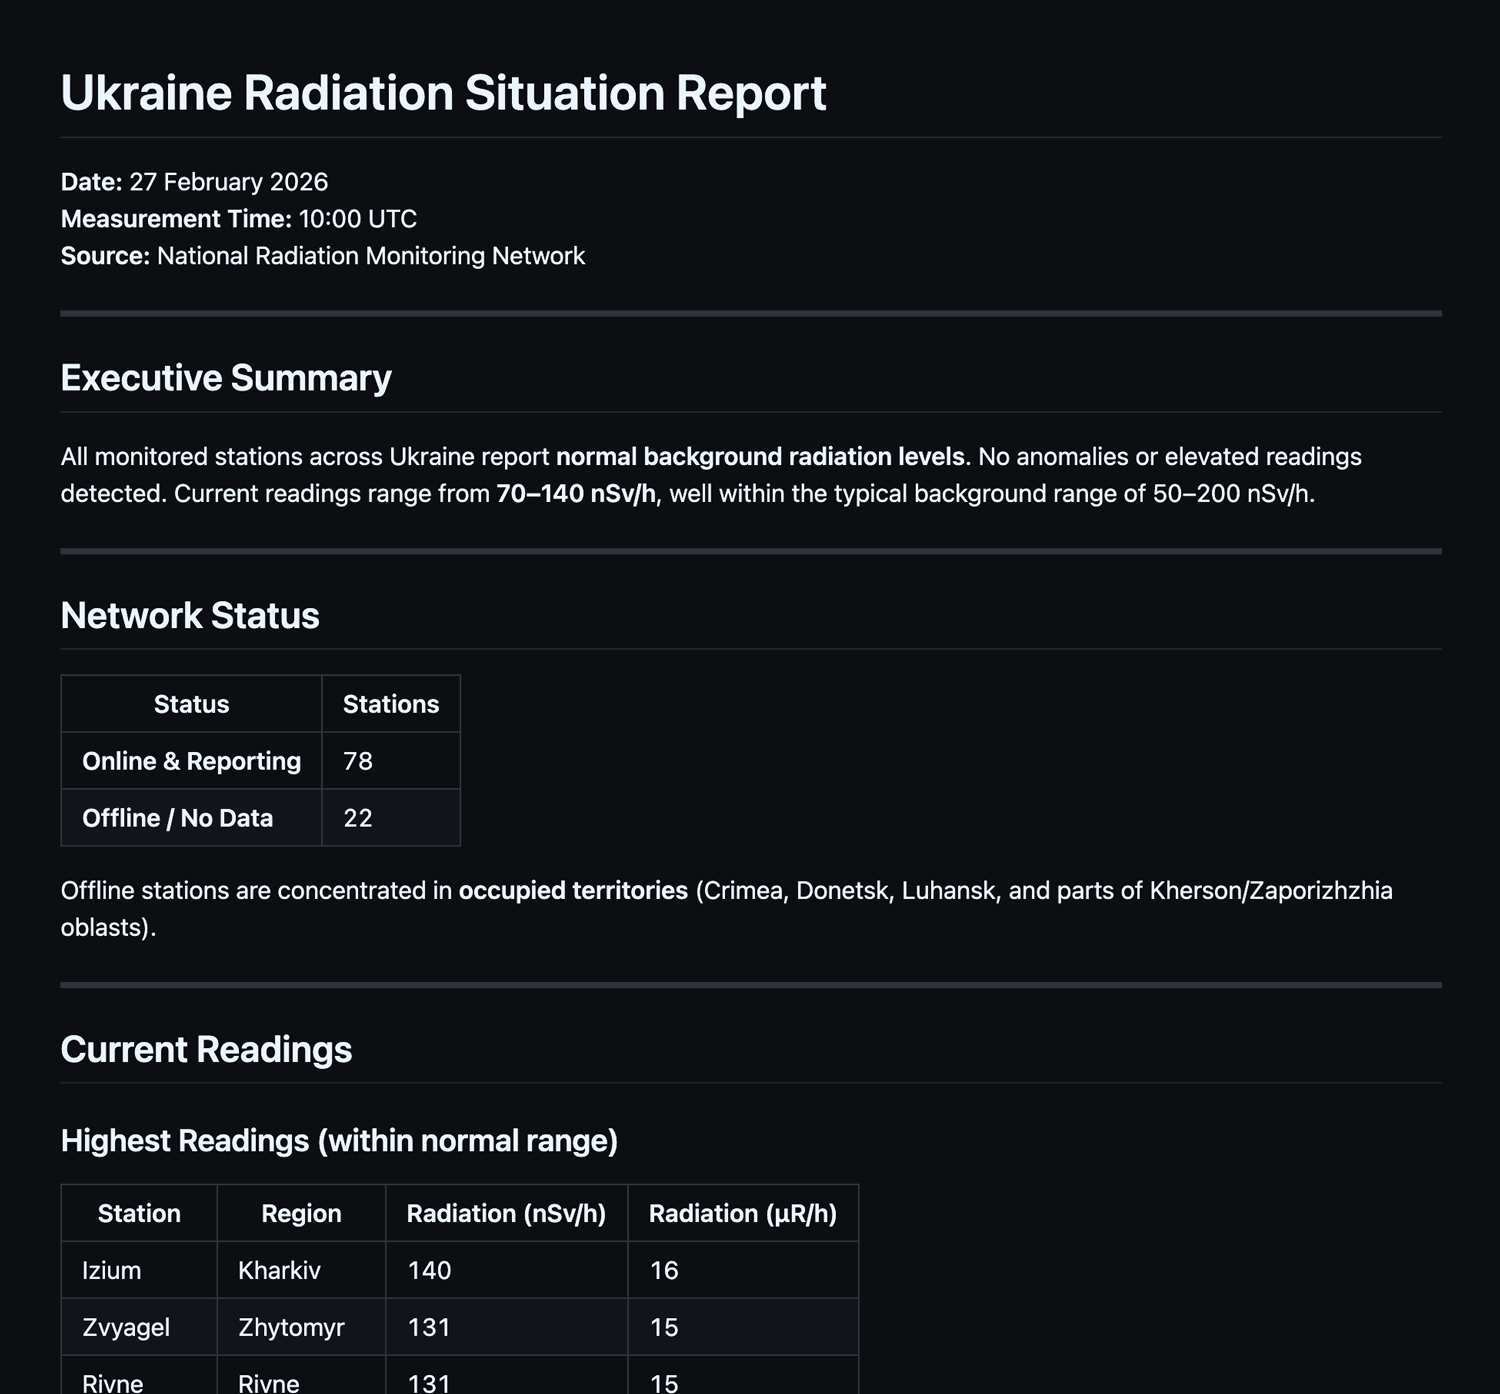
GitHub Gist published report (via Agent Builder)

☢ Ukraine Radiation Monitoring Dashboard
Inspiration
The project was inspired by the need for resilient, automated environmental monitoring in unstable conditions.
Radiation monitoring stations and meteorological stations partially overlap, some stations stop reporting due to war, and public safety requires accurate, continuously updated data.
We wanted to build a system that:
- Automatically ingests daily radiation data
- Handles missing stations gracefully
- Requires no manual joins
- Minimizes operational overhead
- Demonstrates how AI can automate data engineering workflows
The deeper inspiration was to explore how AI-driven automation can transform traditional ETL pipelines into intelligent, self-maintaining systems.
What it does
The Ukraine Radiation Monitoring Dashboard:
- Ingests three datasets:
- Meteorological stations metadata
- Radiation monitoring stations metadata
- Daily radiation measurements
- Merges them into a single denormalized time-series index
- Normalizes timestamps into ISO8601 format (Europe/Warsaw timezone)
- Preserves radiation values in both:
- ( \mu R/h )
- ( nSv/h )
- Explicitly marks stations that did not report radiation data
- Provides geospatial visualization in Kibana
- Updates automatically once per day
How we built it
We built the system using:
- Elasticsearch for time-series storage
- Kibana for map-based dashboards
- Elastic Agent Builder for full pipeline automation
- AI-assisted schema design and ingestion logic generation
Architecture Decisions
- No runtime joins (Elasticsearch is not relational)
- Full denormalization during ingestion
- Single time-series index
- Deterministic document IDs for idempotent daily rebuilds
AI Automation
AI was used to:
- Reverse-engineer undocumented fields
- Design index mappings
- Generate ingestion scripts
- Validate data overlaps
- Detect missing station scenarios
- Optimize schema for geospatial dashboards
Elastic Agent Builder orchestrates:
- Daily data pull
- Parsing of JavaScript-style source files
- Data transformation
- Merging station metadata
- Error monitoring
- Publishing daily report to GitHub Gist
The entire workflow is automated end-to-end.
Challenges we ran into
1. Non-standard Source Format
The datasets were JavaScript constants, not pure JSON.
We had to strip variable declarations before parsing.
2. Undocumented Fields
Fields such as i, o, k, z, dx, and dy required inference and pattern matching.
We deduced that i represents the WMO station identifier used as the primary key.
3. Partial Data Overlap
Not all stations report daily measurements.
We found:
- Radiation stations without daily data (war impact)
- A weather station with no radiation counterpart
- Inconsistent overlap between datasets
Instead of ignoring them, we explicitly modeled missing radiation data.
4. Avoiding Elasticsearch Anti-Patterns
We avoided:
- Runtime joins
- Daily index explosion
- Unnecessary staging indices
- Overcomplicated enrichment pipelines
Design simplicity required discipline.
Accomplishments that we're proud of
- Designed a fully denormalized, geo-enabled time-series architecture
- Achieved zero runtime joins
- Built a fully automated daily ingestion pipeline
- Preserved measurement unit integrity
- Explicitly modeled operational gaps
- Used AI as an architectural co-pilot, not just a code generator
- Created a scalable design ready for production growth
Most importantly:
We demonstrated that AI can meaningfully assist in system design, not just scripting.
What we learned
- Elasticsearch works best when data is pre-joined.
- Time normalization and timezone handling are critical.
- Modeling missing data explicitly improves dashboard clarity.
- Low-volume systems benefit from simplicity over sophistication.
- AI dramatically accelerates architecture iteration.
- Elastic Agent Builder enables repeatable, reliable automation.
- Elastic Agent Builder can act as "reasoning" brain
We also learned that AI is most powerful when used interactively — refining assumptions, validating schema choices, and stress-testing architectural decisions.
What's next for Ukraine Radiation Monitoring Dashboard
- Historical backfill of radiation measurements
- Automated anomaly detection using ML
- Threshold-based alerting for abnormal radiation levels
- Integration with weather correlation analysis (sunny weather means higher values)
- Public transparency dashboard
- Expansion to multi-country monitoring
- Advanced AI-driven data quality validation
The next evolution is moving from visualization to predictive environmental intelligence, powered by AI and automated by Elastic Agent Builder.


Log in or sign up for Devpost to join the conversation.