-
-
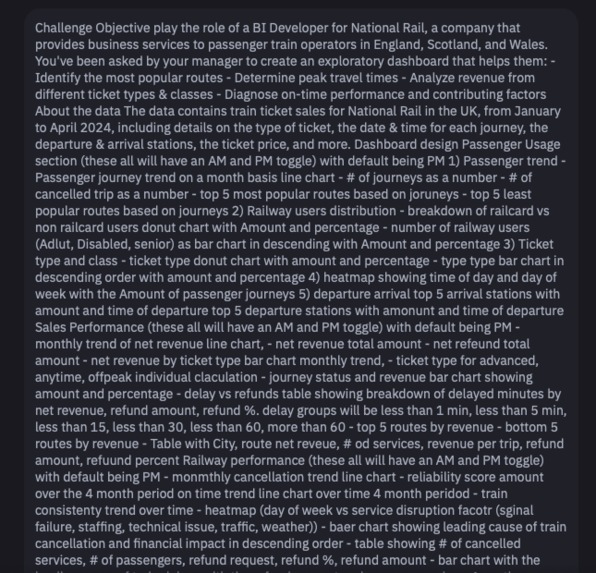
Thread Agent Prompt
-
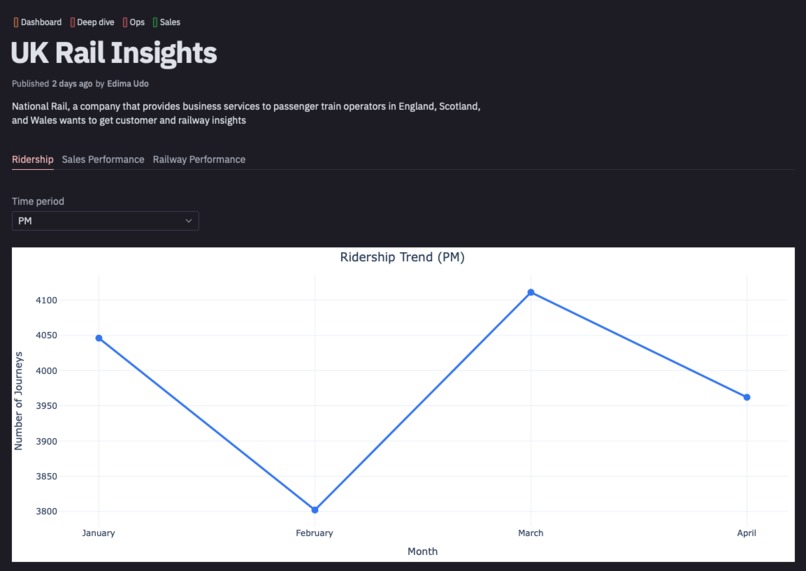
Ridership
-
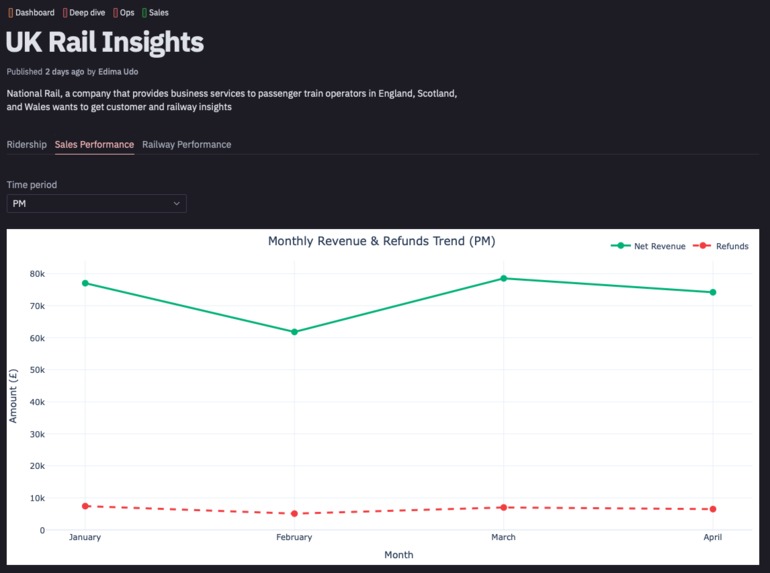
Sales Performance
-
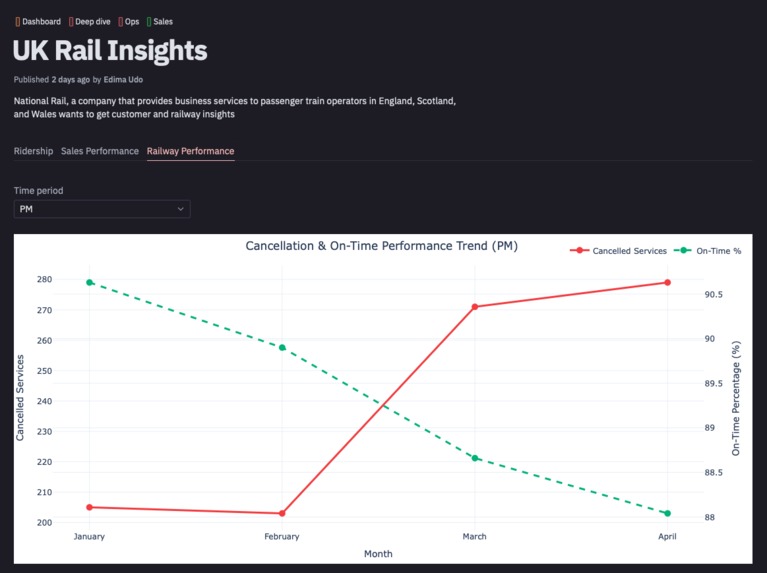
Rail Performance


Inspiration
The goal was to leverage the Hex analytics stack to analyze UK rail data
What it does
The app analyzes UK rail data to understand Ridership, Sales Performance and Rail Performance. It uses the Hex thread agent to start the analysis. I then built out more of the analysis and app visuals using python.
How we built it
The app was built using the Hex platform. In the platform itself it used a mix of SQL, python, different python libraries for analytics and visualization. I provided the rail dataset with an accompanying data dictionary.
Key Insights for PM Period
- Ridership:
- March had the highest ridership while Feb was the lowest
- Most popular route is London Euston - Birmingham New street
- Least popular route is London Paddington to Liverpool Lime
- Most common ticket type are Standard and Advanced tickets
- 2/3 of passengers do not use a railcard and adult railcard users are the most popular railcard holders
- busiest time period is between 4 and 6pm with Tuesday and Wednesday being the busiest
- Sales performance:
- Monthly revenue peaked in March
- Standard ticket type accounted for the largest share of revenue
- Cancellations less than 30 mins had the largest impact on revenue
- Railway performance:
- On time performance has been trending downwards since January and cancelled services has been trending upwards since February
- The leading cause of delays by a wide margin is Technical issue
- biggest cause of service disruption has been signal failure. Happens a lot of Tuesdays ## Challenges we ran into
- One challenge was exploring the different aspects of the Hex platform. It is quite expansive and has lots of ways to do analytics. You can dive right into doing your analysis with your own dataset or import from snowflake or another external datasource. So had to know which approach would be best for my project. I went with importing my own dataset for this challenge.
- Another major challenge was knowing what questions to ask when leveraging the thread or notebook agent. Since you could go with a simple prompt or something deeper. My approach was to use the agent to answer more direct questions which I provided with plotly visualizations. I would then tweak the design and add my own analysis as well. To me this is the best of both worlds ## Accomplishments that we're proud of
- Ability to go from analysis to app that a user can use in a short period of time using the Hex platform ## What we learned
- Loved the approach to analytics leveraging LLMs but still giving the end user the ability to write python, SQL and hopefully R
- Great experience learning how to use the hex platform in terms of the widgets and visualizations tools ## What's next for UK Railway Insights
- Potentially add the ability to know when a train will be late
- Improve the UX of the app
- Provide a visual map of train routes

Log in or sign up for Devpost to join the conversation.