-
-
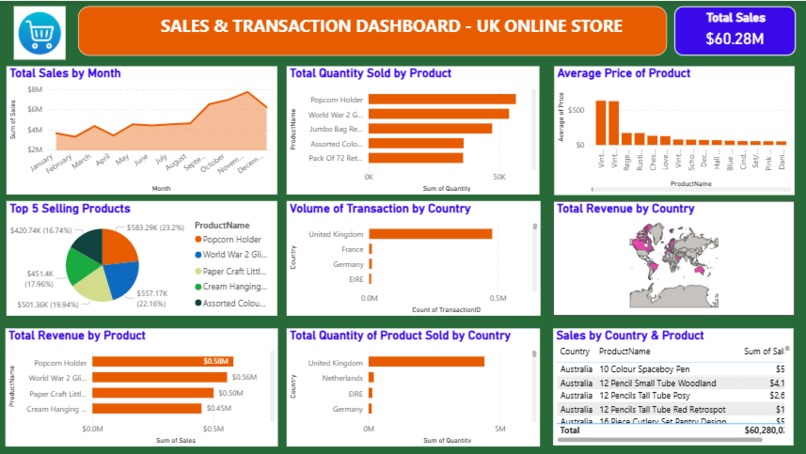
UK Online Store 1
-
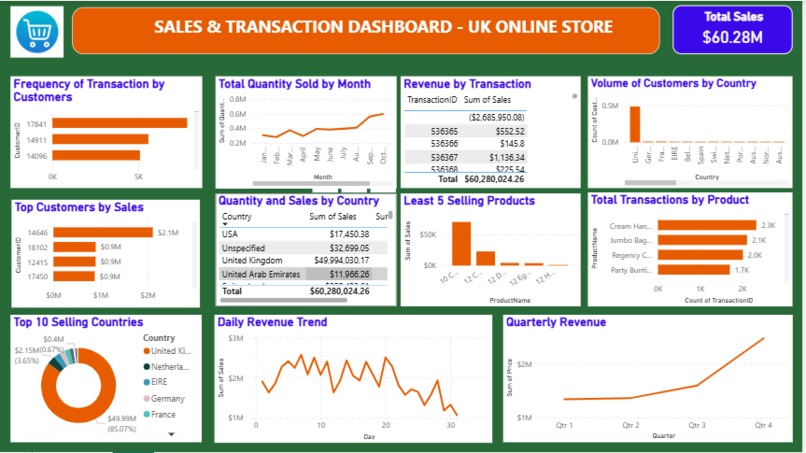
UK Online Store 2


Inspiration
In today’s data-driven economy, information is one of the most valuable assets a business can possess. With digital transactions growing rapidly, I was inspired to use data analysis as a tool to uncover hidden trends that can drive business success. My goal was to transform raw sales data into actionable insights that could help an online retailer identify performance patterns, optimize strategies, and boost profitability
What it does
My analysis addressed the challenge of converting raw sales data into clear, actionable insights. It identified key trends, the best-performing products, profitable customer segments, and geographic sales drivers, enabling informed decisions to boost sales and optimize strategies.
How we built it
Using Power BI, I began by cleaning and transforming the data to ensure consistency in dates, products, and customer records. I created relationships between tables, used DAX formulas to compute KPIs like total sales, and built multiple interactive visualizations. My dashboard was designed to answer key business questions: • What’s the monthly sales trend? • Which products sell the most? • Who are the most profitable customers? • Which countries generate the highest revenue? Each chart and metric was tailored to guide decision-makers through trends, top performers, and gaps.
Challenges we ran into
• Data Quality Issues: Missing values and inconsistent product descriptions required careful cleaning. • Performance Slowdowns: Large dataset size initially made Power BI visuals lag. I optimized the model by reducing unnecessary columns and using summarized tables. • Lack of Built-in World Map: Power BI did not include a detailed world map by default, which posed a challenge for geographic analysis. To overcome this, I had to download a custom world map visual and import it into Power BI to accurately display country-level sales data.
Accomplishments that we're proud of
• Built a fully interactive sales dashboard that clearly visualizes key business metrics and trends. • Identified top products, customers, and countries contributing most to revenue, supporting data-driven strategy. • Uncovered hidden patterns like mid-month sales drops, offering new areas for business improvement. • Applied DAX and data modeling skills to create meaningful KPIs and enhance reporting accuracy. • Turned raw transactional data into business value, empowering better decision-making through insights.
What we learned
This project deepened my skills in: • Data modeling and transformation in Power BI • DAX formula creation for meaningful KPIs • Designing dashboards with storytelling in mind • Connecting business goals with visual insights It also reinforced how simple metrics like “most purchased” or “monthly trend” can lead to powerful decisions when viewed in the right context.
What's next for UK Online Store Analysis
To build on the current insights and drive even more value
Built With
- bi
- power

Log in or sign up for Devpost to join the conversation.