Inspiration
Rapid urbanization is making cities hotter each year due to dense concrete structures, reduced green cover, and increasing population density. Rising urban heat affects public health, energy consumption, and overall quality of life. We were inspired to build a solution that transforms climate data into meaningful insights, enabling smarter decisions for sustainable and climate-resilient cities.
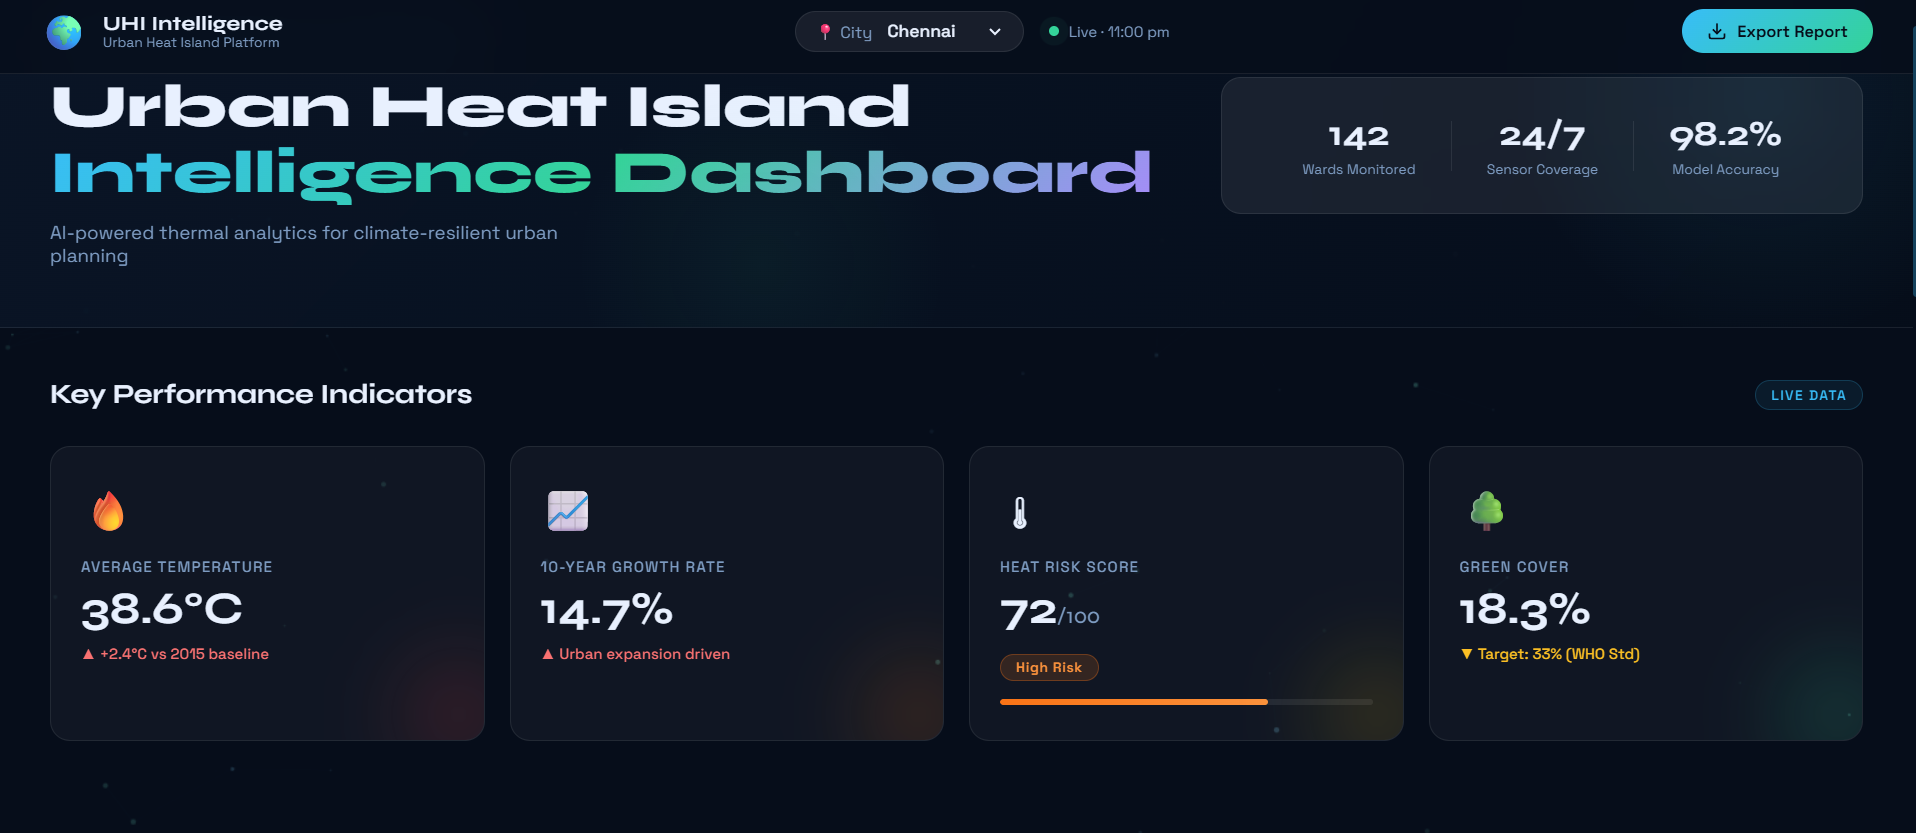
What it does
UH (Urban Heat) Intelligence Platform is an AI-powered dashboard that analyzes urban temperature patterns and identifies high-heat zones within a city. It visualizes heat hotspots, tracks long-term temperature trends, and predicts future heat intensity using machine learning. The platform also generates a Heat Risk Score and recommends targeted interventions such as tree plantation zones and cool roof implementation areas.
How we built it
We built UH using HTML, CSS, and JavaScript for a responsive and visually engaging frontend dashboard. Interactive heatmaps were developed using Leaflet.js, and data visualizations were implemented with Chart.js. Environmental indicators such as temperature trends, vegetation index, built-up density, and population density were modeled into a composite Heat Risk Score. A machine learning model was structured to simulate 5-year heat predictions based on these parameters.
Challenges we ran into
One of the biggest challenges was obtaining reliable ward-level environmental datasets. Integrating multiple indicators into a single risk score required careful normalization and logical weighting. Designing an interface that presents complex climate data in a simple, intuitive format without overwhelming users was also a significant challenge.
Accomplishments that we're proud of
We successfully created a visually compelling and interactive climate dashboard that translates raw environmental data into actionable insights. The integration of predictive analytics with real-time visualization demonstrates a scalable framework suitable for smart city applications. The recommendation engine adds practical value beyond mere data display.
What we learned
Through this project, we learned how to combine environmental data analytics with user-centered design. We gained experience in structuring climate indicators into predictive models, designing scalable dashboard architectures, and presenting technical insights in a clear, impactful way. Most importantly, we understood how technology can be leveraged to address real-world sustainability challenges.


Log in or sign up for Devpost to join the conversation.