Inspiration
Climate change is an issue our generation is all too familiar with. Now, the disastrous consequences of the future have become our present. This summer, seasonal rains in Pakistan spiraled into extreme flooding, covering 1/3 of the country and displacing 1/6 of the population. Often, tragedies like this must compete against mainstream news and it's easy to lose sight of the humanity behind the statistics. Through Flood is Thicker than Water, we aim to remove this separation and better capture the devastating impact of the floods.
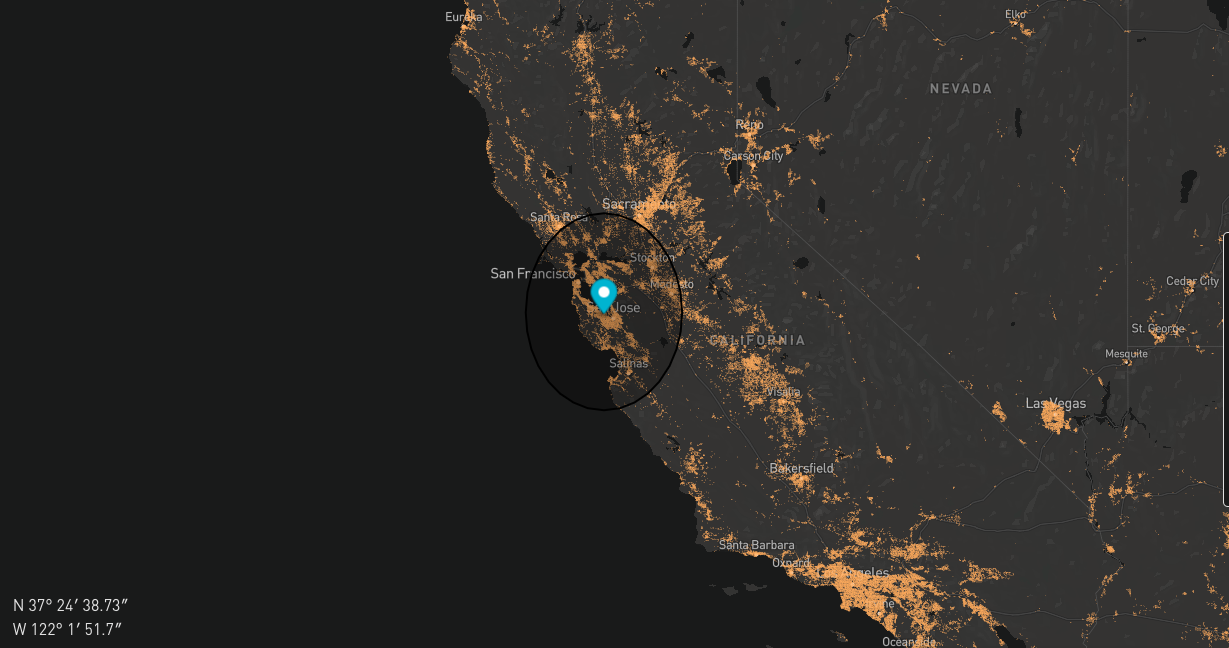
What it does
Flood is Thicker than Water is a data visualization tool built around damage from potential floods. Users may select a location and observe the size and effects of these floods. The program provides five statistics for a selected area:
Square Mileage Flooded
Number of People Affected
Number of People Displaced
Number of People currently in Shelters
Total Fatalities
All statistics are modeled off of the effects of the Pakistani floods and their affect/displacement rate.
How we built it
Our website front-end was built using the Svelte framework and TypeScript. Our map feature was powered by Mapbox. Additionally, we used Figma for UI design and UX optimization.
Challenges we ran into
Svelte was a new framework to almost all of us: only one person on our team had actually built a full project with it. It was at first difficult for some of us who were more used to classic HTML and JS to pick up concepts of reactivity and hooks.
Mapbox was also not easy to work with. None of us had even heard of Mapbox before starting, let alone use it in a 24-hour project. The Mapbox team was effectively forced to learn the entire system in less than a day to get the app working.
Mapbox's questionable documentation didn't help with this either. It tended to have misleading descriptions for methods, which lead to incorrect use cases that were hard to pinpoint. We spent 4 hours trying to solve a bug due to a function being documented incorrectly.
Accomplishments and what we've learned
Despite what was said about Svelte earlier, I feel like we all learned very quickly. By the time the sun set, we could all write Svelte like we'd been doing it for years. Some of our members didn't have much experience with Git and Github collaboratively before this hackathon, and this project really helped practice those skills.
What's next for Flood is Thicker than Water
Our original ideas were extremely ambitious. We wanted to do so much with the flooding projections onto the Maps, including more accurately shaped flood models, factoring in altitude, infrastructure damage, demographics of people affected, and more! Unfortunately, we were unable to complete all of these in the short timespan, but there's always the future!
Built With
- figma
- mapbox
- svelte
- typescript


Log in or sign up for Devpost to join the conversation.