-
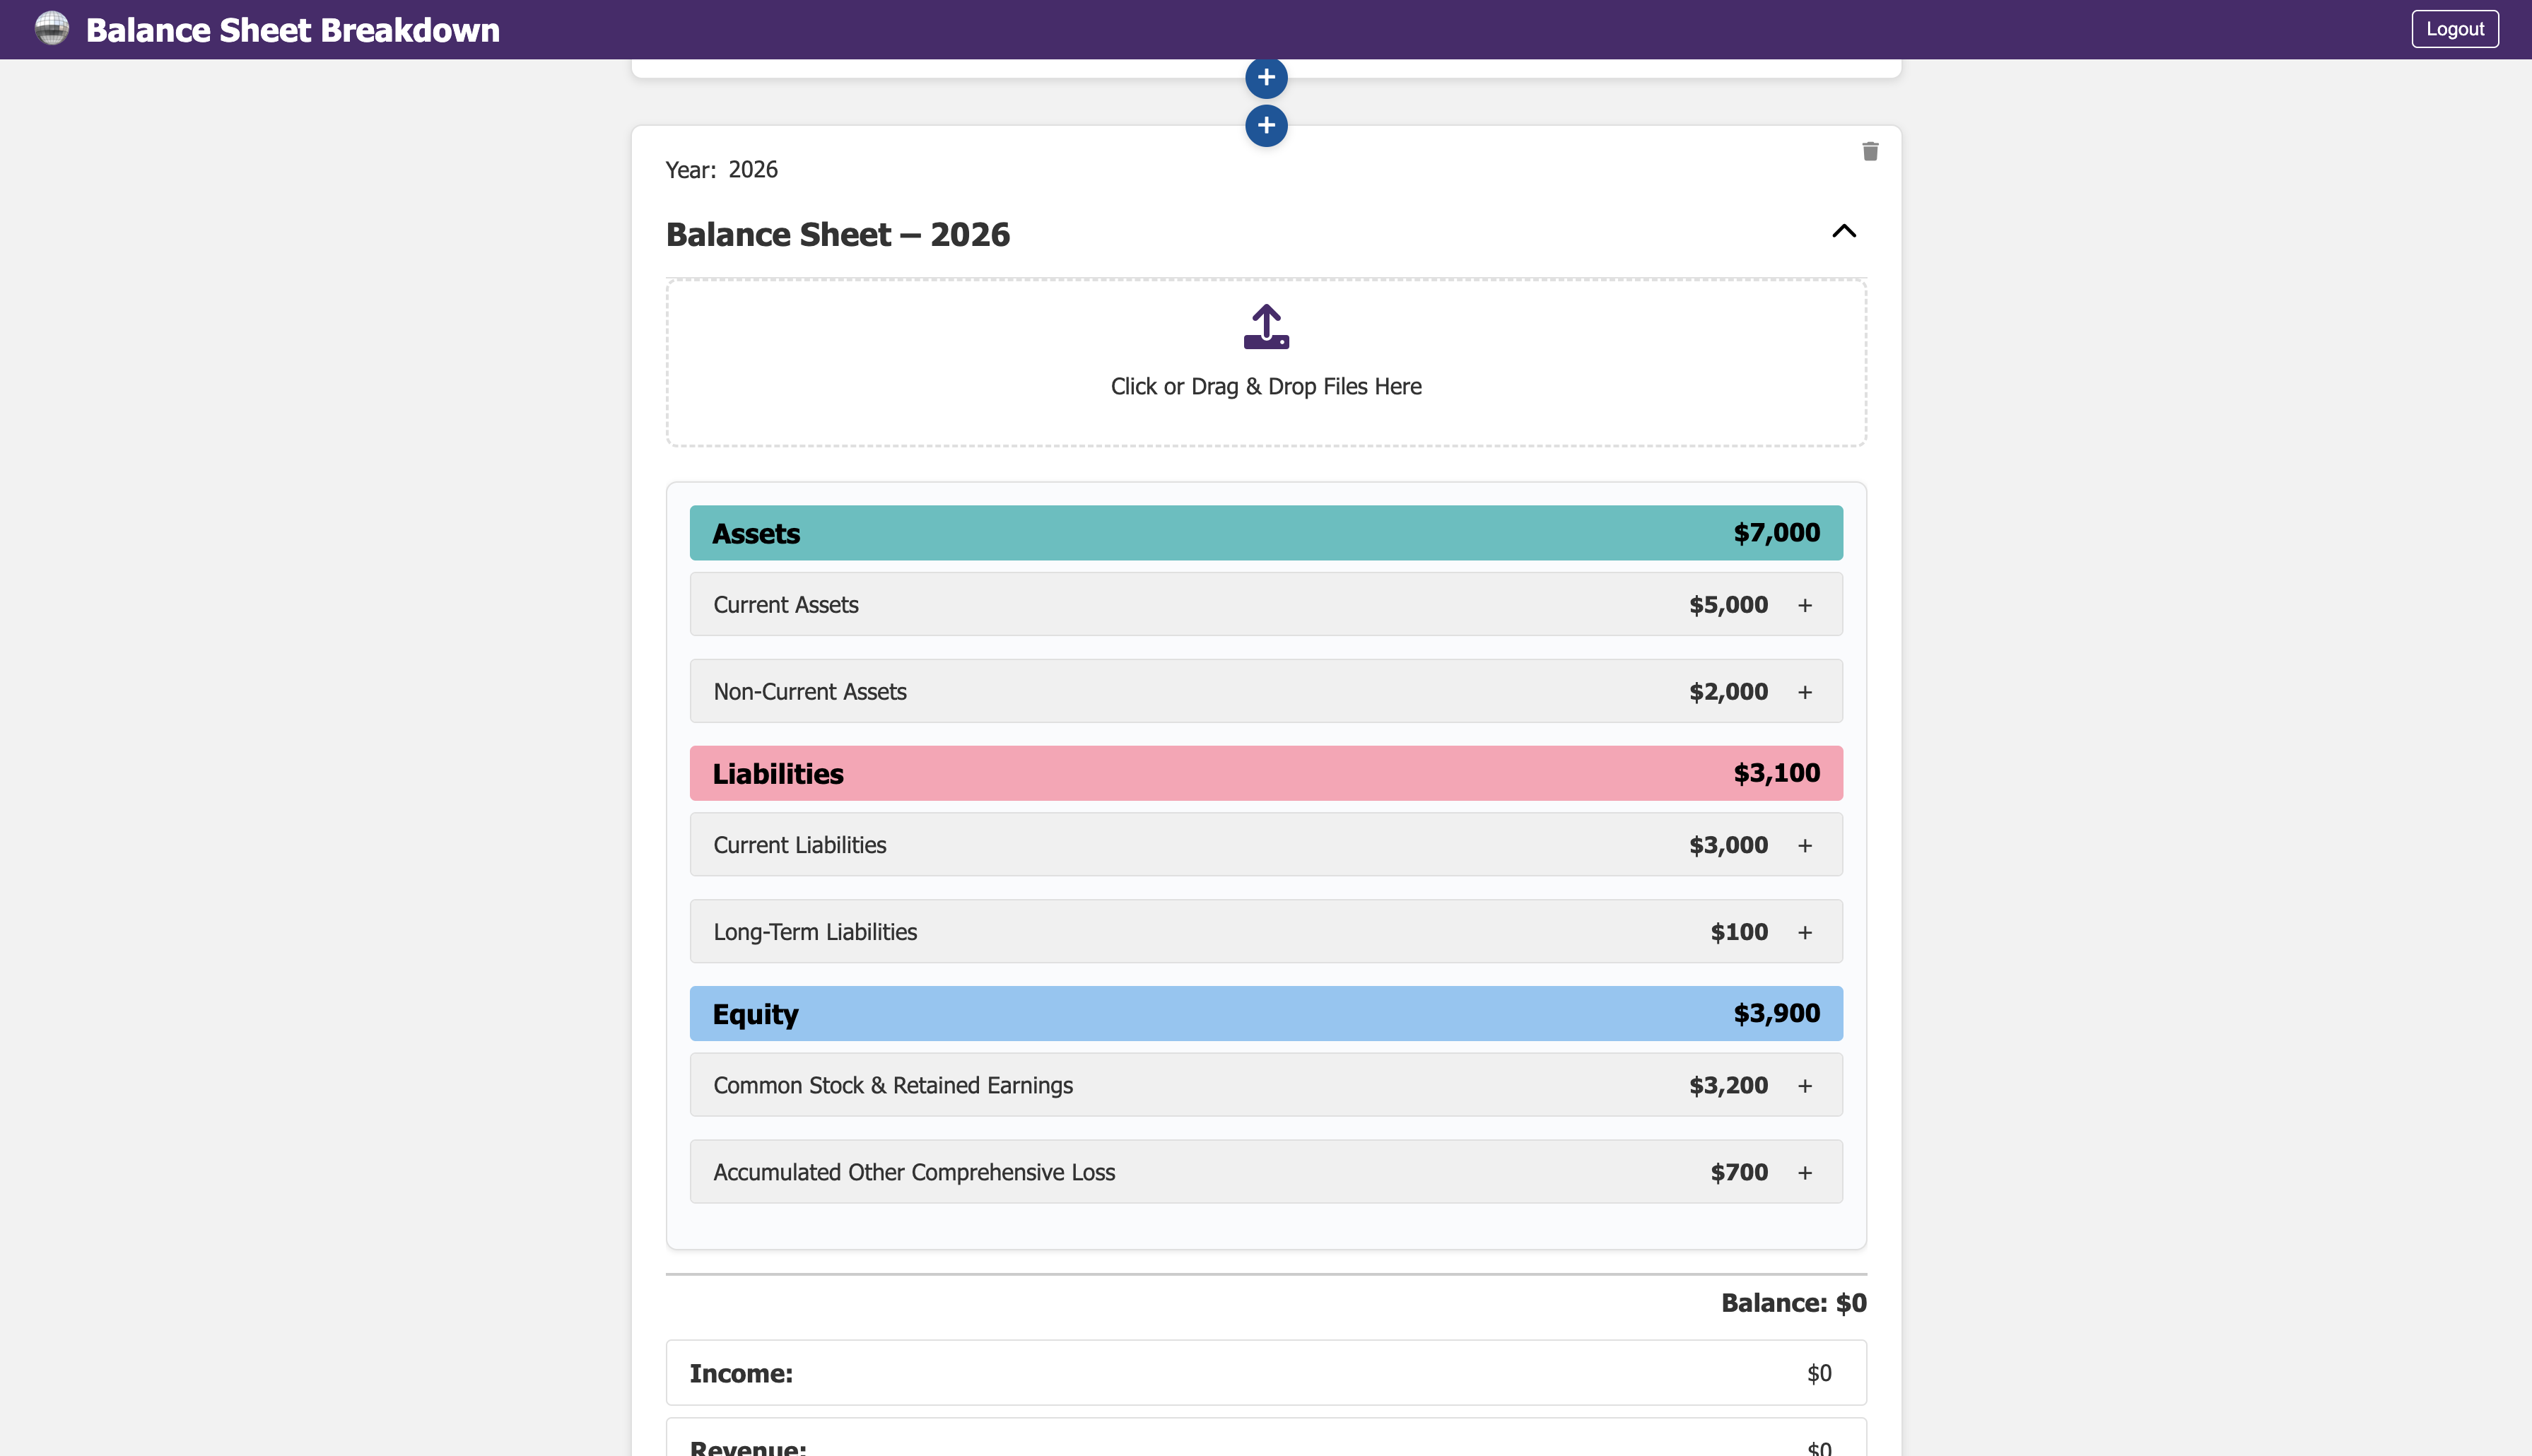
dashboard
-
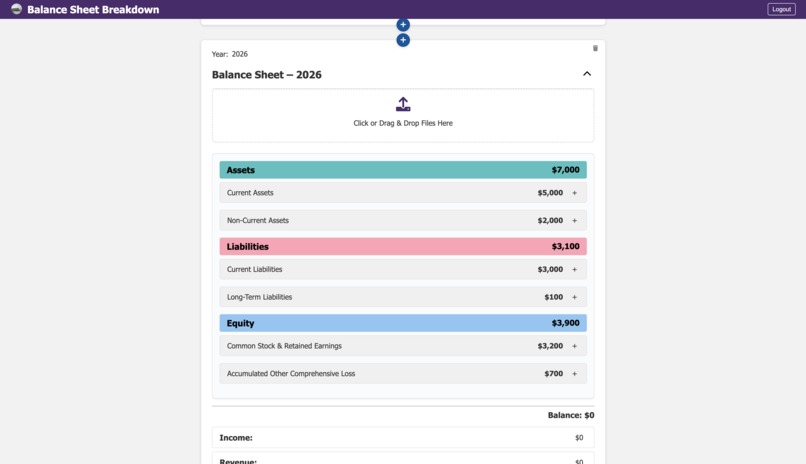
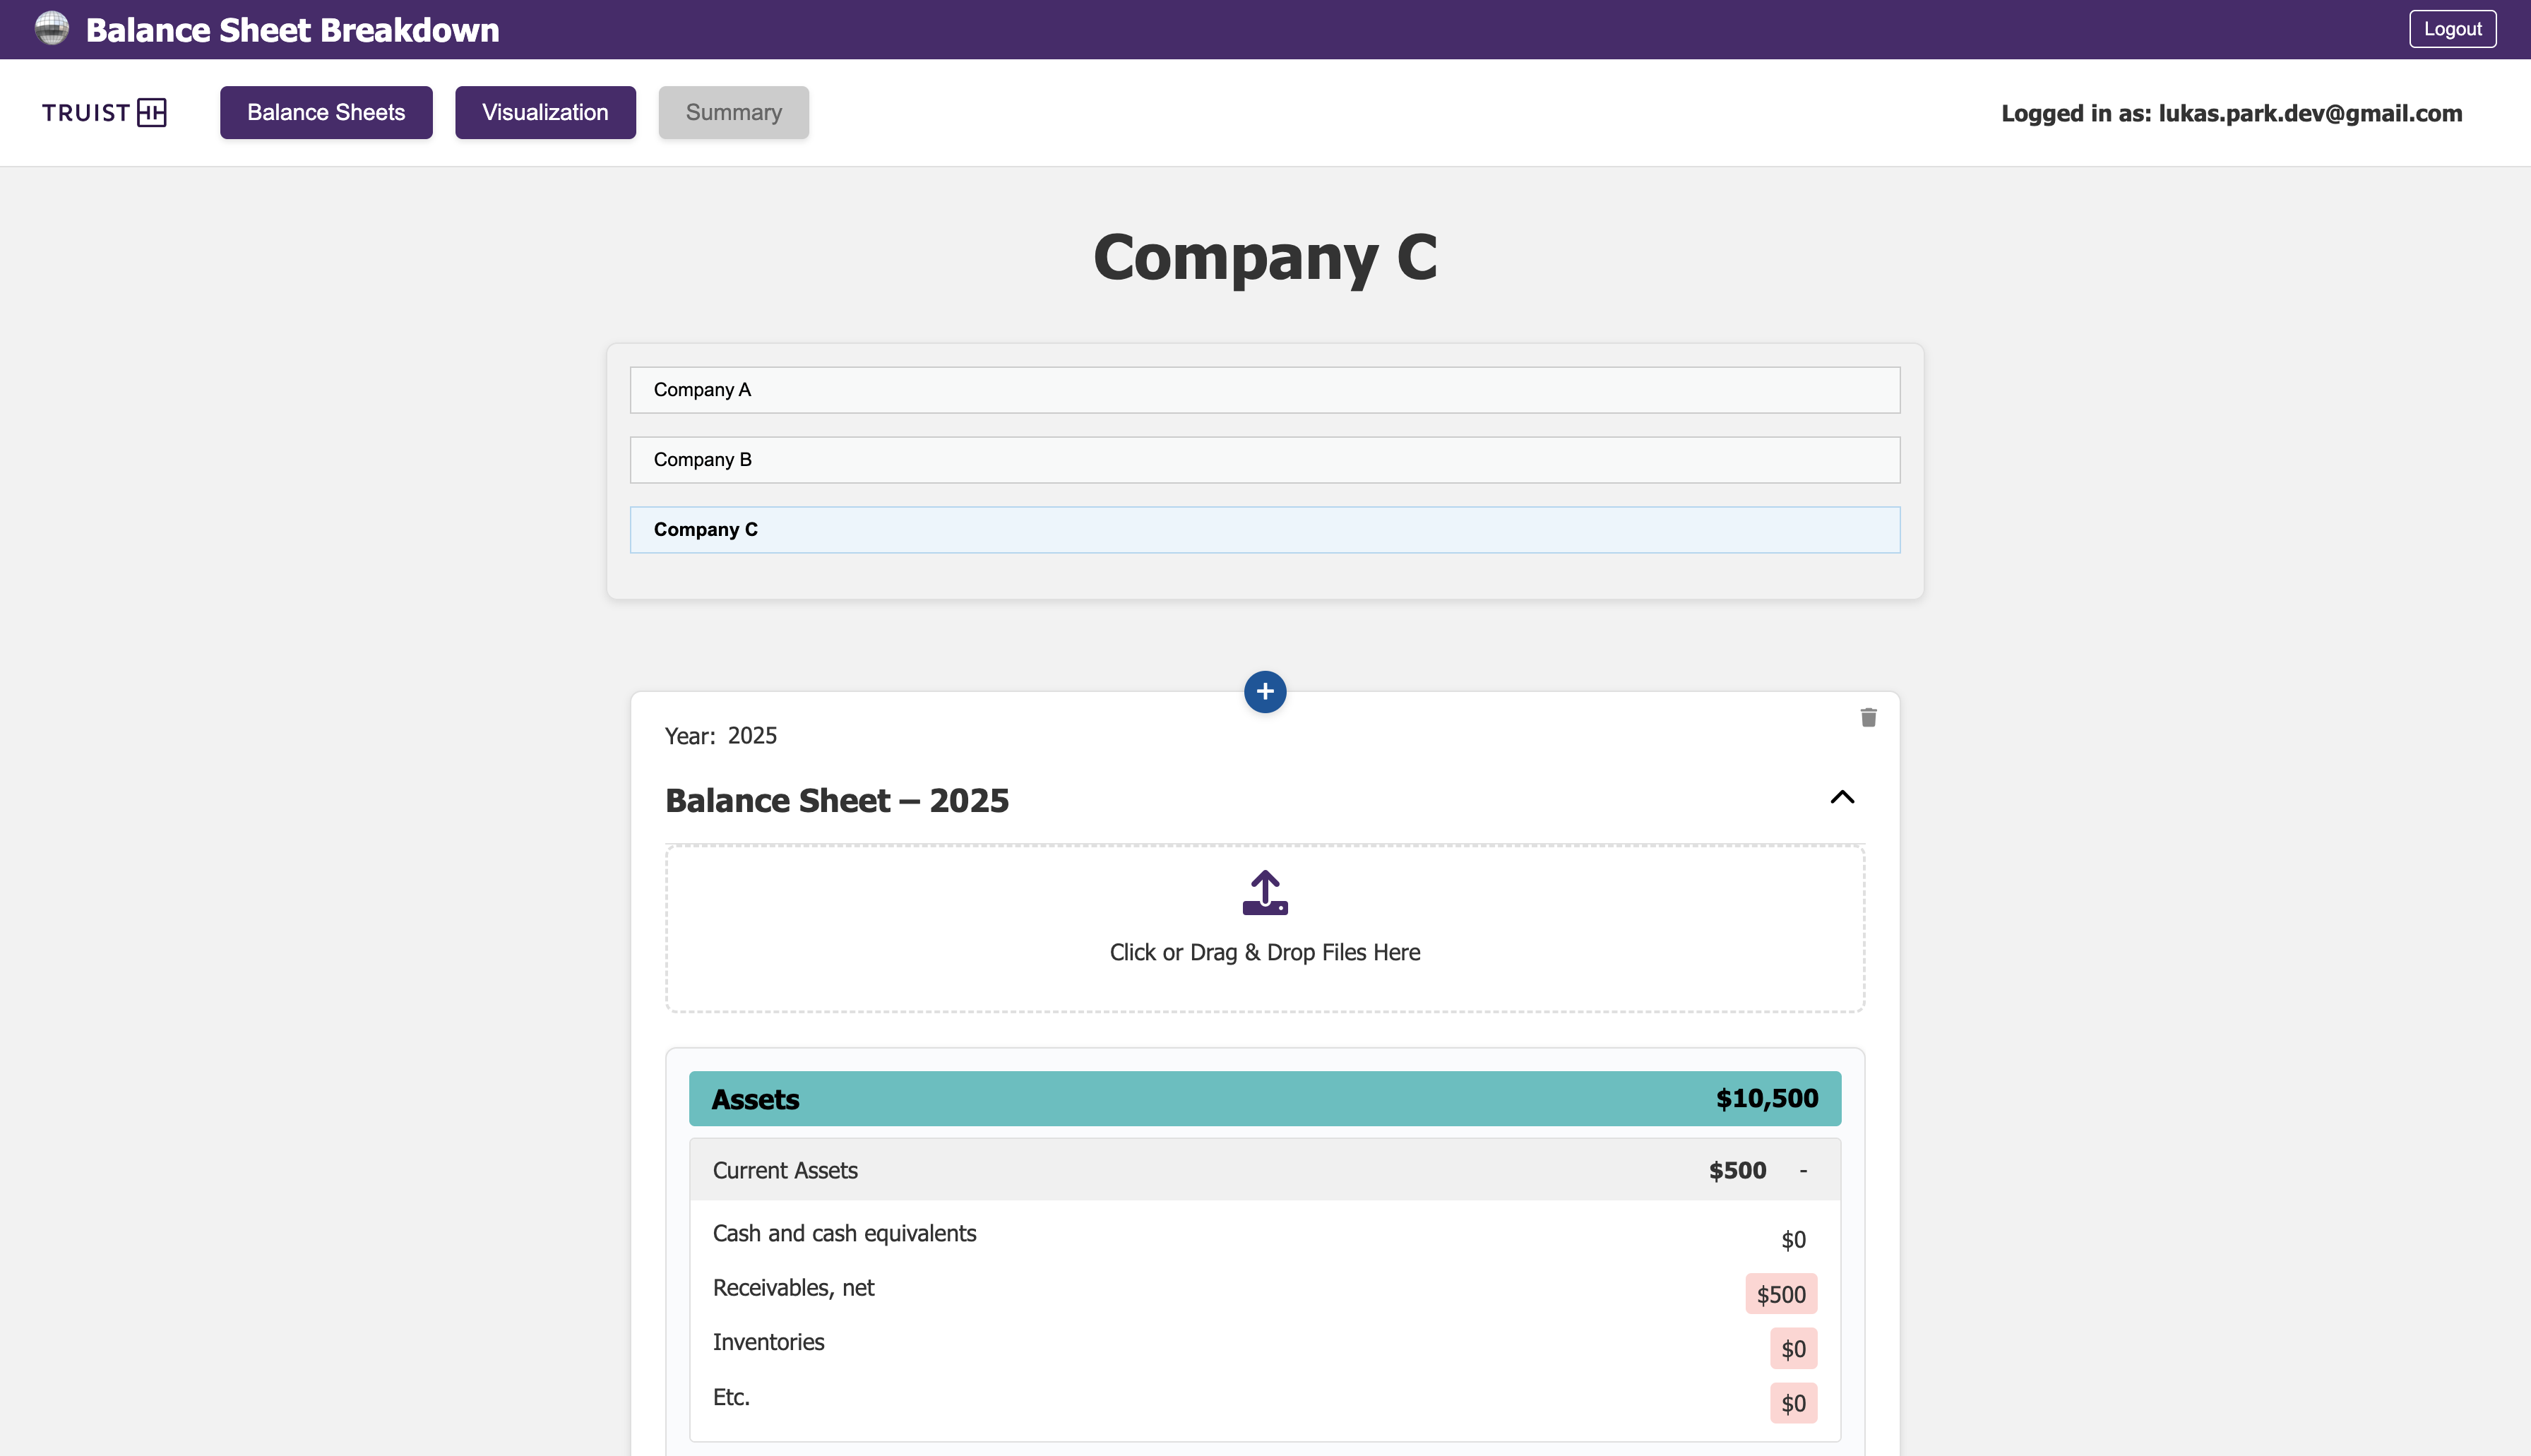
data input (both AI-powered parsing and manual inputs)
-
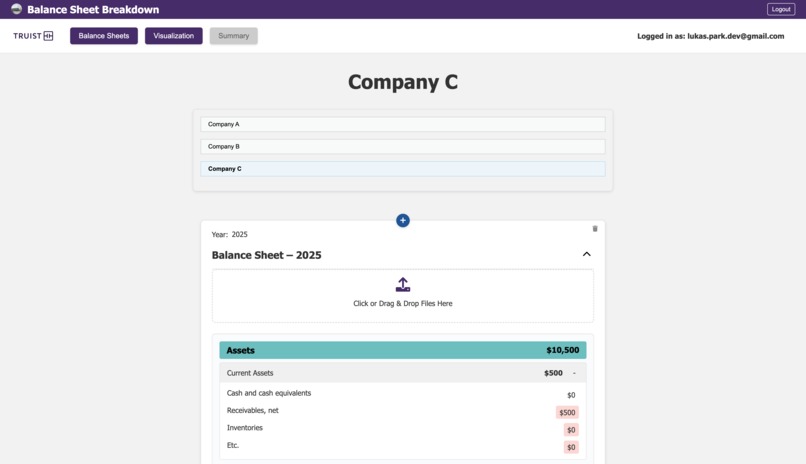
a number of data input available
-

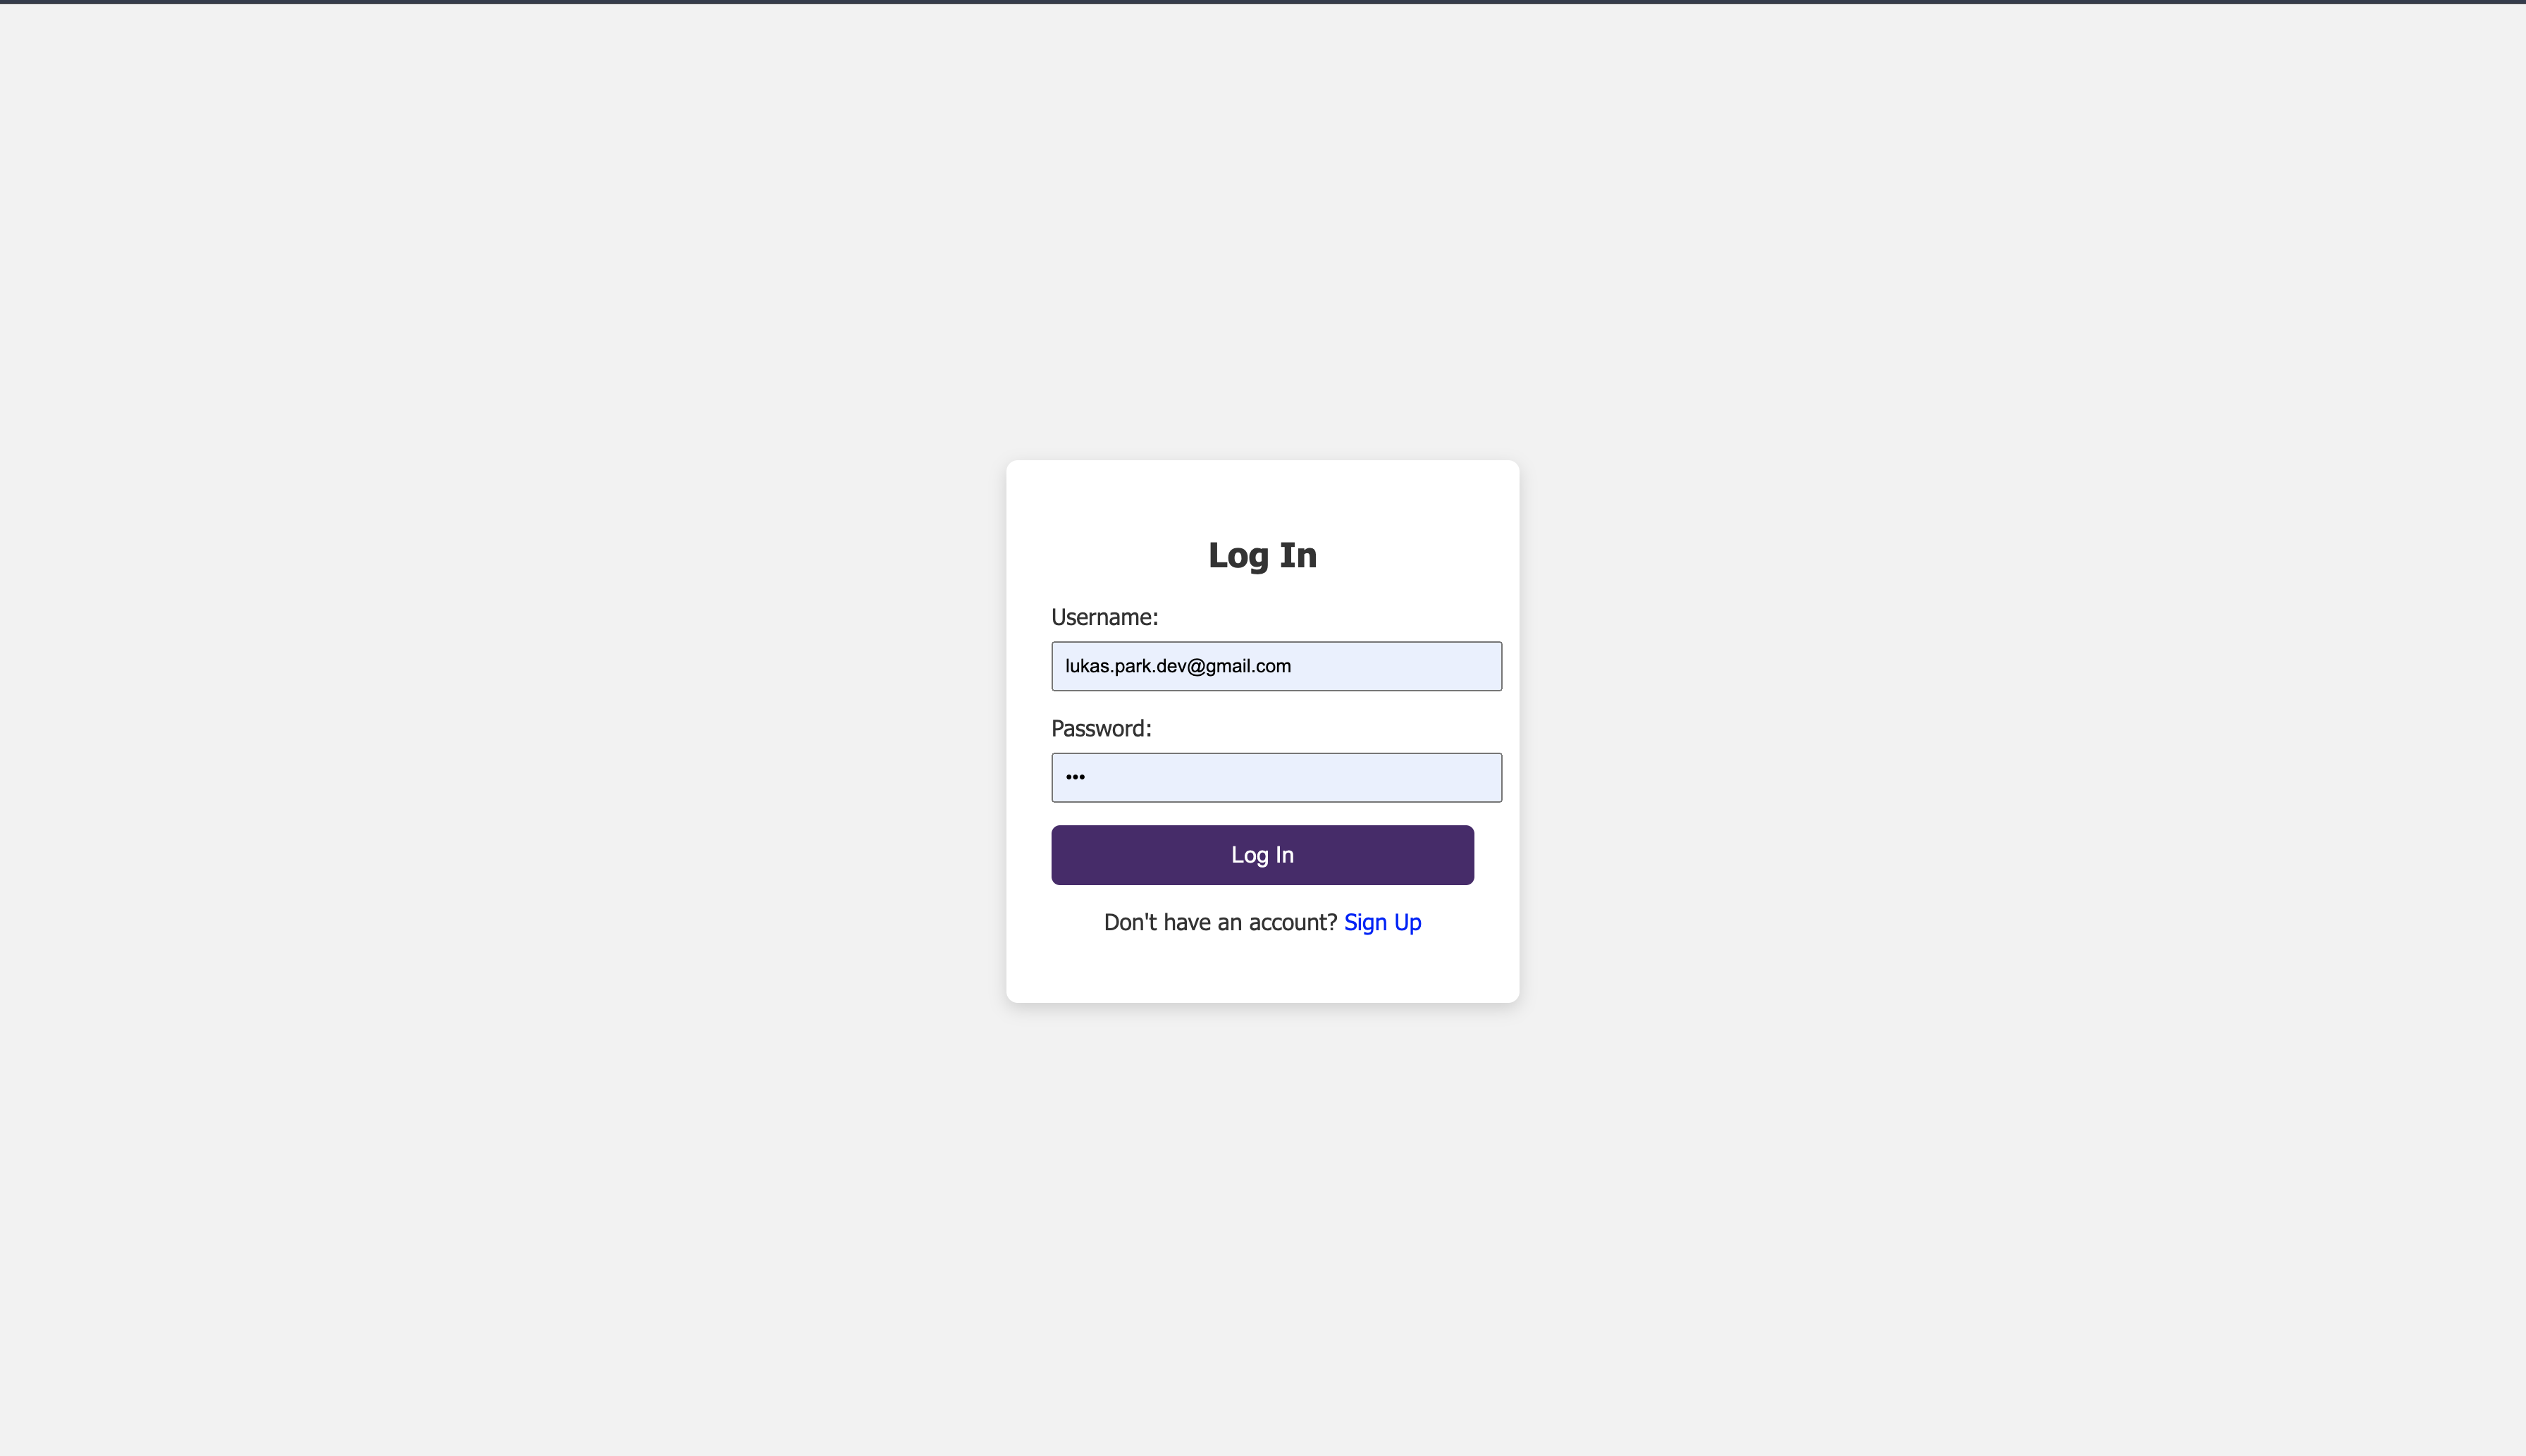
login/signup
-
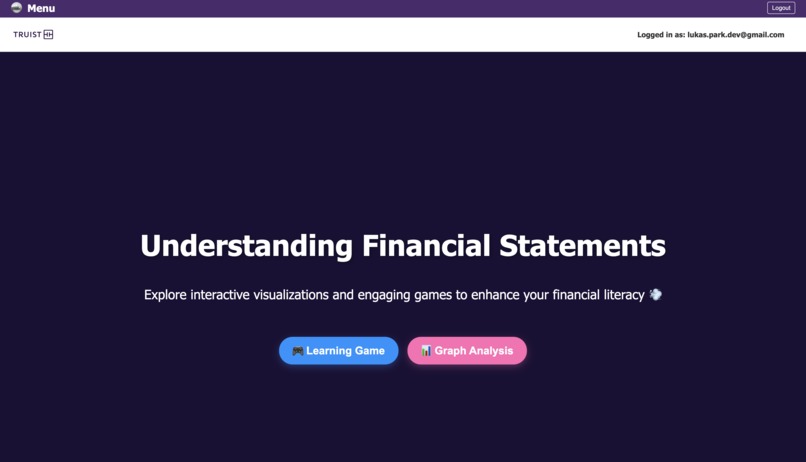
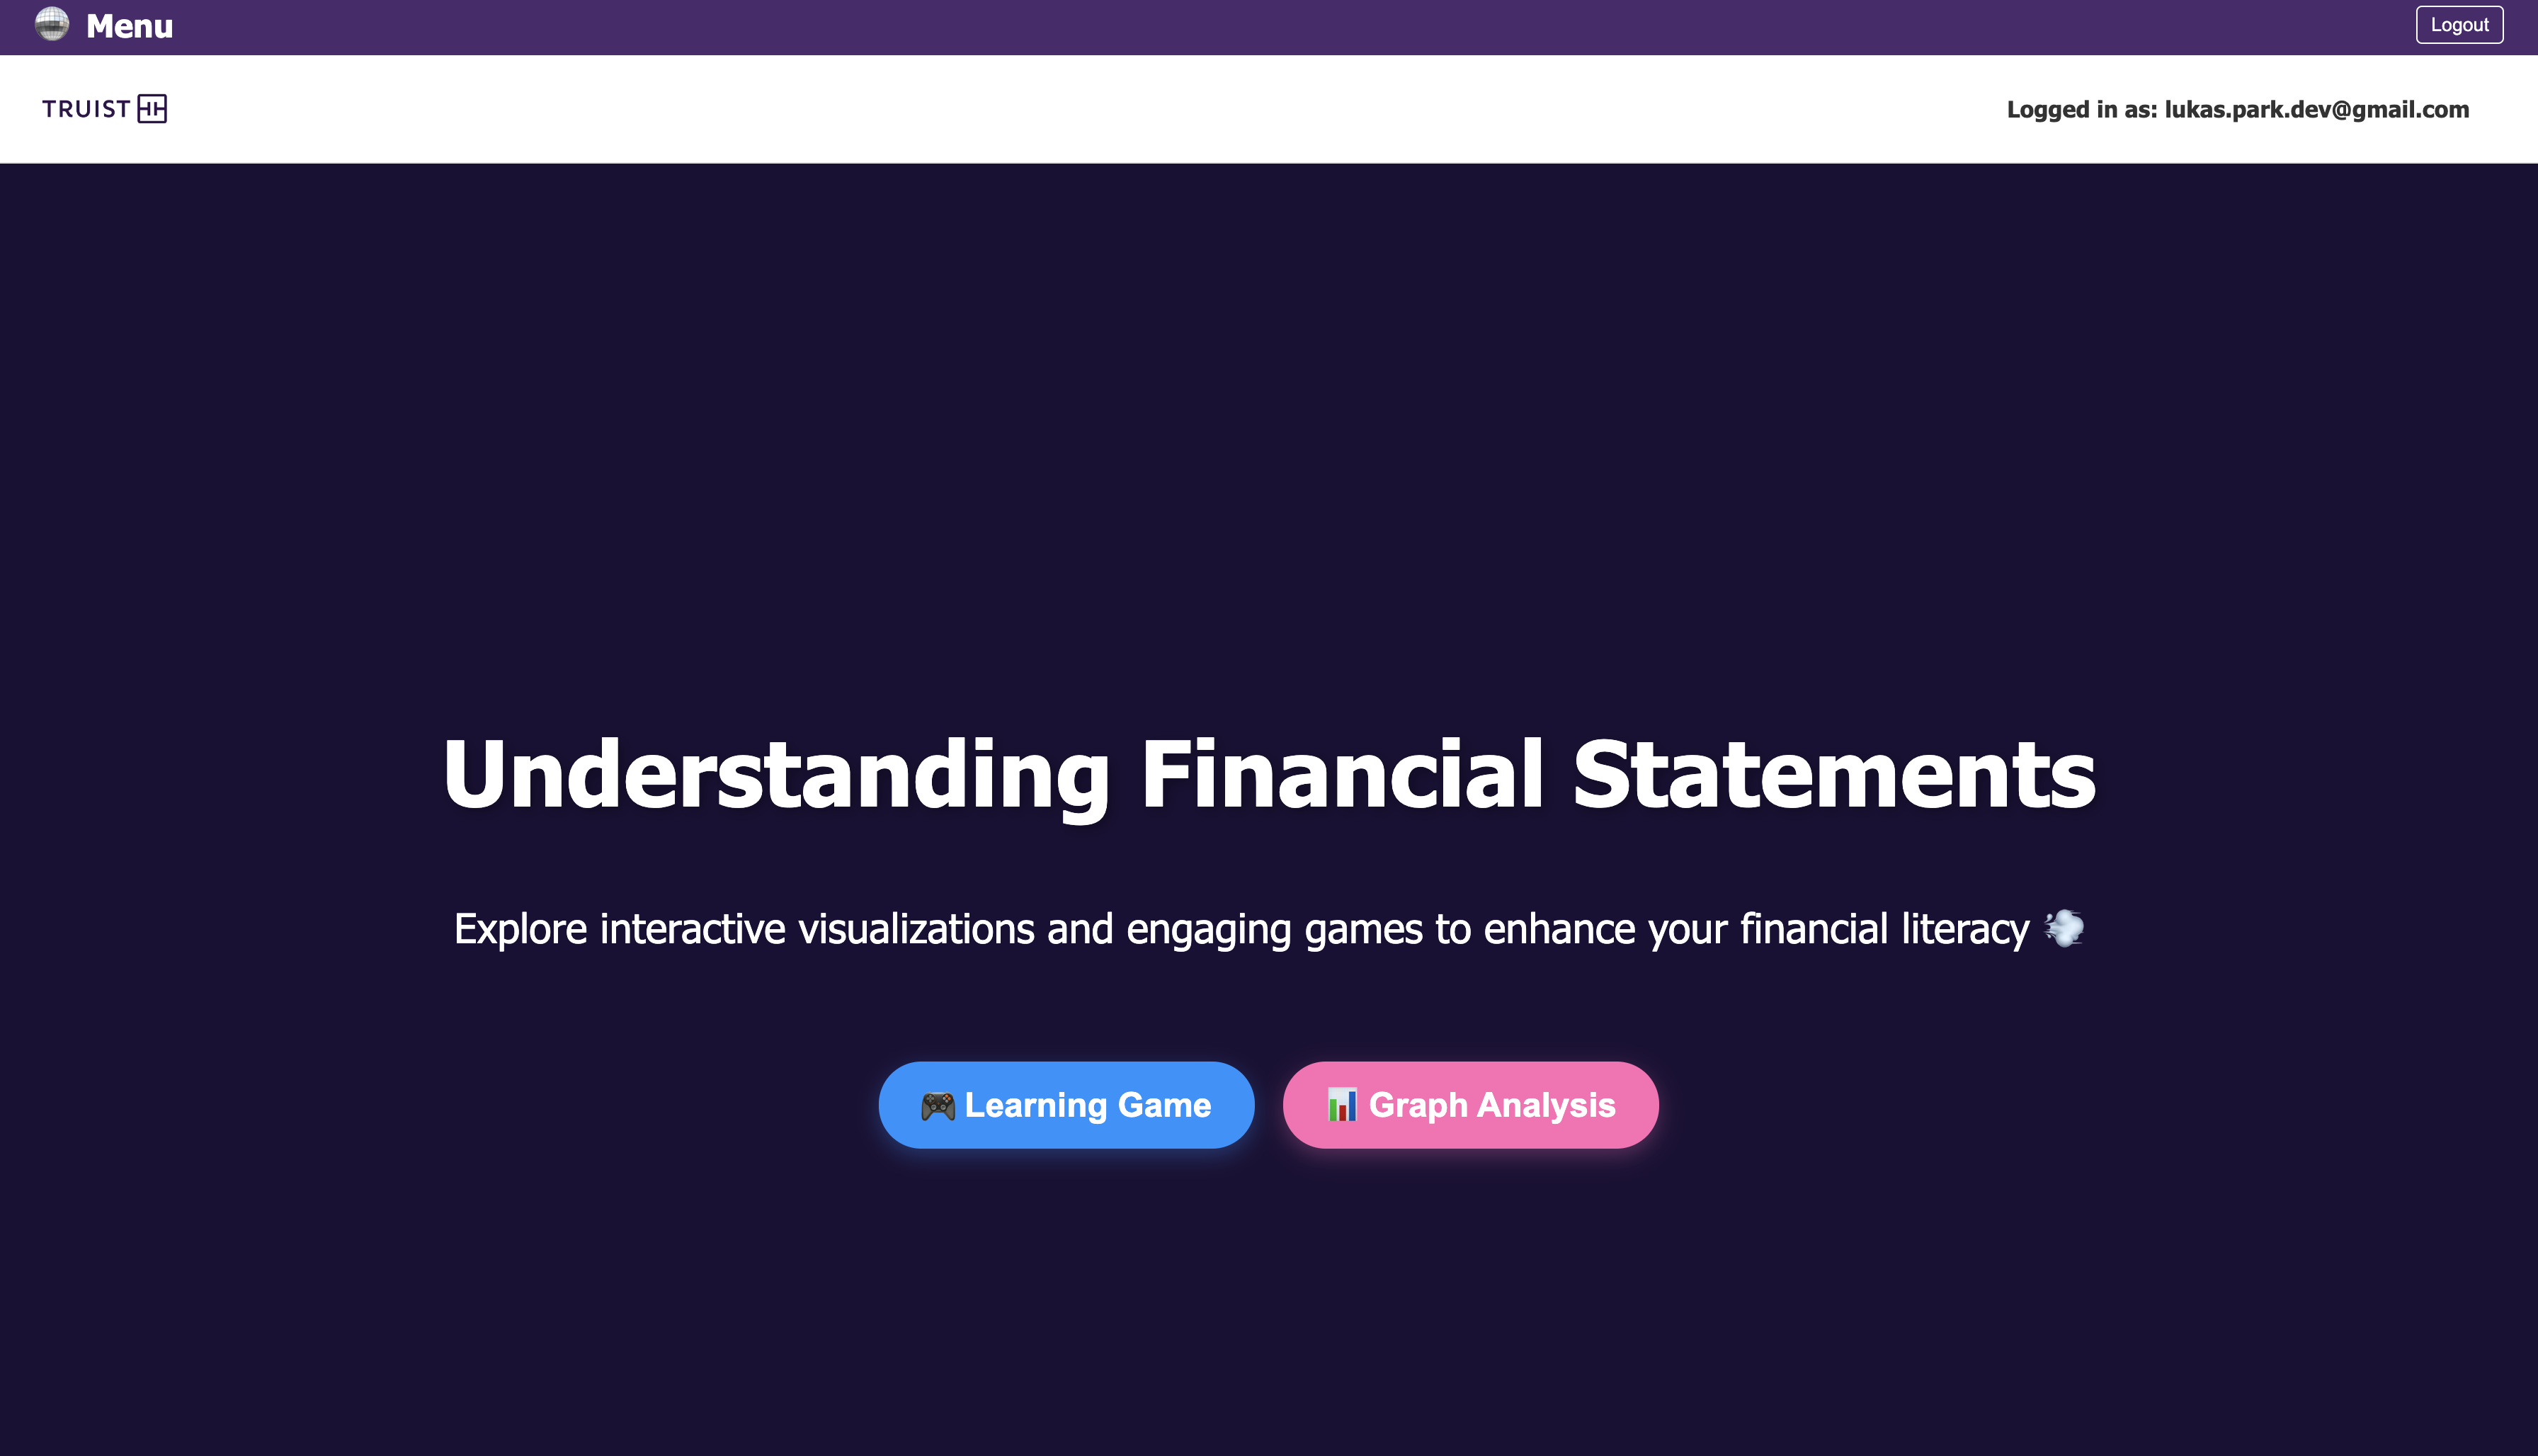
landing page
-

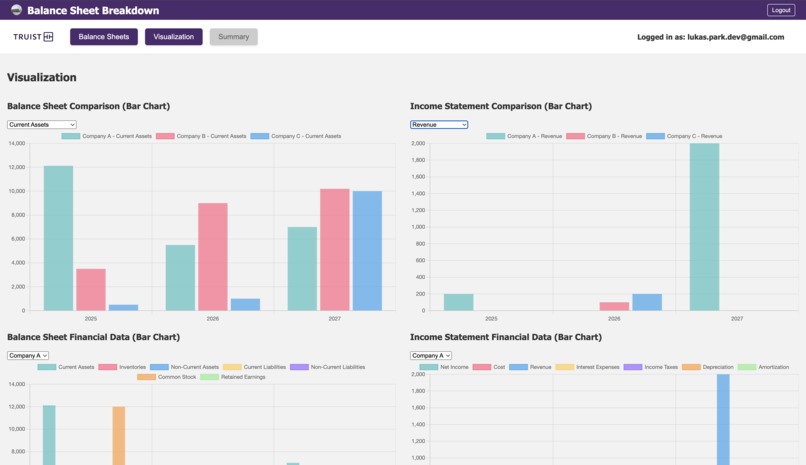
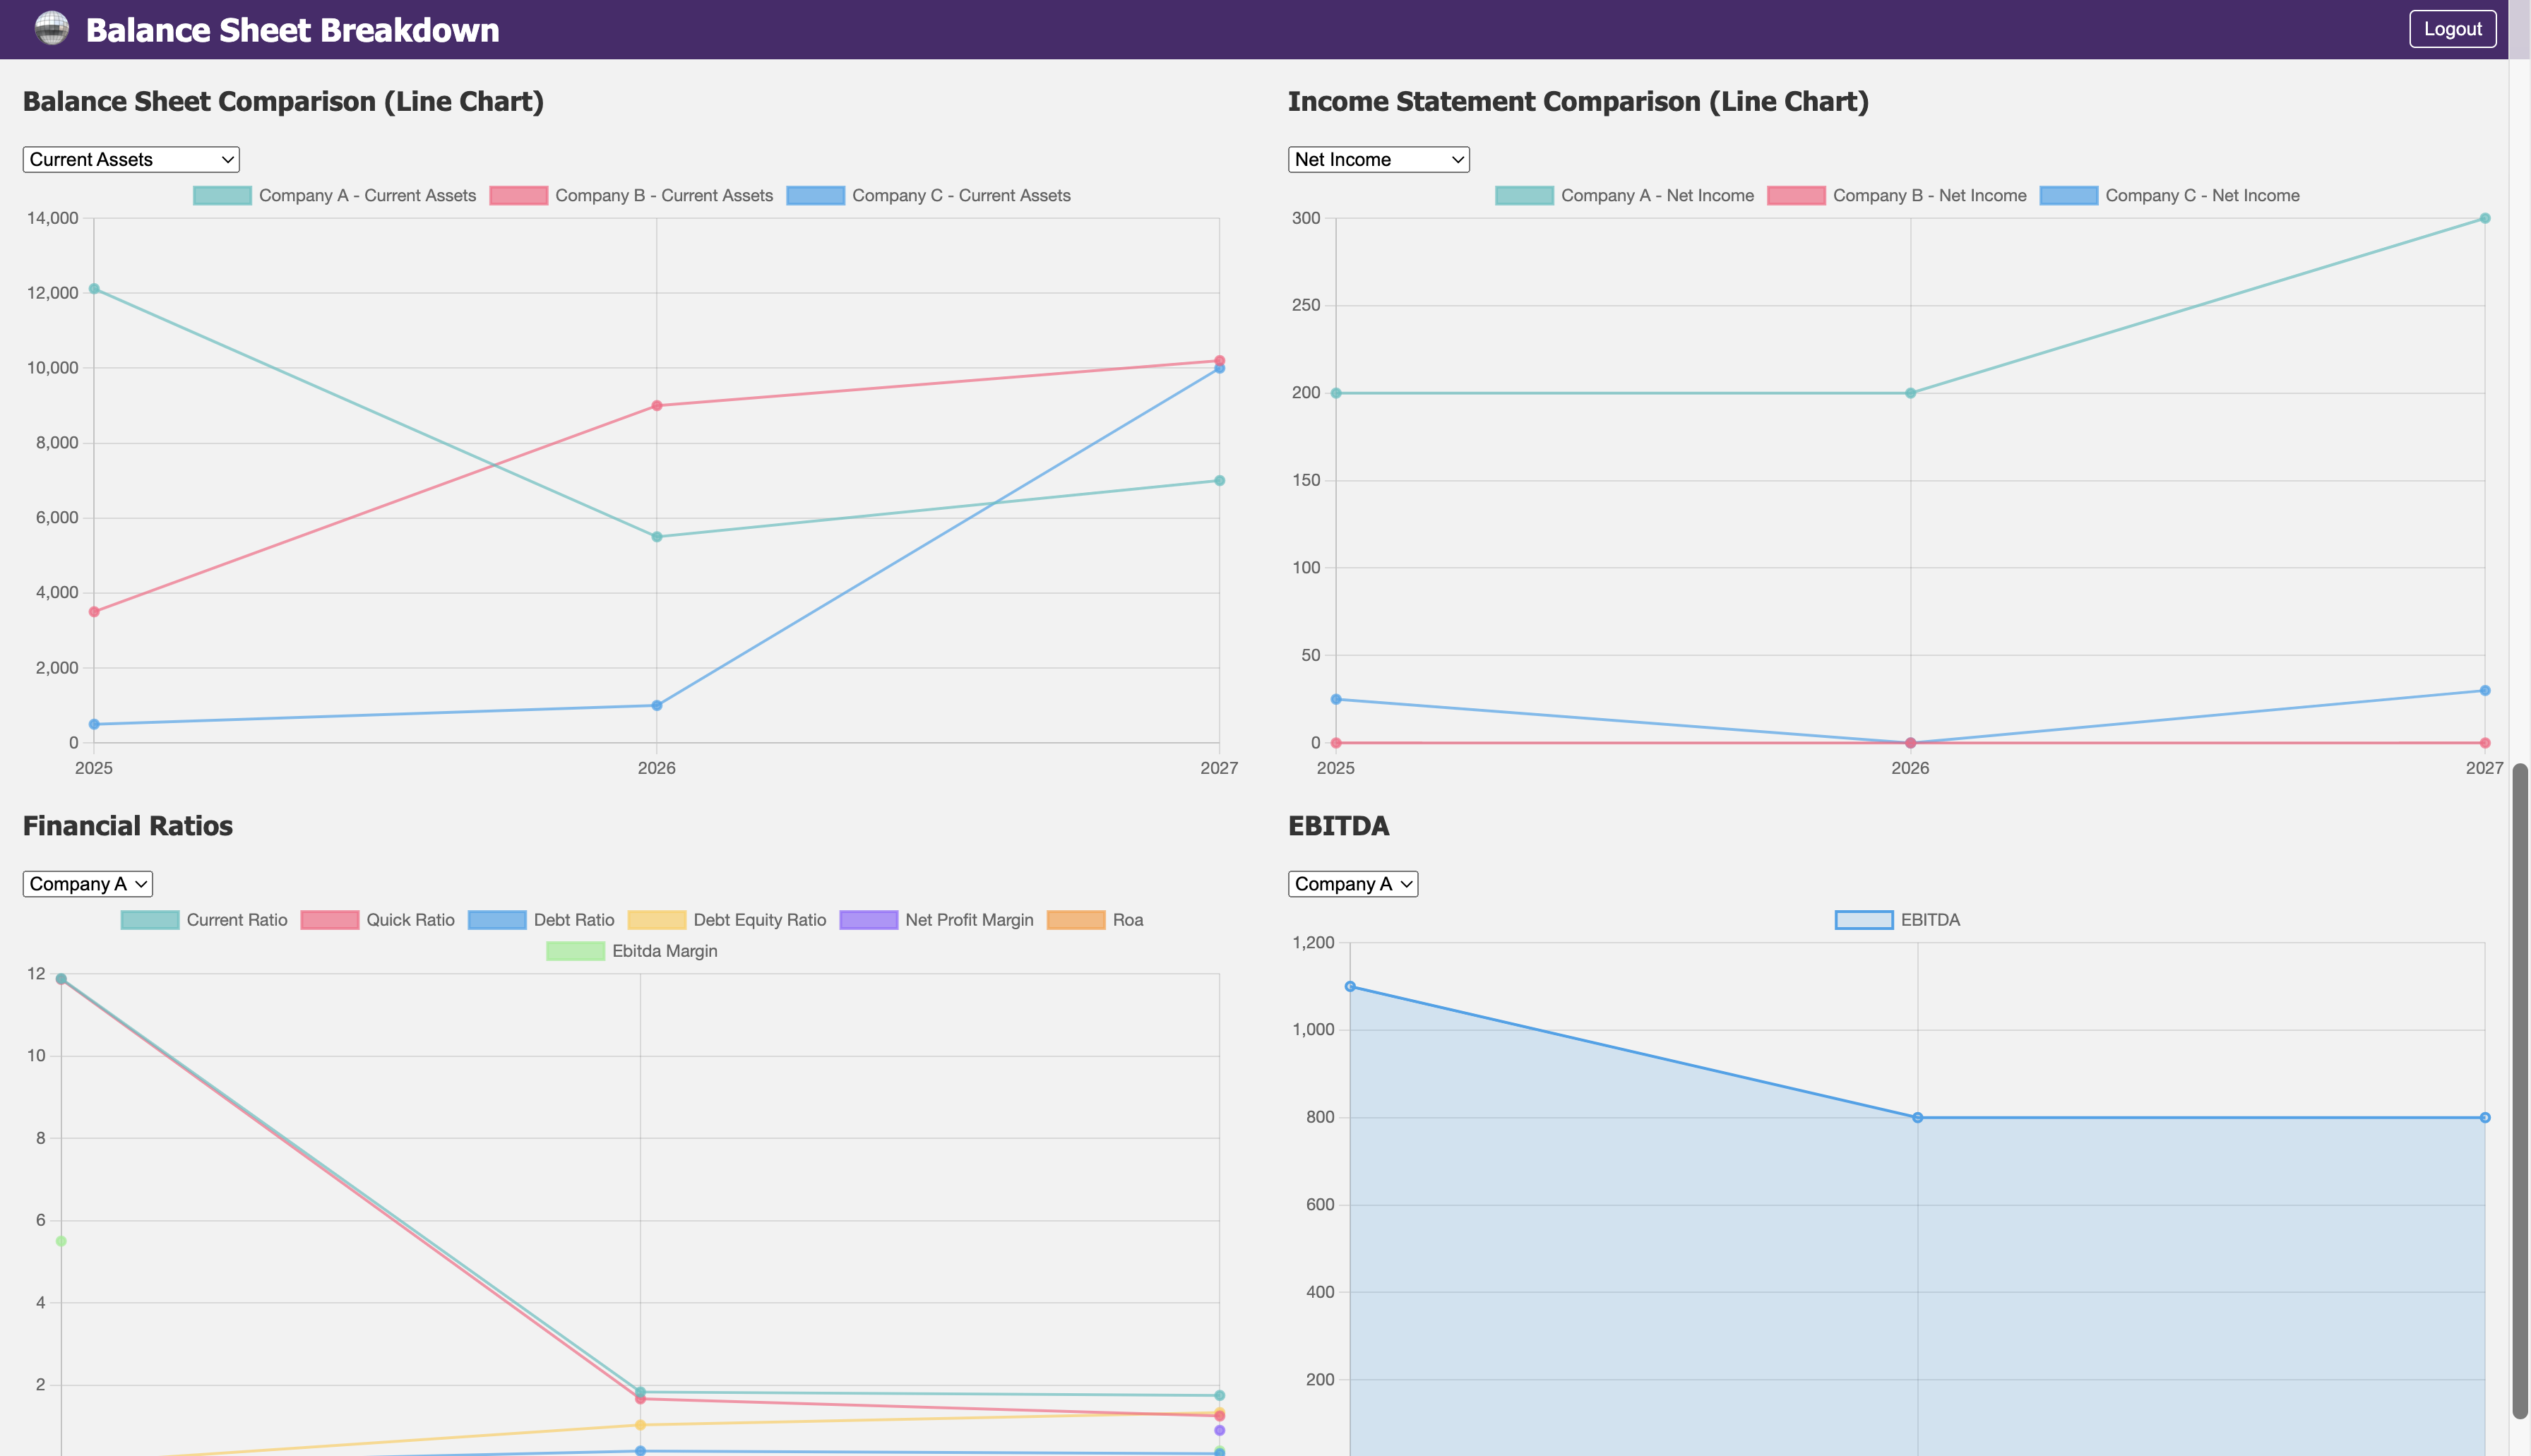
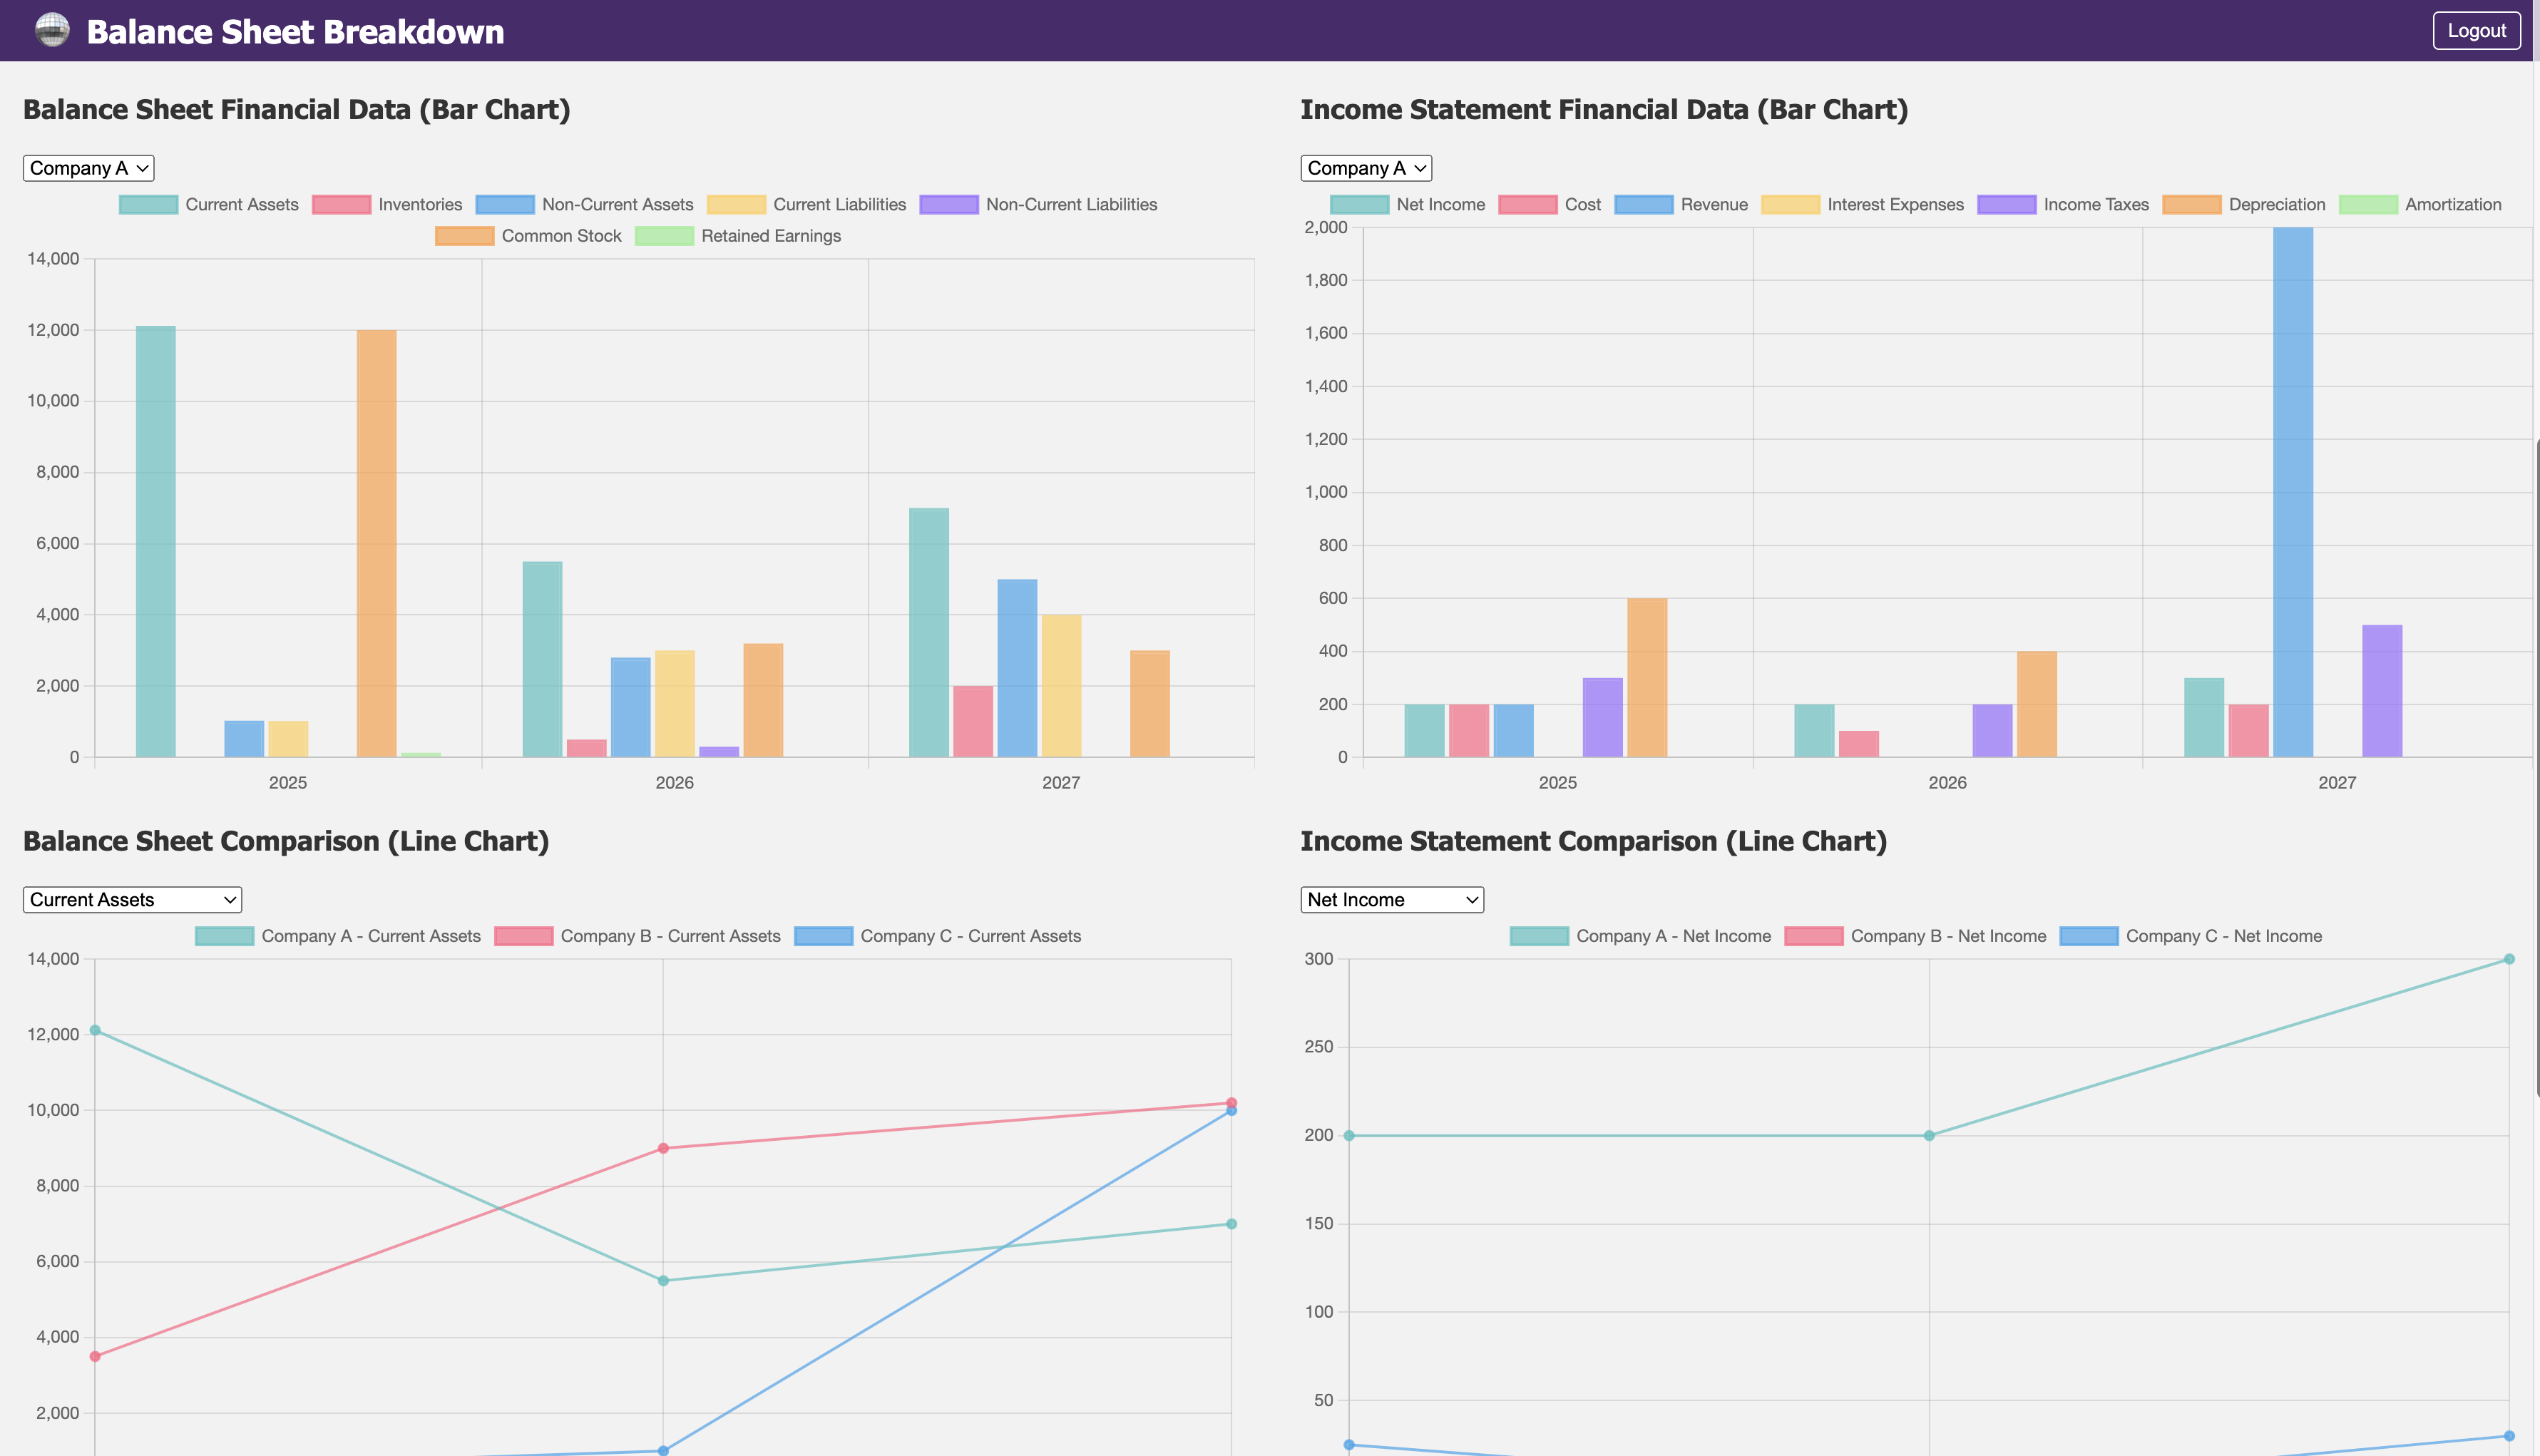
various data in dashboard
-

various company comparison
-
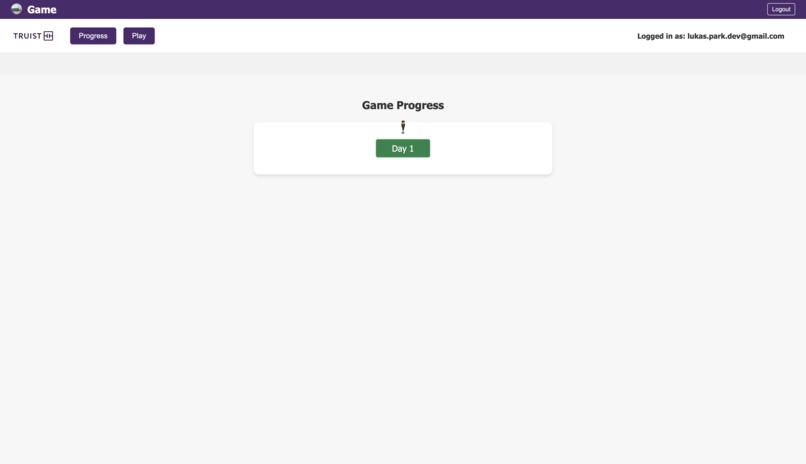
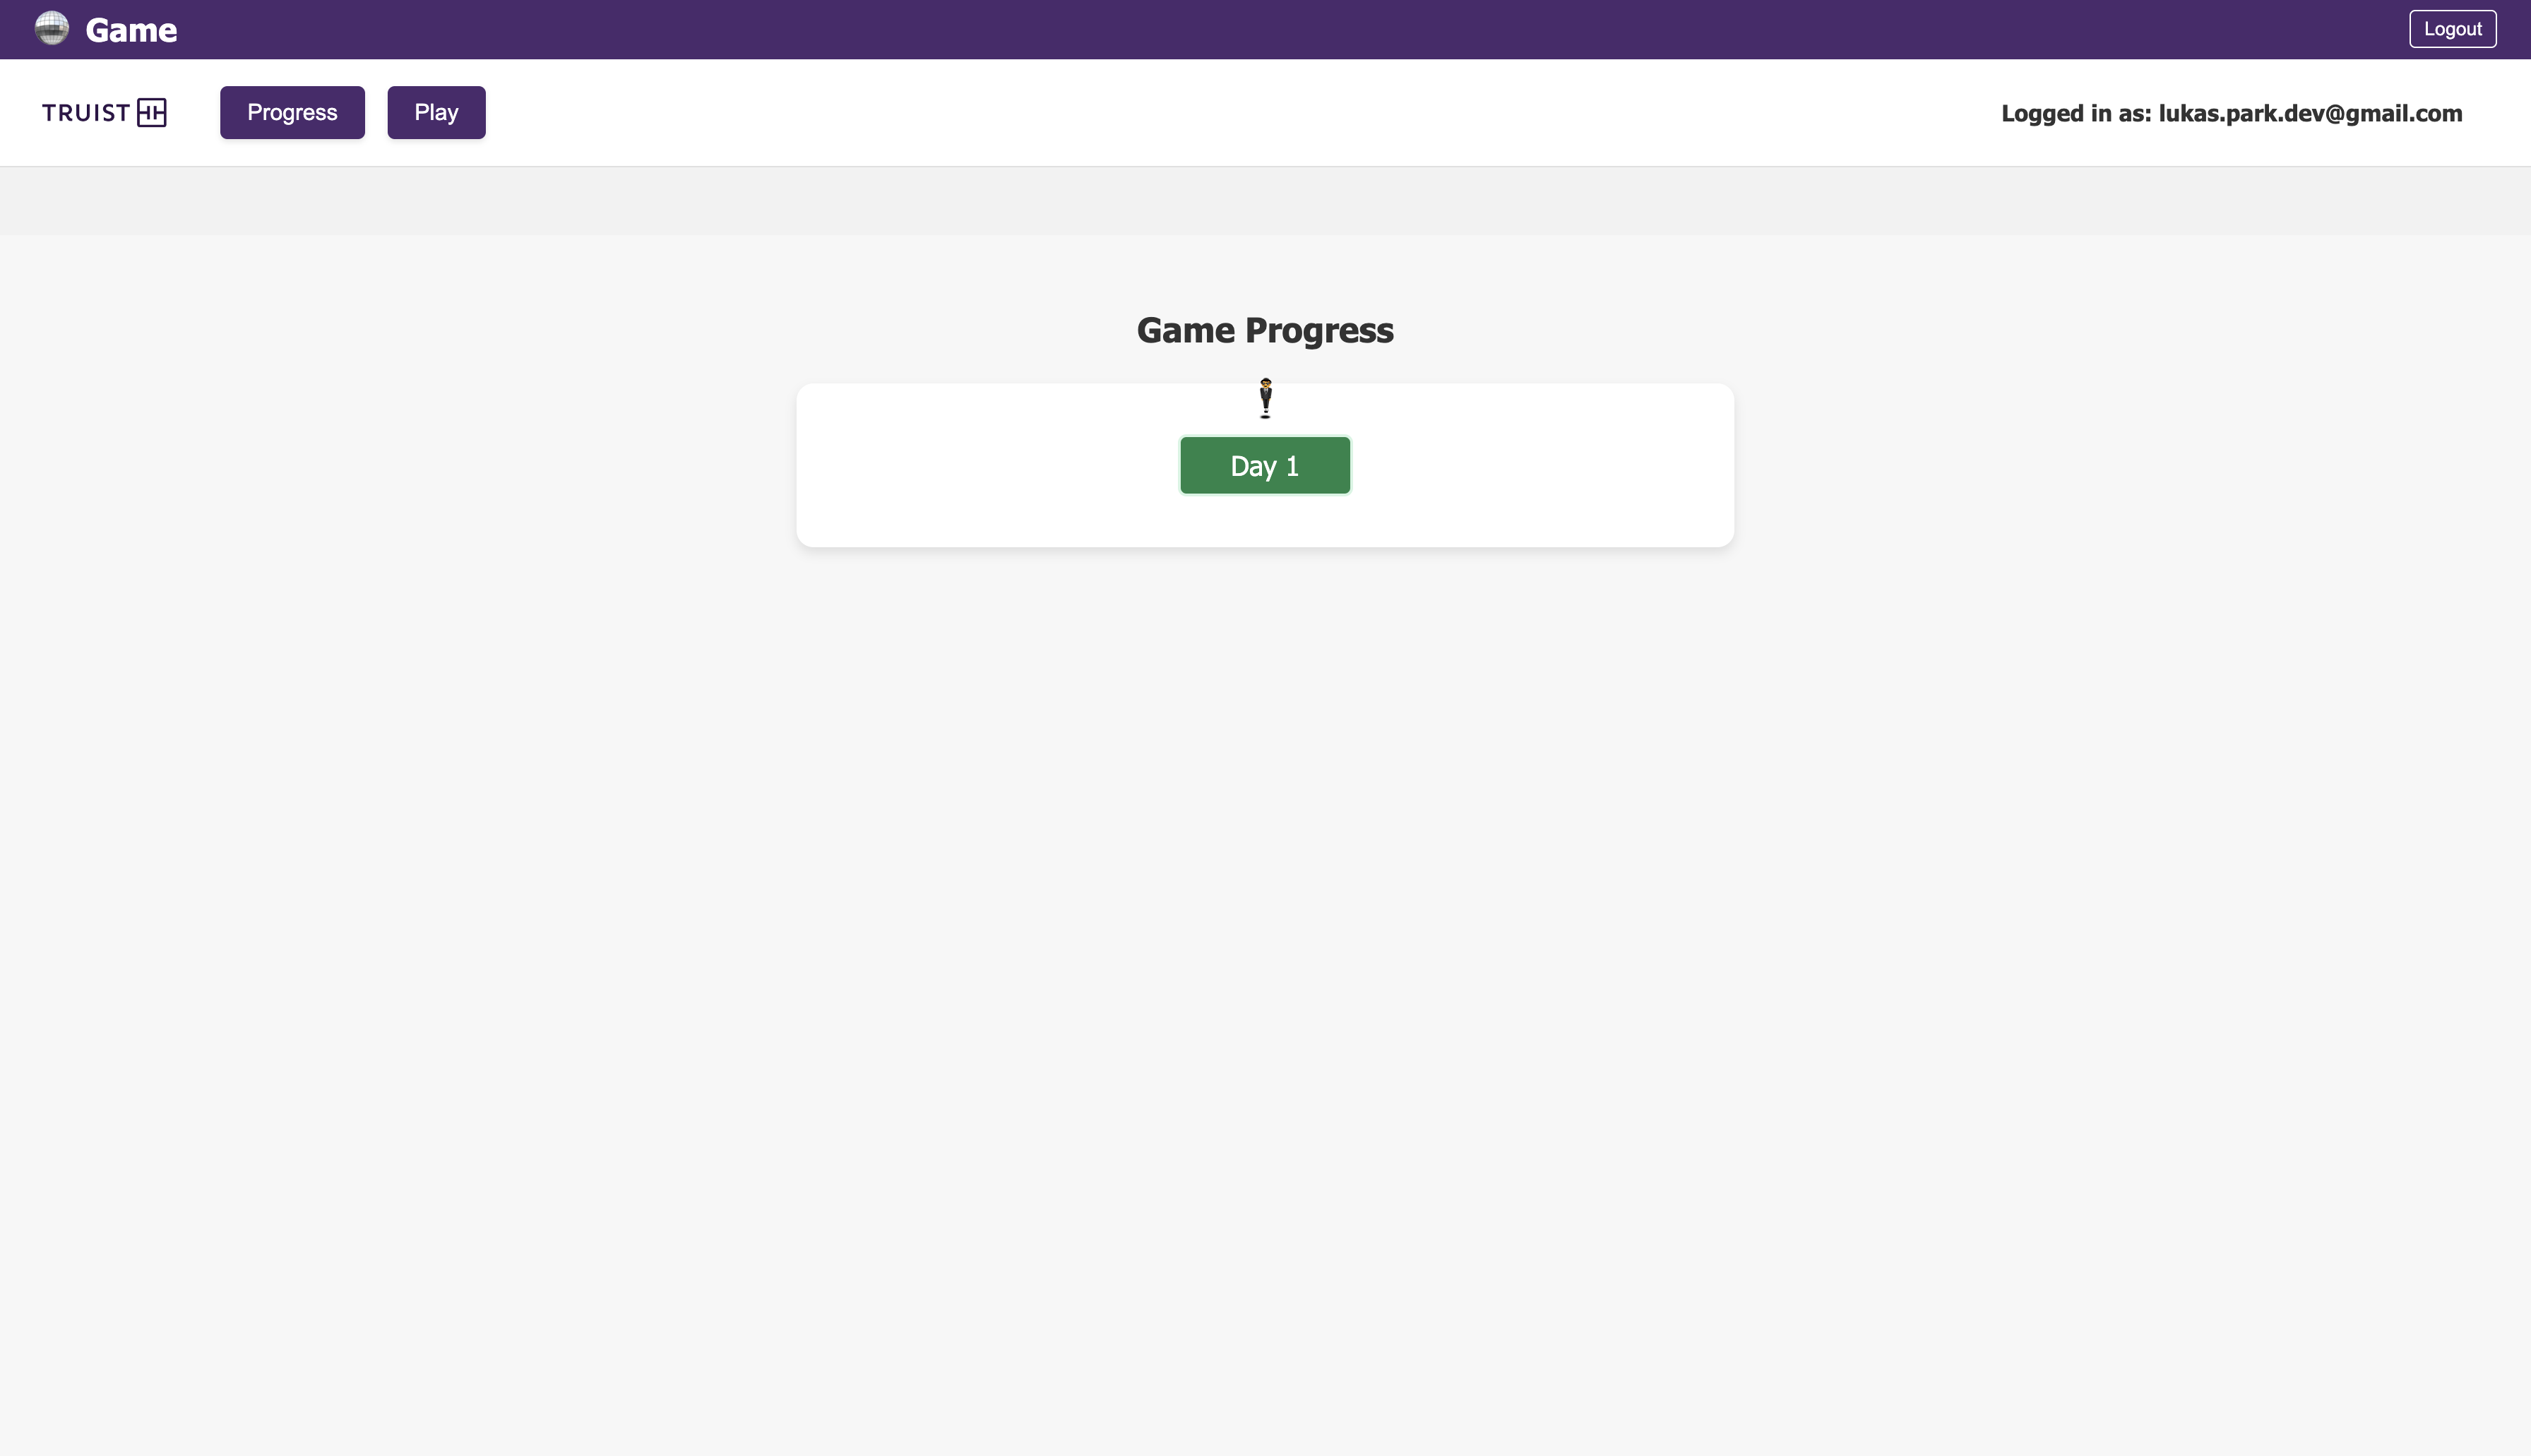
game home
-
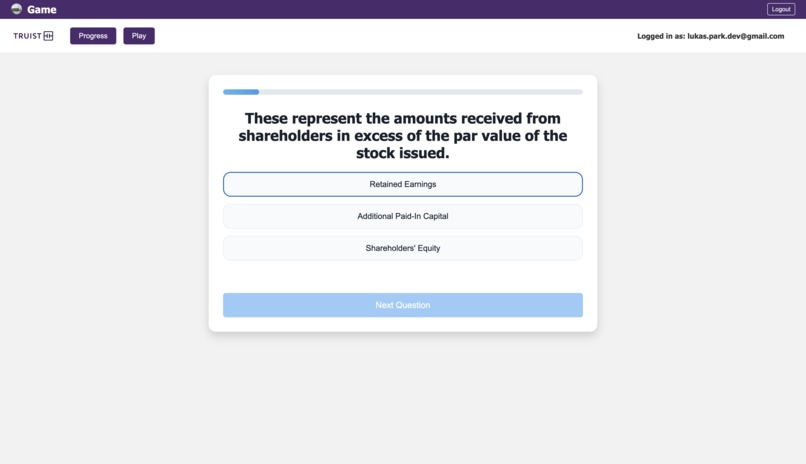
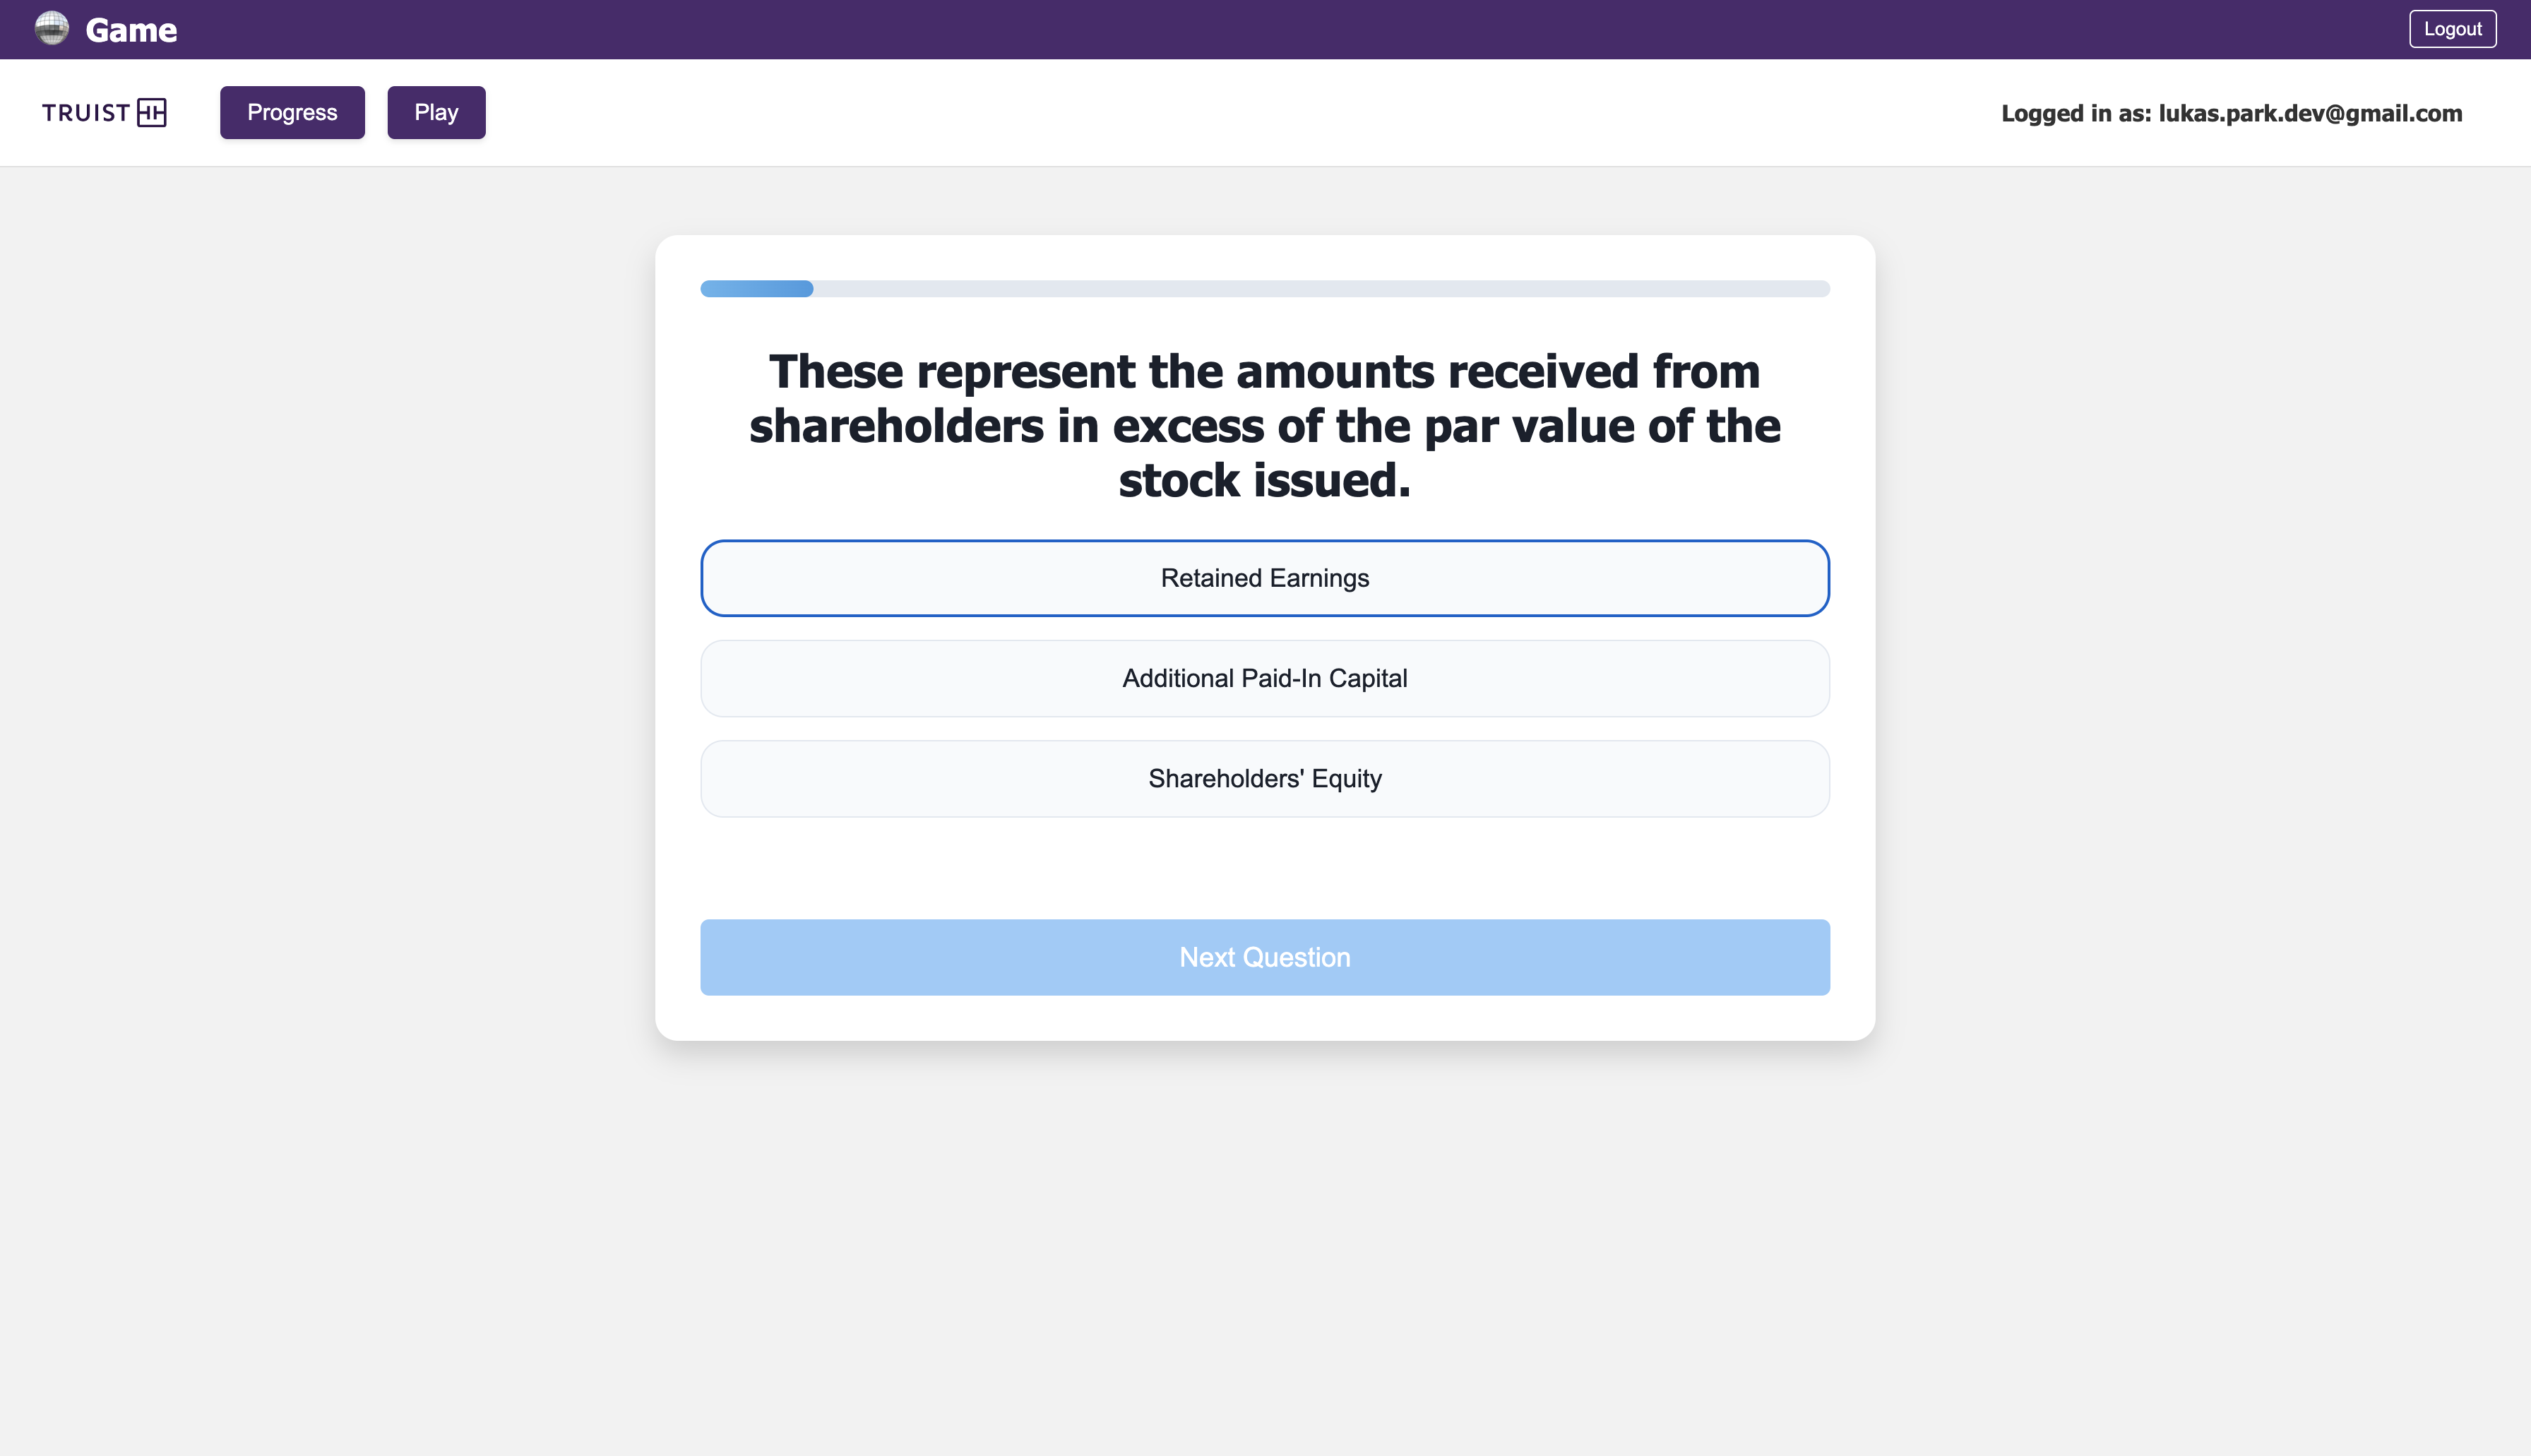
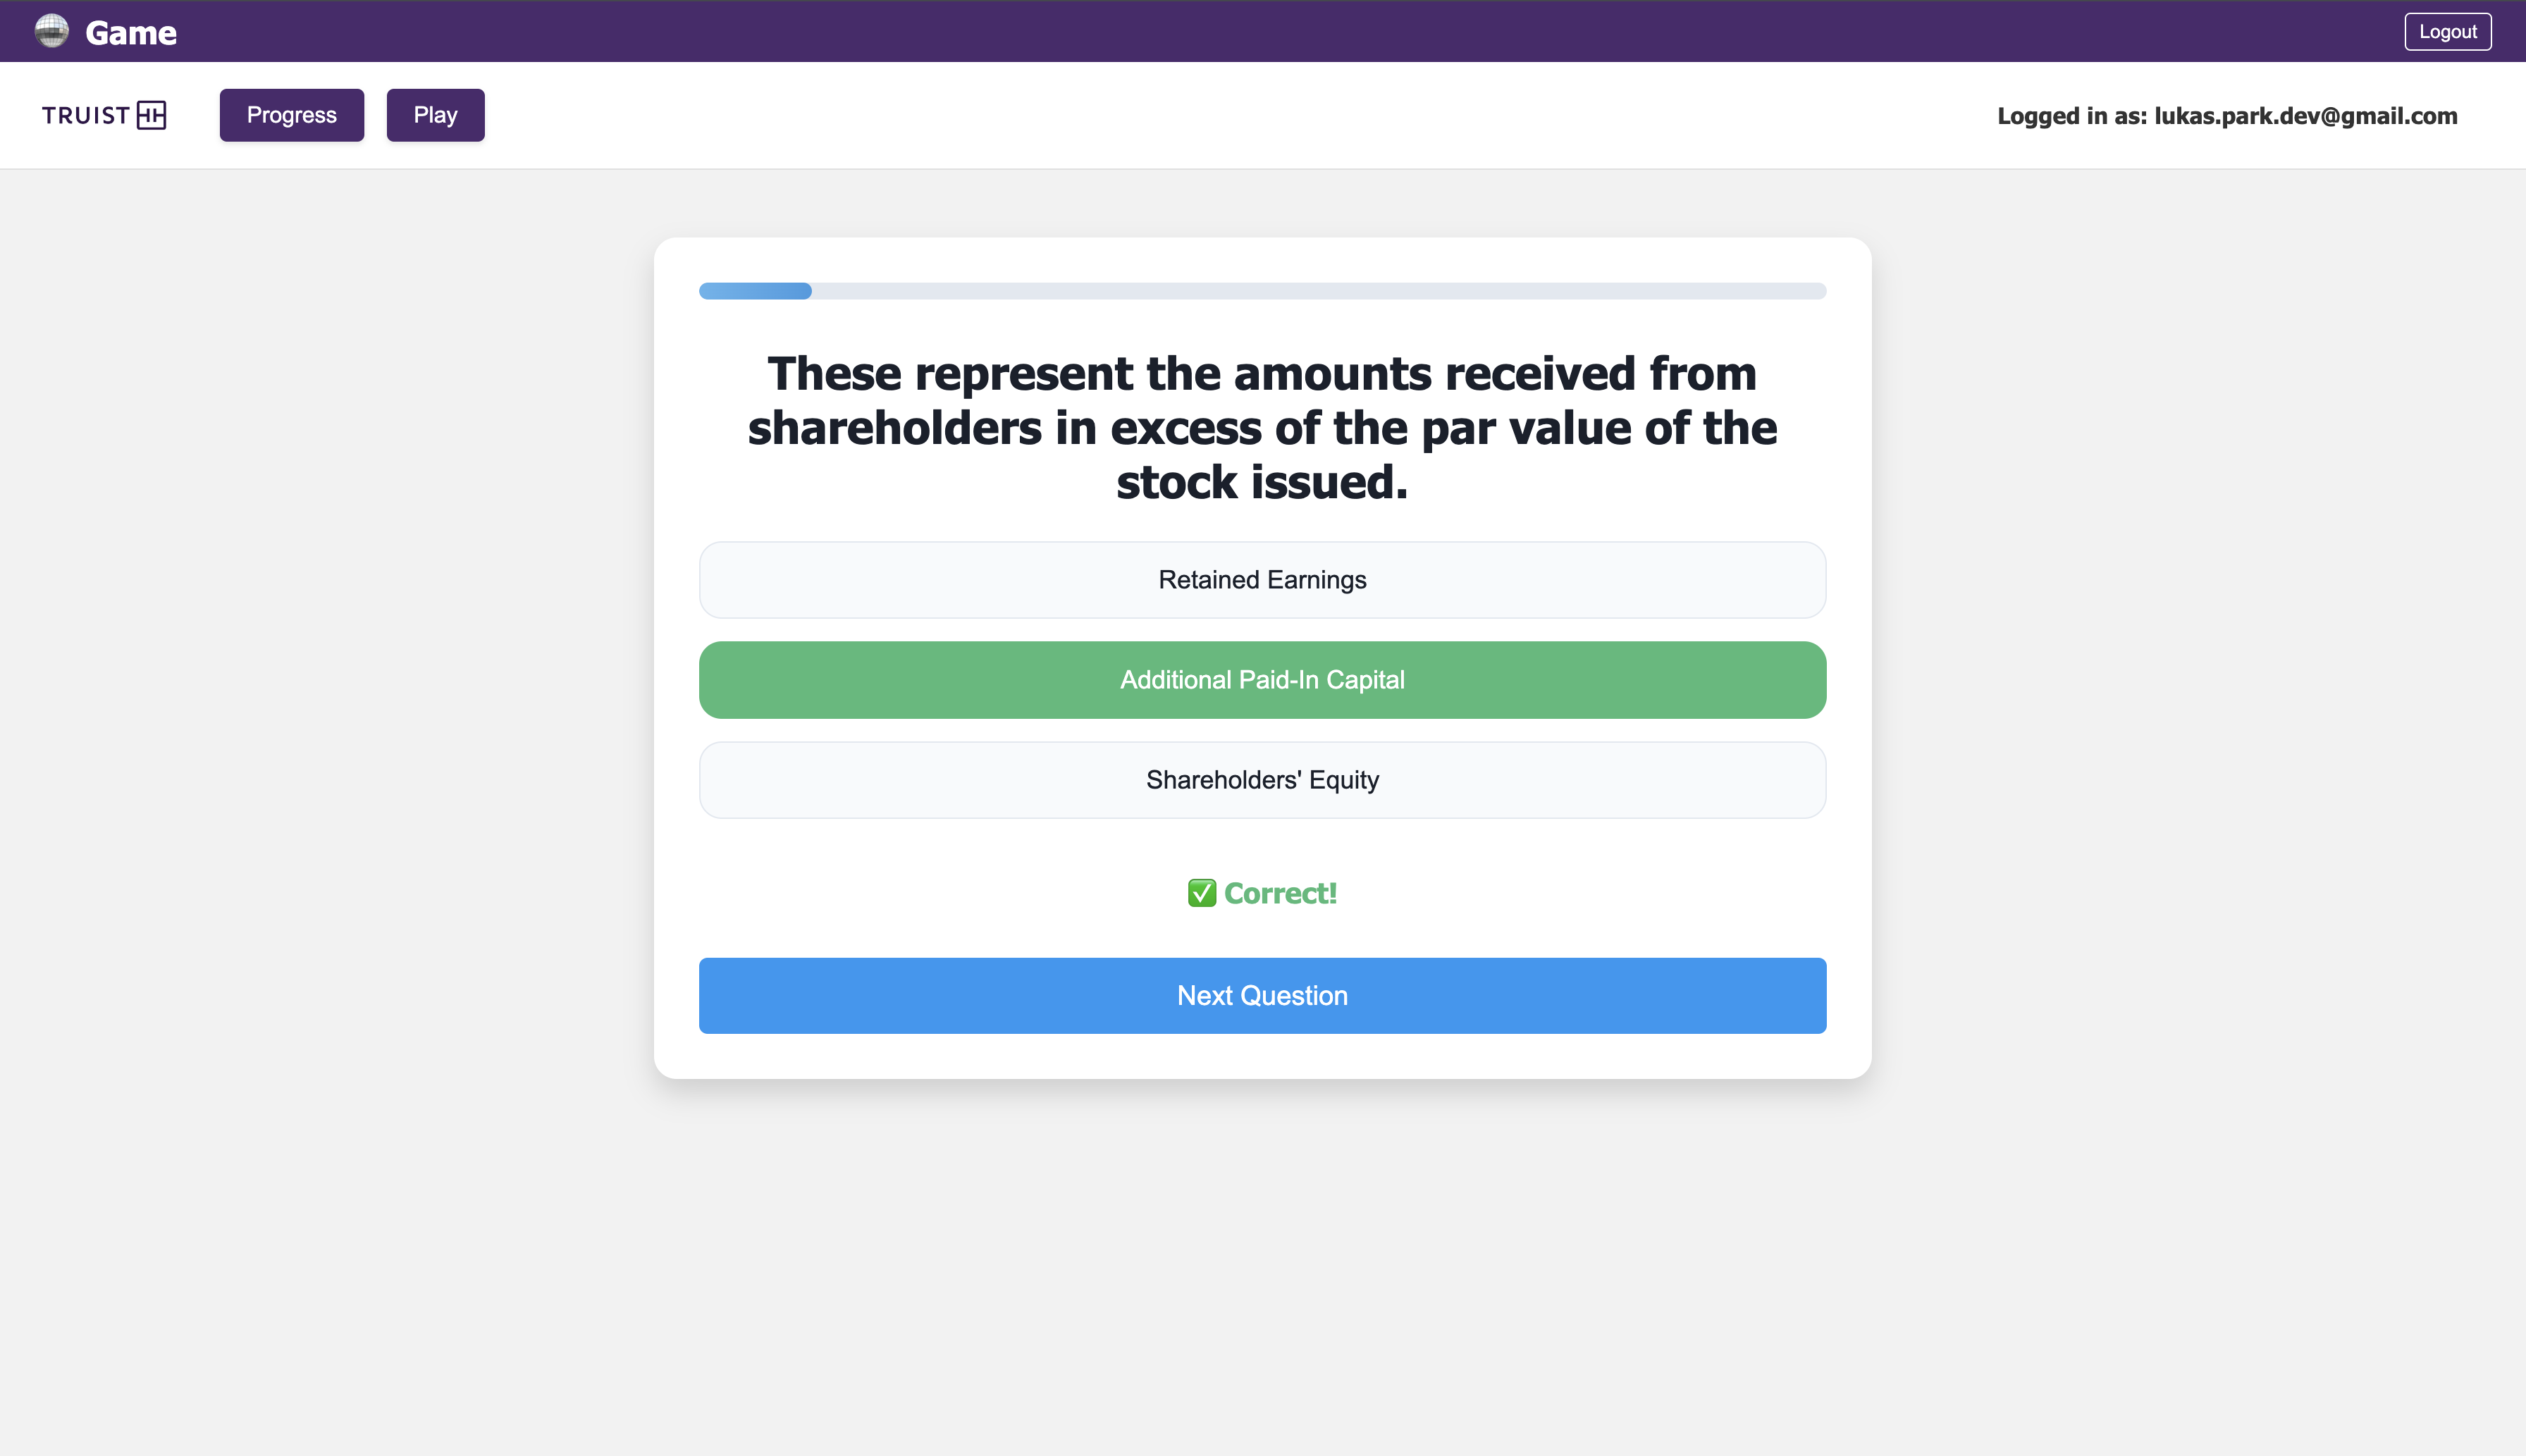
question example #1
-

question example when right
-
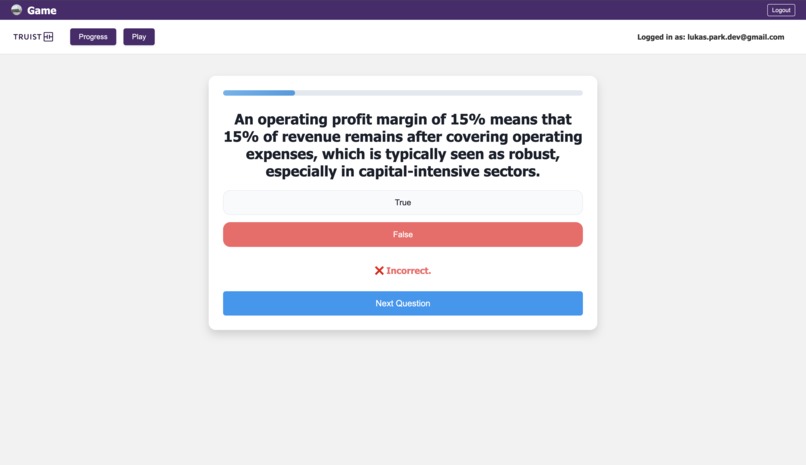
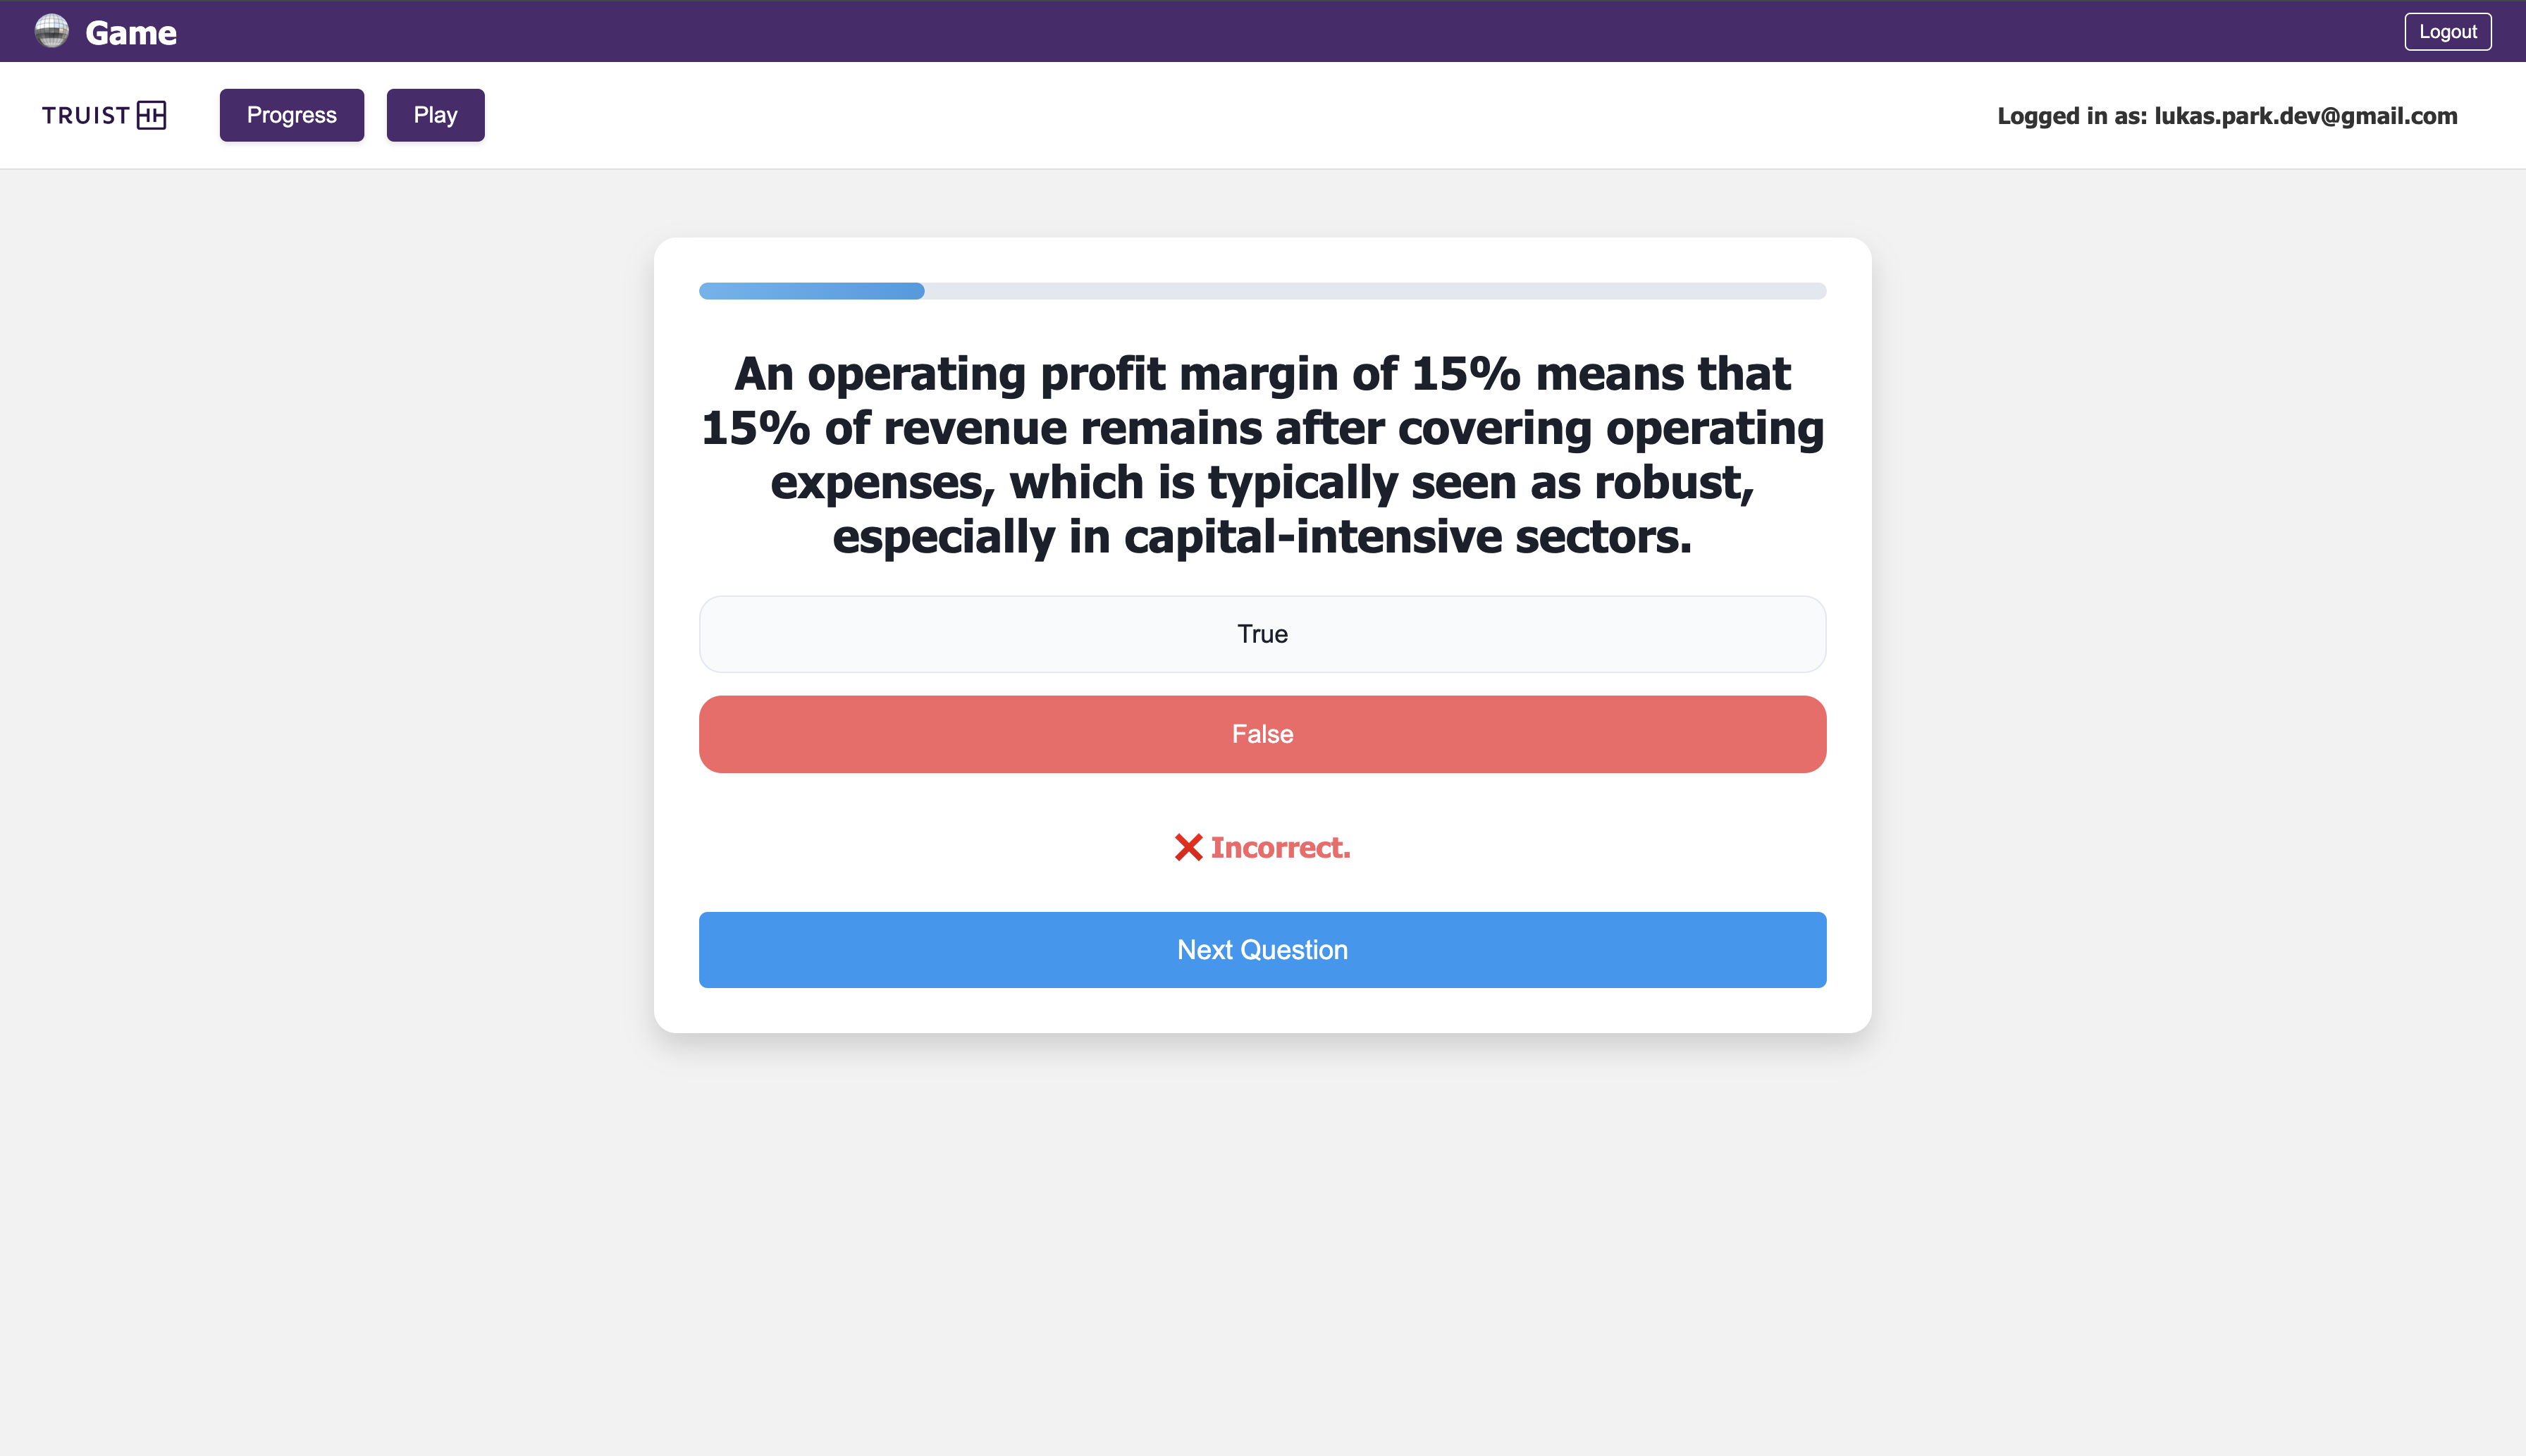
question example when wrong
-
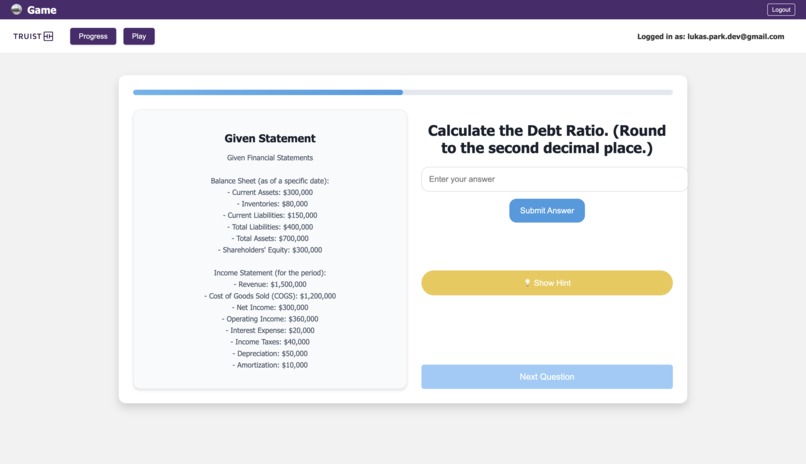
question with hints


Inspiration
Financial statements are essential for understanding a company's health, but many find them complex. We wanted to create a user-friendly platform that makes financial analysis simple and engaging.
What It Does
📊 Analysis Tool – Upload balance sheets and income statements to generate interactive visualizations. 🎮 Learning Game – Strengthen financial literacy through engaging challenges and quizzes.
How We Built It
We used React, Node.js, and MongoDB, with AWS S3 for storage and Chart.js for data visualization. The backend processes financial data, while the front end ensures an intuitive user experience.
Challenges We Ran Into
Handling different financial statement formats. Ensuring data accuracy and visualization clarity. Creating a fun and educational game experience.
Accomplishments That We're Proud Of
✅ Successfully converting financial data into insightful visual charts. ✅ Making finance education engaging and interactive. ✅ Implementing seamless drag-and-drop uploads.
What We Learned
📌 The importance of UX in financial tools. 📌 Strategies for improving data validation. 📌 How gamification enhances learning.
What's Next for ugaHacksXFinCompare
🚀 Expanding support for cash flow statements. 🚀 Adding collaborative features for team analysis. 🚀 Enhancing the learning game with AI-driven recommendations.
Built With
- amazon-web-services
- axios
- express.js
- javascript
- mogodb
- mongodbatlas
- node.js
- openai
- react

Log in or sign up for Devpost to join the conversation.