Inspiration
A stable and secure energy infrastructure network is necessary for a high quality of life and the successful development of a society, especially with growing demands from multiple economic and technological sectors. Utility companies competing with one another drives up crew and equipment costs, which is paid off by the company and passed down to the consumer in order to create a profit margin as well as increasing project schedule timelines due to isolated planning structures varying from company to company. Increased cooperation will allow companies to cut costs, saving money, and potentially speeding up construction timelines due to cutting down logistics needed to schedule construction assets. This would allow us to live in a more energy secure future, which was a major inspiration behind this project. Another aspect that served as inspiration was the desire for environmental protections as the potential for increased cooperation could help avoid unnecessary environmental damage from using multiple crews and extending project timelines.
What it does
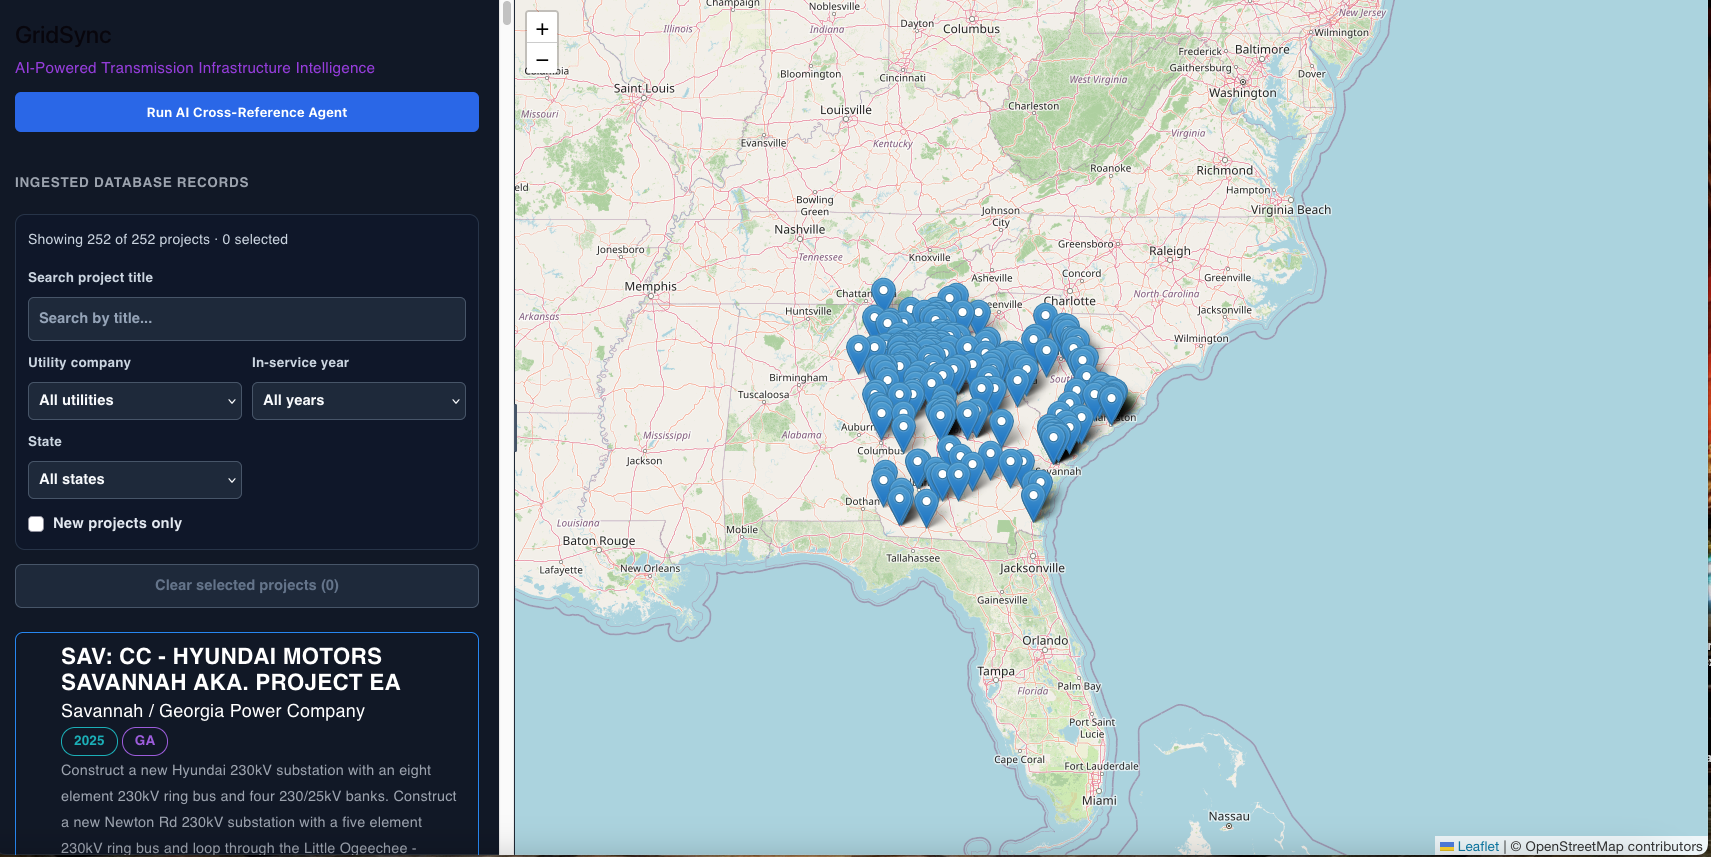
Our project enables utility companies to identify other utility projects in proximity to a planned future site, in order to allow coordination and cooperation for shared resources, equipment, labor and access for sites within a distance of 40km. This will allow for utility companies to work with each other for construction during future projects to avoid costs for duplicate or separate crews and equipment when they can work in a joint capacity and save money together. We do this using an interactive map that will identify and track project sites and calculate the distance to show projects within a determined distance of 40km.
How we built it
We built the project using an AI agent that we trained that parsed data from publicly available information, which fed that data to our database base. The backend calculates where the overlaps occur between project points. This was sent to the frontend to use this information to map the data in an interactive format to showcase the utility project sites and overlaps to the user, providing filters to allow a more narrow scope according to the needs of the user.
Challenges we ran into
Feeding the information to our AI agent proved difficult. The AI would often miss data or hallucinate data, so training it to not miss anything was very hard. We also ran into challenges in creating the front end to properly display icons as well as have a color palette that would identifiable but not cluttered on the map. Backend ran into issues with calculating the distance between project sites and miscounts on the amount of overlaps between sites.
Accomplishments that we're proud of
Within 36 hours, we were able to create a project that has that potential to solve a major issue in the energy and construction industries. We overcame many production errors and were able to have a solution for the issues and use our perseverance to push through and meet the deadline.
What we learned
We learned how to cooperate with a new team as none of us knew each other prior to this hackathon competition. We also learned more technical skills in our respective fields because of the need for troubleshooting and fixing any bugs or errors we came across during our development period.
What's next for GridSync
Future plans would be including the capacity to flag for inter-county, or interstate projects in order to identify potential situations that may require a heightened attention to environmental and local regulatory policies and agencies to empower cooperation on a level to protect the natural environment and ensure compliance with legal standards. Also allowing for more functionality and embed more integration with Microsoft Teams to allow for better workflow in professional environments.
Built With
- flask
- postgresql
- python
- react
- supabase

Log in or sign up for Devpost to join the conversation.