-
-
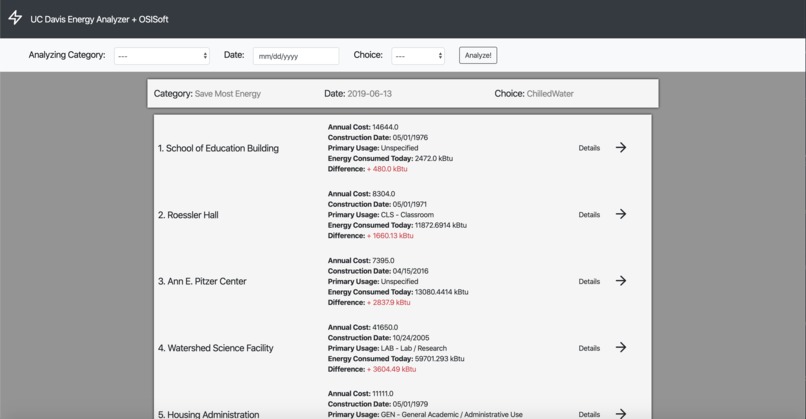
This is the search results when the user asked for buildings that save the most energy at a given day
-

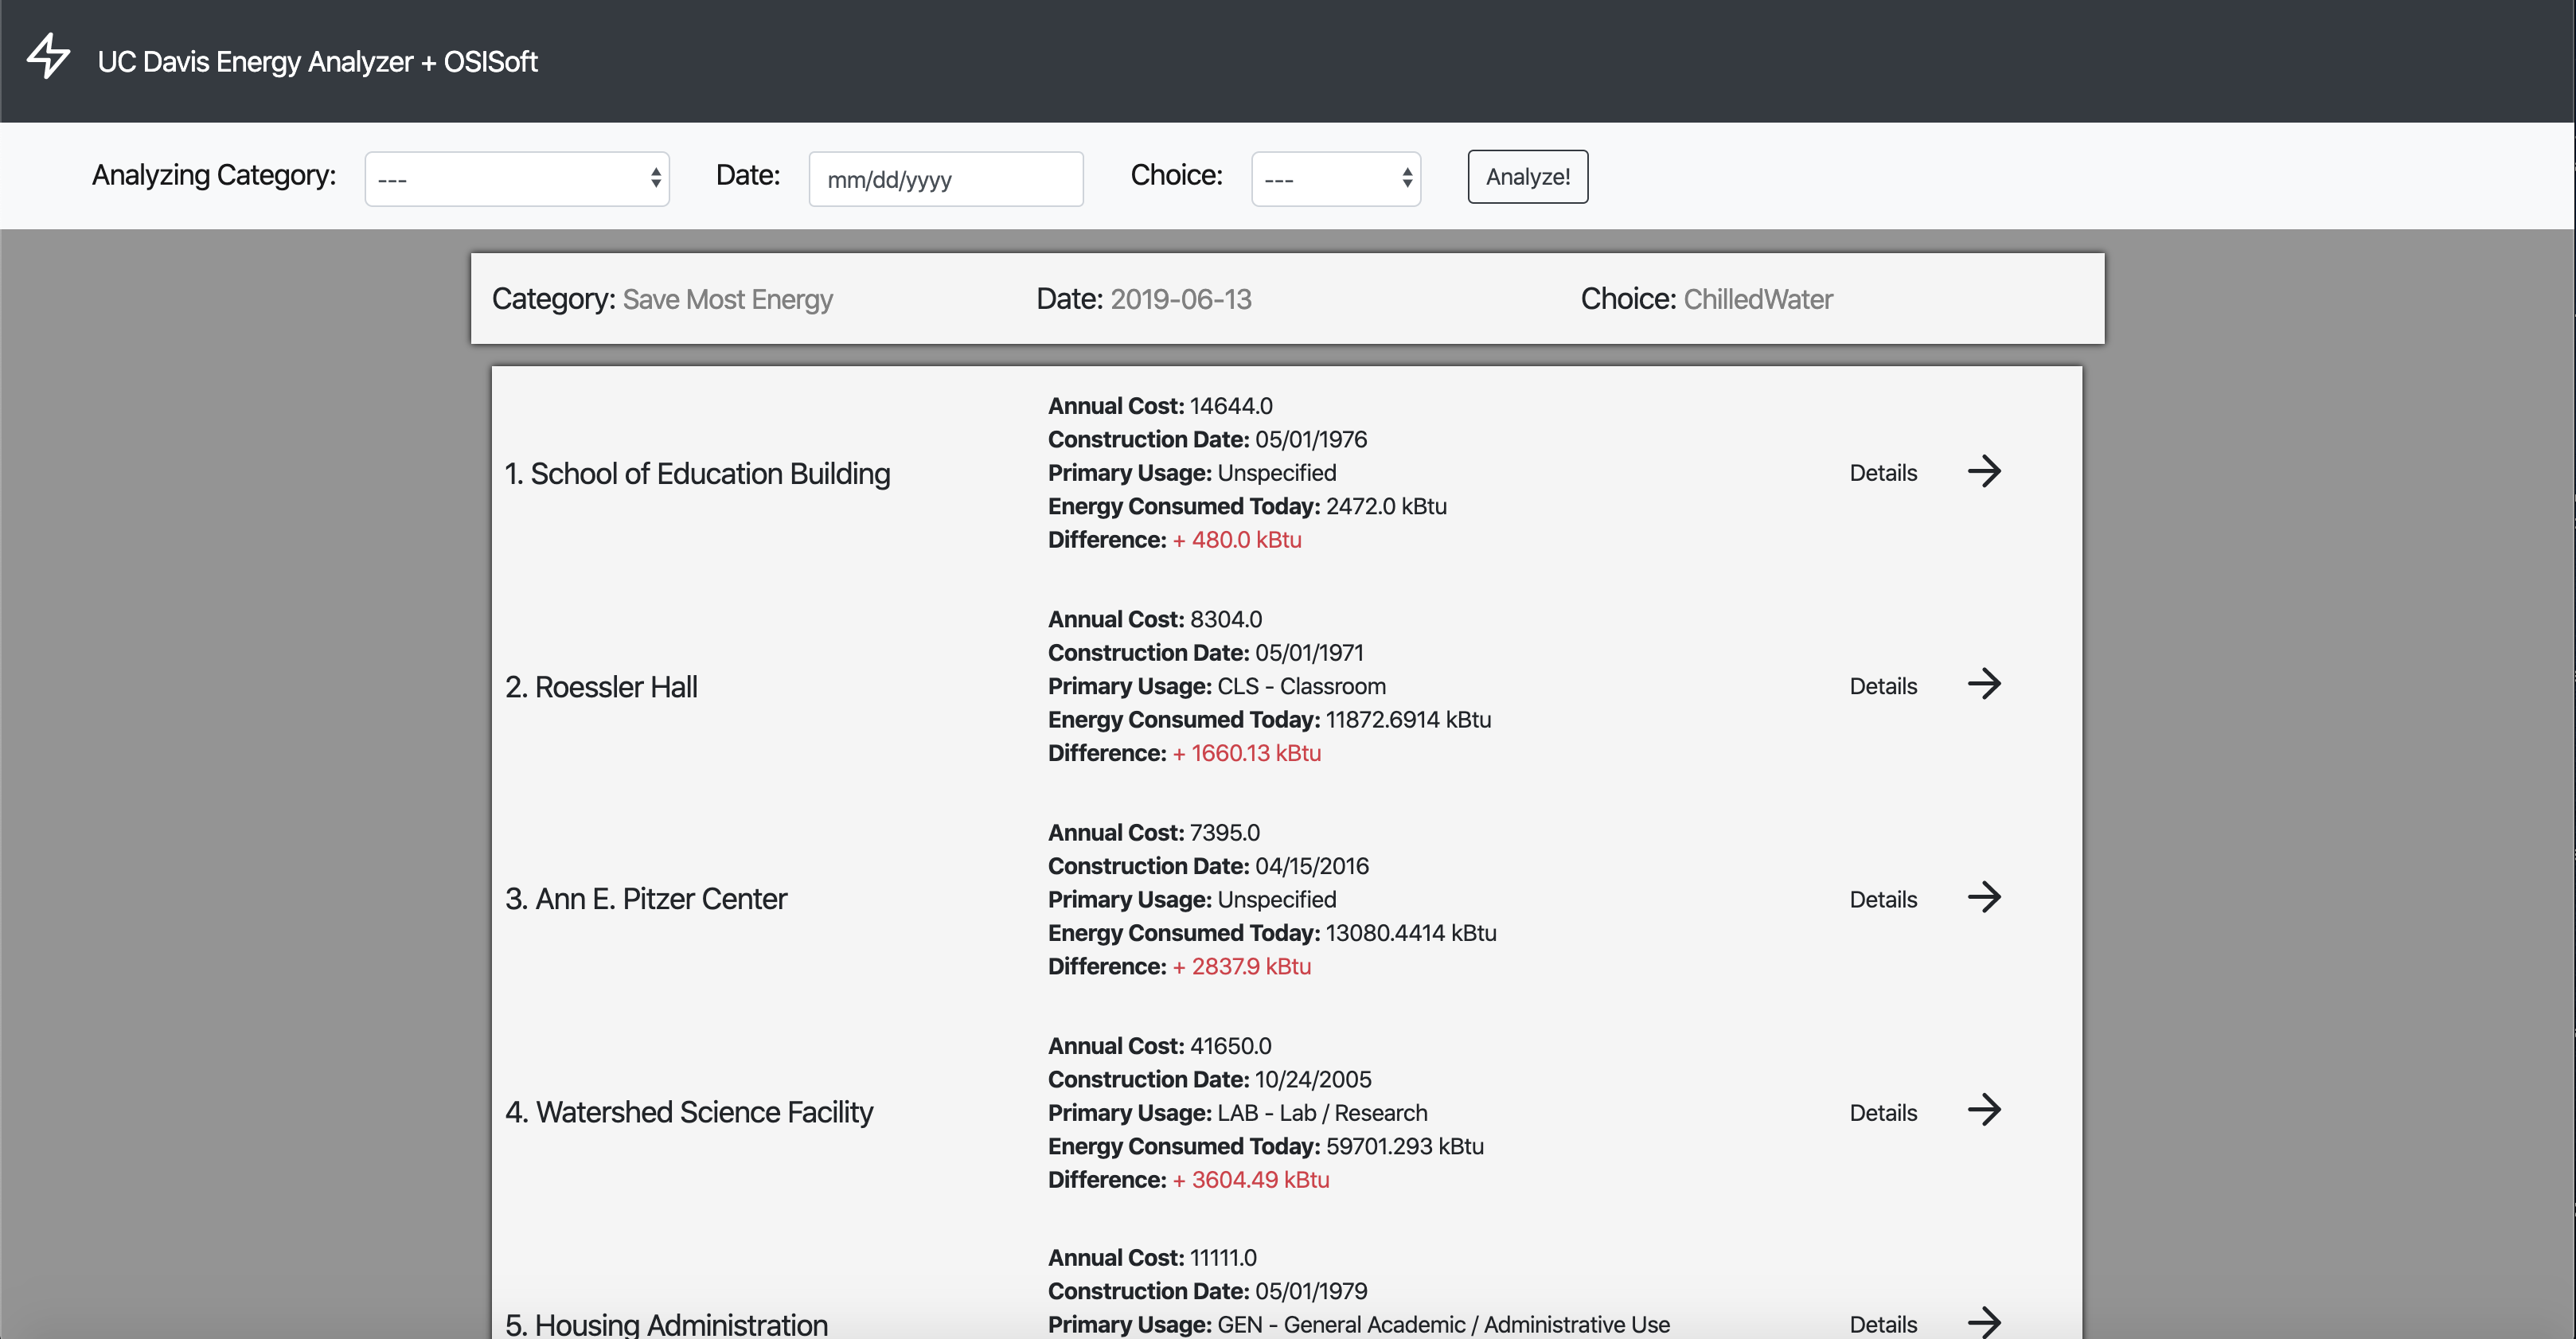
Another search result when users input different indicators
-

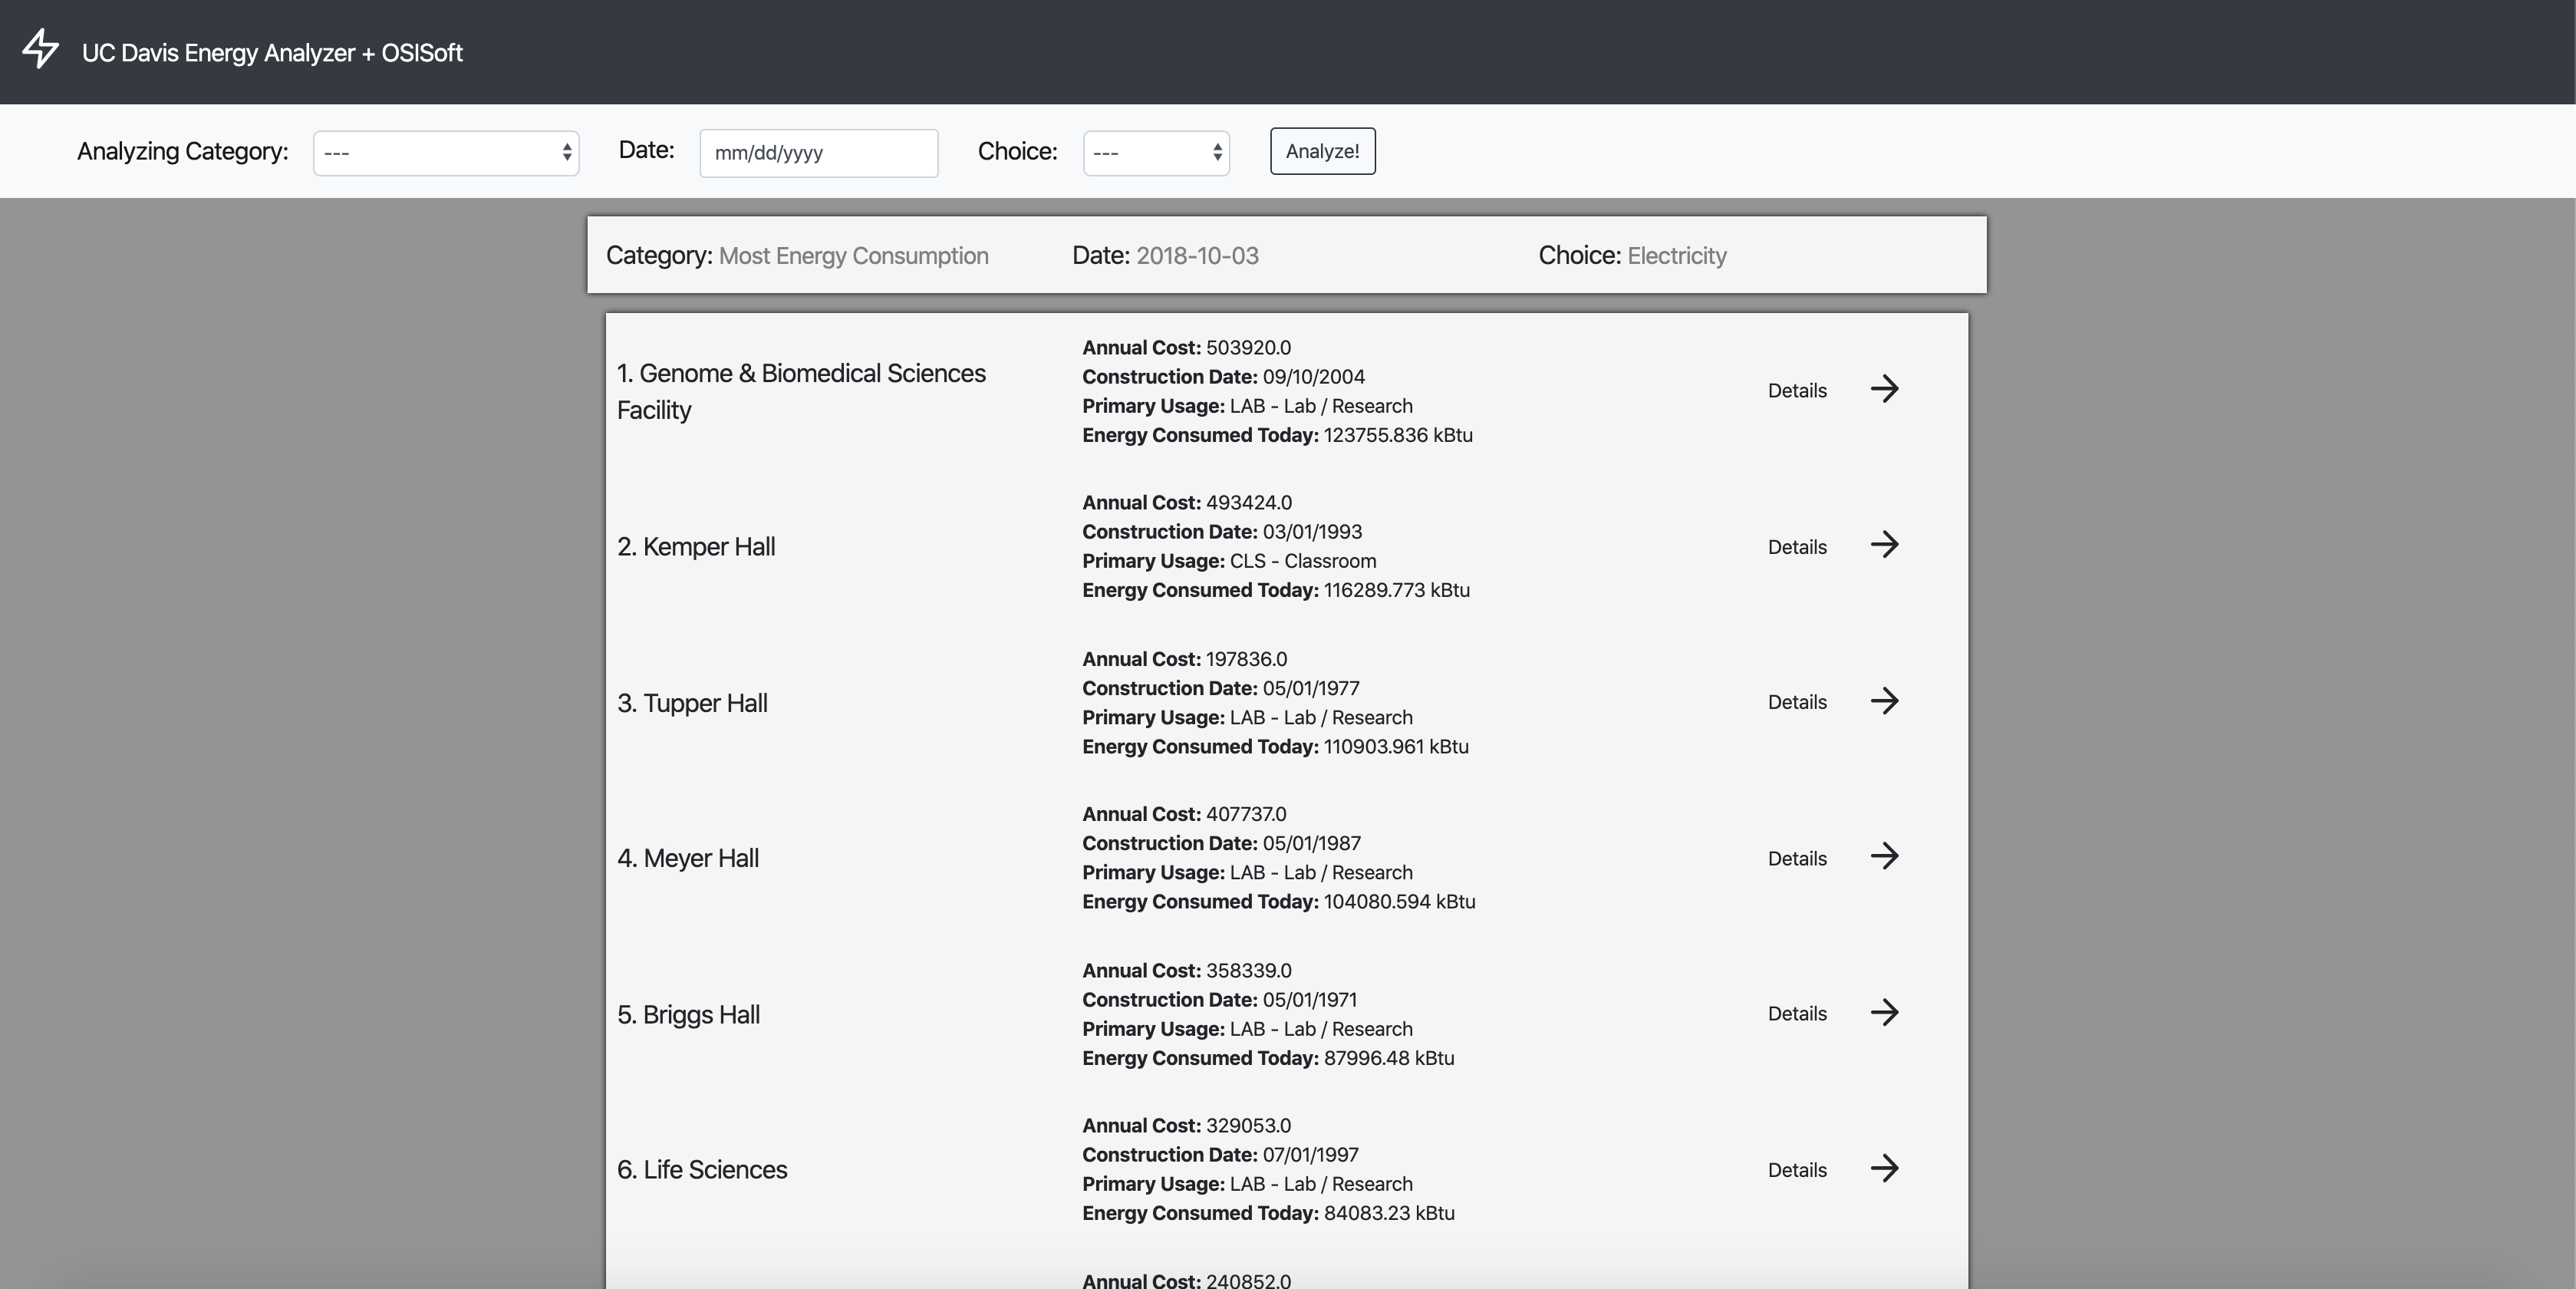
Another detail page of a different building
-

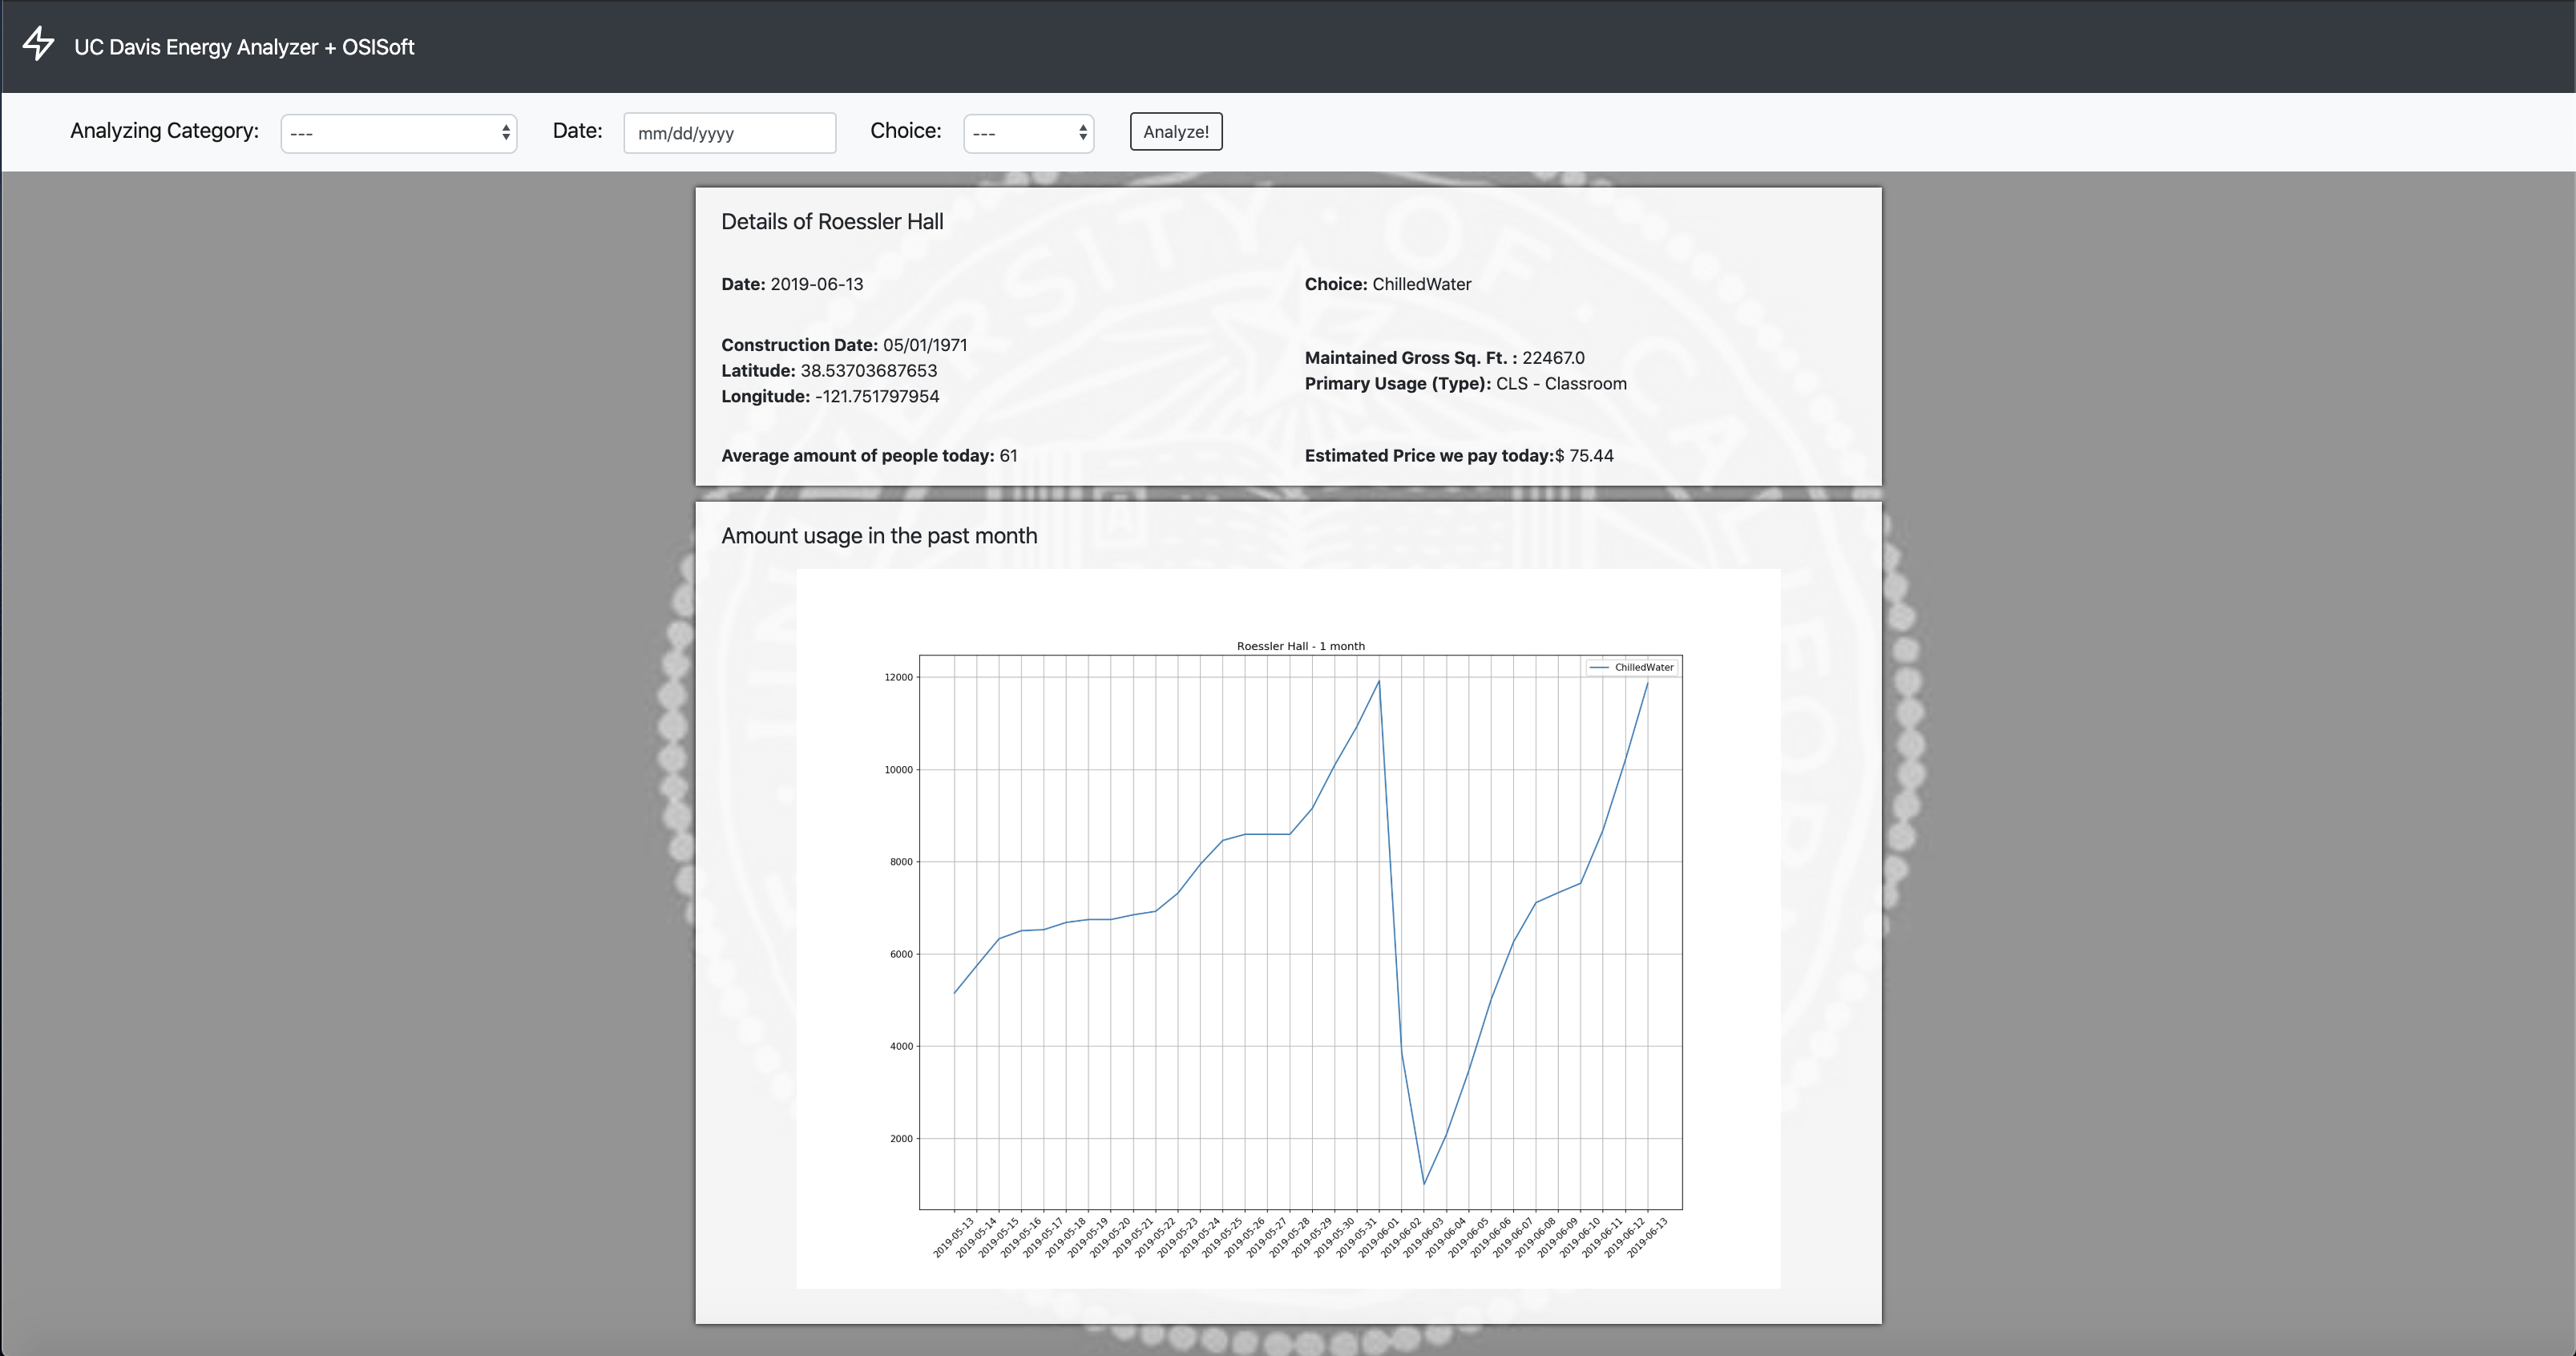
This page shows the details of the building and the graph of the amount of energy usage in the past month

Our Inspiration
After talking to the representatives from the OSISoft team and the UC Davis Facilities engineering team, we were inspired by their challenge of building the 'best Sustainability application' using the OSISoft software. OSISoft believes that people with data can transform the world and that influenced us to take part in this challenge. After analyzing the data, we not only realized that how energy is being consumed in massive quantities, but also analyzed the various driving factors, like steam and chilled water, that affect the consumption and cost of energy. Putting together all of the above in one place, we created an application, "UC Davis Energy Analyzer" that will analyze the various aspects of data and will rank the amount of energy used by each building at UC Davis.
How did we build it?
We used Python Django to set up the back-end of this web application and made use of OSISoft Cloud API to gather real-time data, as well as other web APIs to gather information for WiFi usage and electricity price. We developed our front-end using HTML/CSS, Javascript, and Bootstrap to provide a responsive layout for desktop users. We used popular statistical python libraries such as Matplotlib, Numpy, Pandas to rank the buildings and to graph. We also used JSON to parse .json data.
What does it do?
UC Davis Energy Analyzer uses real-time data from OSISoft Cloud to compute and rank the buildings on the basis of energy-consumption and energy efficiency (buildings that save the most energy vs buildings that save the least) on daily basis. Moreover, it provides a platform to learn more about the possible causes of energy fluctuation by providing a graphic analysis of energy consumed/saved per day, approximating the number of people in the building by using the WiFi data given in the OSISoft Cloud and dividing the average number of devices by 2 ( considering that each person, on an average, uses a mobile and a laptop connected to WiFi). Most importantly, we give the approximate cost of the energy of that building at the given date which can be used to calculate the approximate monthly and annual cost of electricity of the building in that year. If the same is done for every building whose data has been provided to us, UC Davis can get a rough estimate of the annual cost of electricity which it can use to tally the actual annual cost of Electricity to get the accurate representation of its energy consumption.
Challenges we faced
OSISoft data is very detailed and it took us time to figure out its documentation since it was our first time in a hackathon and our first time using this API. Since there are various reasons for the fluctuation of energy and with the massive data available for us to use in such a short time of 24 hours, it took us the first few hours to brainstorm the most impactful way we can utilize the data.


Log in or sign up for Devpost to join the conversation.