-

p1
-

p2
-

p3
-

p4
-

p5
-

p6
-

p7
-

p8
-

p9


Inspiration
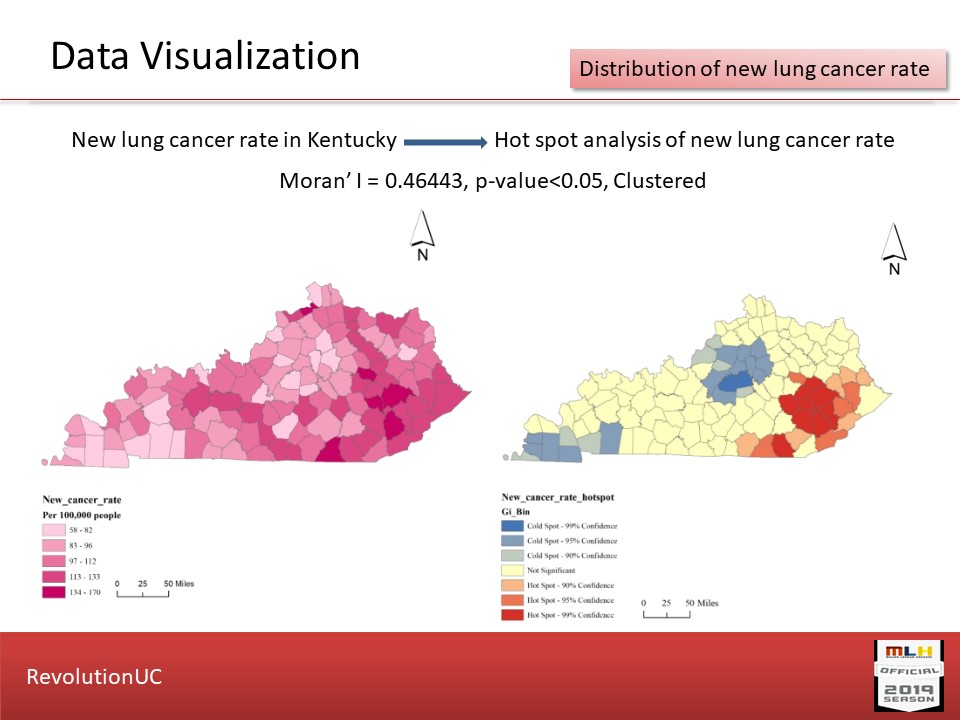
We are motivated by exploring the spatial distribution patterns of rate of new lung cancers, rate of new cancer deaths at county level in Kentucky in 2015, and related socioeconomic contributing factors.
The two main research questions are:
(1) Do a spatial distribution patterns of rate of new lung cancers and rate of new cancer deaths show a cluster distribution in Kentucky?
(2) If the spatial distribution presents a cluster characteristic, where are the hot spots located?
What it does
We proposed to analyse spatial pattern.
How I built it
We built based on ArcGIS 10.3 platform.
Challenges I ran into
How to interpret the spatial patterns in a proper way?
Accomplishments that I'm proud of
We show the spatial patterns of lung cancer distribution
What I learned
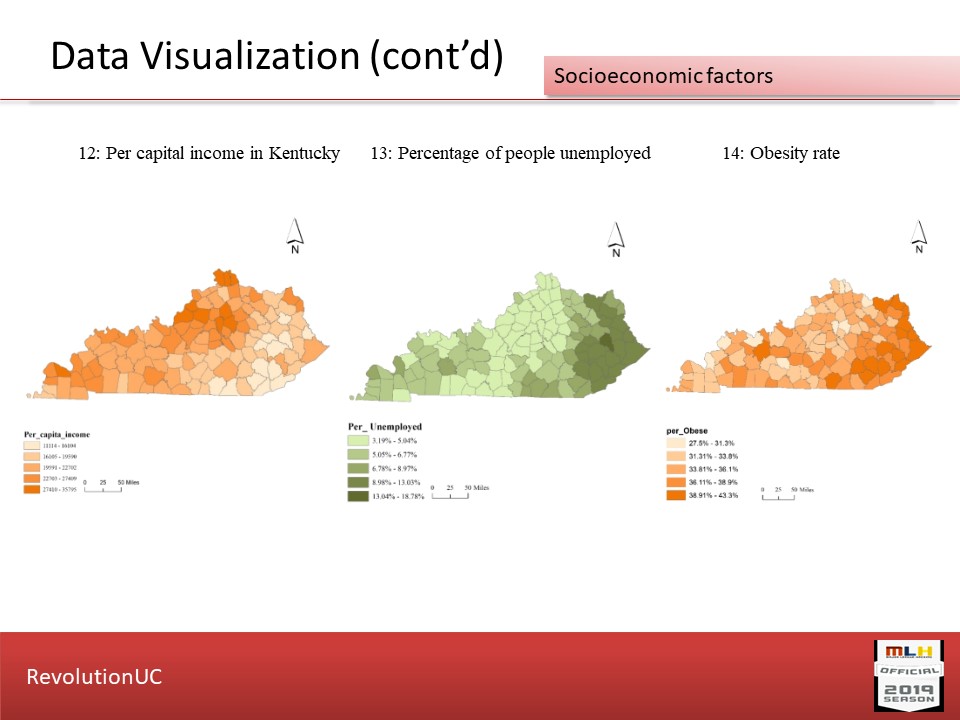
1) Socioeconomic factors can contribute the rate of new lung cancers, rate of new cancer deaths in Kentucky, such as smoking, age, race, education, income, employment.
What's next for UC_bearcats_lung_cancer_study
1) Based on the above observations, we propose a spatial lag regression model for our future study .


Log in or sign up for Devpost to join the conversation.