-

3D Building Electricity Usage Statistics
-

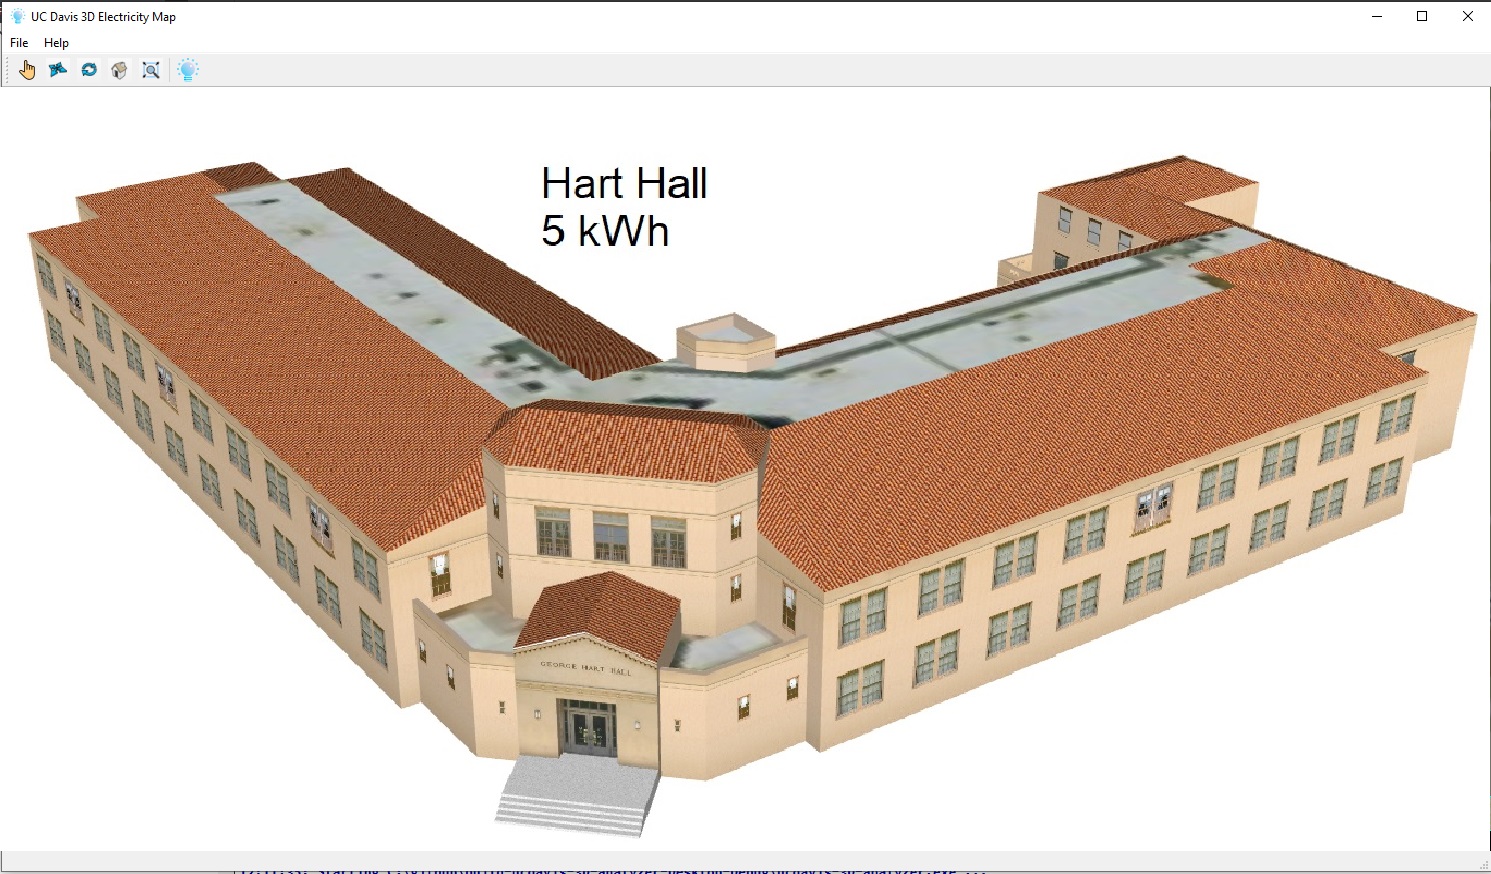
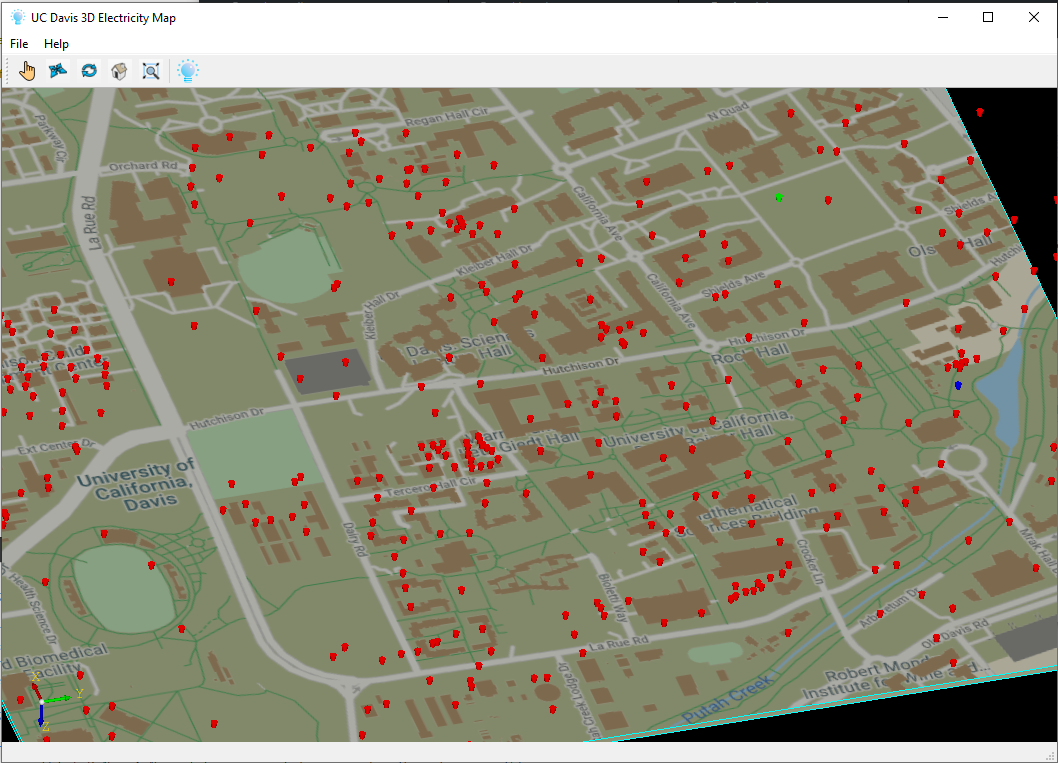
3D Visualization with electricity usage markers
-

Android and iPhone ready framework with QT

Inspiration
There have been great visualization tools built to view UC Davis utility data using OSIsoft technology, but this project takes visualization a step further with beautiful 3D rendering. The goal of this project was to create a creative interface for exploring electricity usage on the UC Davis campus.
What it does
It displays real-time electricity usage of each building with indicated on a 3D map. Markers with a brighter red indicate a larger than baseline electricity usage, while darker indicates less than baseline. Markers may be selected to view the 3D model of the building used by google maps street view with extra meta data about the building. Ideally, this application would be available on an embedded system for building engineers and facility managers to monitor data more interactively. This program could also be used in help kiosks for visitors to easily find buildings on the campus.
How we built it
The desktop application makes API requests to the UC Davis server with OSIsoft Pi technology using the c++ CURL library and parses the JSON encoded response with the c++ rapidJSON library. The rendered data is stored in memory and computed into 3D models using the c++ openCascade library. The application can easily be cross-compiled for linux, macOS, android, and embedded systems using the QT framework.
Challenges we ran into
3D is exciting as it is difficult to model. The visualization part of the project offered challenges rendering the models. The QT framework and openCascade visualization library fought over the openGL context leading to rendering glitches.
Accomplishments that we're proud of
The 3D interface is beautiful and an impressive use of technology.
What we learned
3D desktop applications and cross compiling apps.
What's next for UC Davis 3D Electricity Map
Because of the QT framework used, this application could be cross-compiled for embedded system commonly used by building engineers and facility managers. Facility managers hold the real power to fine tune campus resource usage and could use this tool to provide an intuitive interface for their work. More analysis tools and data integration is needed.


Log in or sign up for Devpost to join the conversation.