-
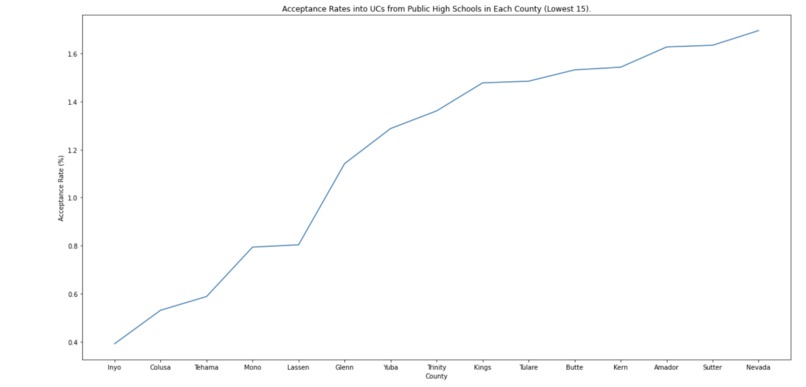
lowest 15 acceptance rates
-
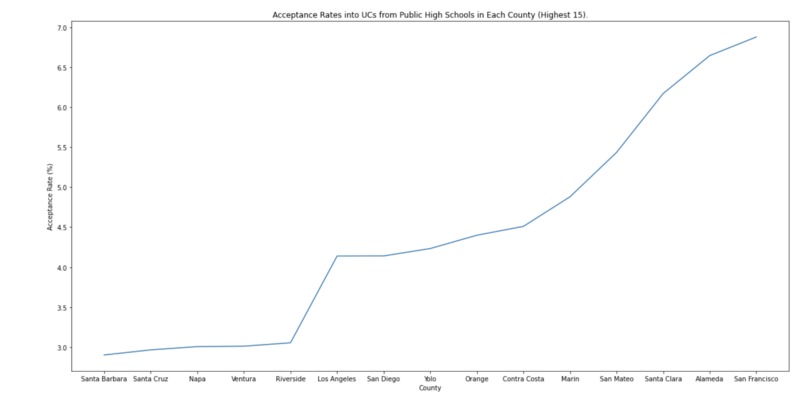
top 15 acceptance rates


Inspiration
We were inspired to do this project because we are high school students in California who would like to see how the public high schools in each county perform. With this data, we wanted to see how well the school system is doing in each county and how the different counties compared with factors such as better education or better external mentorship.
What it does
Using Python, our code takes the amount of students in each county who got admission into different UCs and the total amount of students in each county and converts these two values into percentages. Next, it gets rid of any counties that are missing from either data tables and it plots this data into a graph.
How we built it
First, we created a spreadsheet with how many students attended a public high school in each county. Next, we researched to find data that would provide the number of students in each school who got admission to any UC school and the county which that school is located in. Next, we imported both data charts, using Python. Then, we added up the total amount of students per county who got a UC admission and created a new chart. Next, we merged the two charts together. Next, we calculated the percentages of acceptance rates per county by dividing the number of people who got admission by how many people attend a public school in that county. We added these percentages as a series into our data table. Then, we converted the column containing the county names and the column containing the percentages into arrays. Finally, using the arrays(with the county names as the x-axis and the percentages as the y-axis), we plotted the data into a line graph.
Challenges we ran into
Initially, we struggled with merging the two data tables together since some county names weren't provided in one data table while it was in another. We struggled with formatting since sometimes some of the headers were not located on the same row as the others. One of our big offsets was that neither of us had much Python experience so, it took some time trying to figure out how to write our code.
Accomplishments that we're proud of
We are proud that we managed to code using Python since we both have only ever used Java. We are also proud that we could plot our graphs
What we learned
Both of us became more experienced while coding in Python. Additionally, we learned different methods(in Pandas) that we can use for Python. This includes " .concat( )", " .merge( )", and " .plot( )"
What's next for UC Acceptance Rates per California Counties
To carry forward this project, we would look more in depth of the acceptance rates dependent on the major of the applicants. To elaborate, we could see the success rates of each major and see whether one ensures more of a chance to get into a UC than another.
Built With
- jupyternotebook
- python

Log in or sign up for Devpost to join the conversation.