-
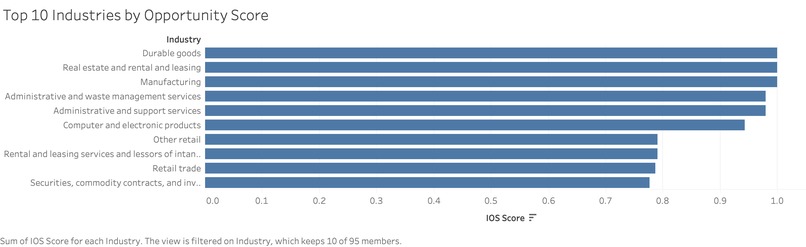
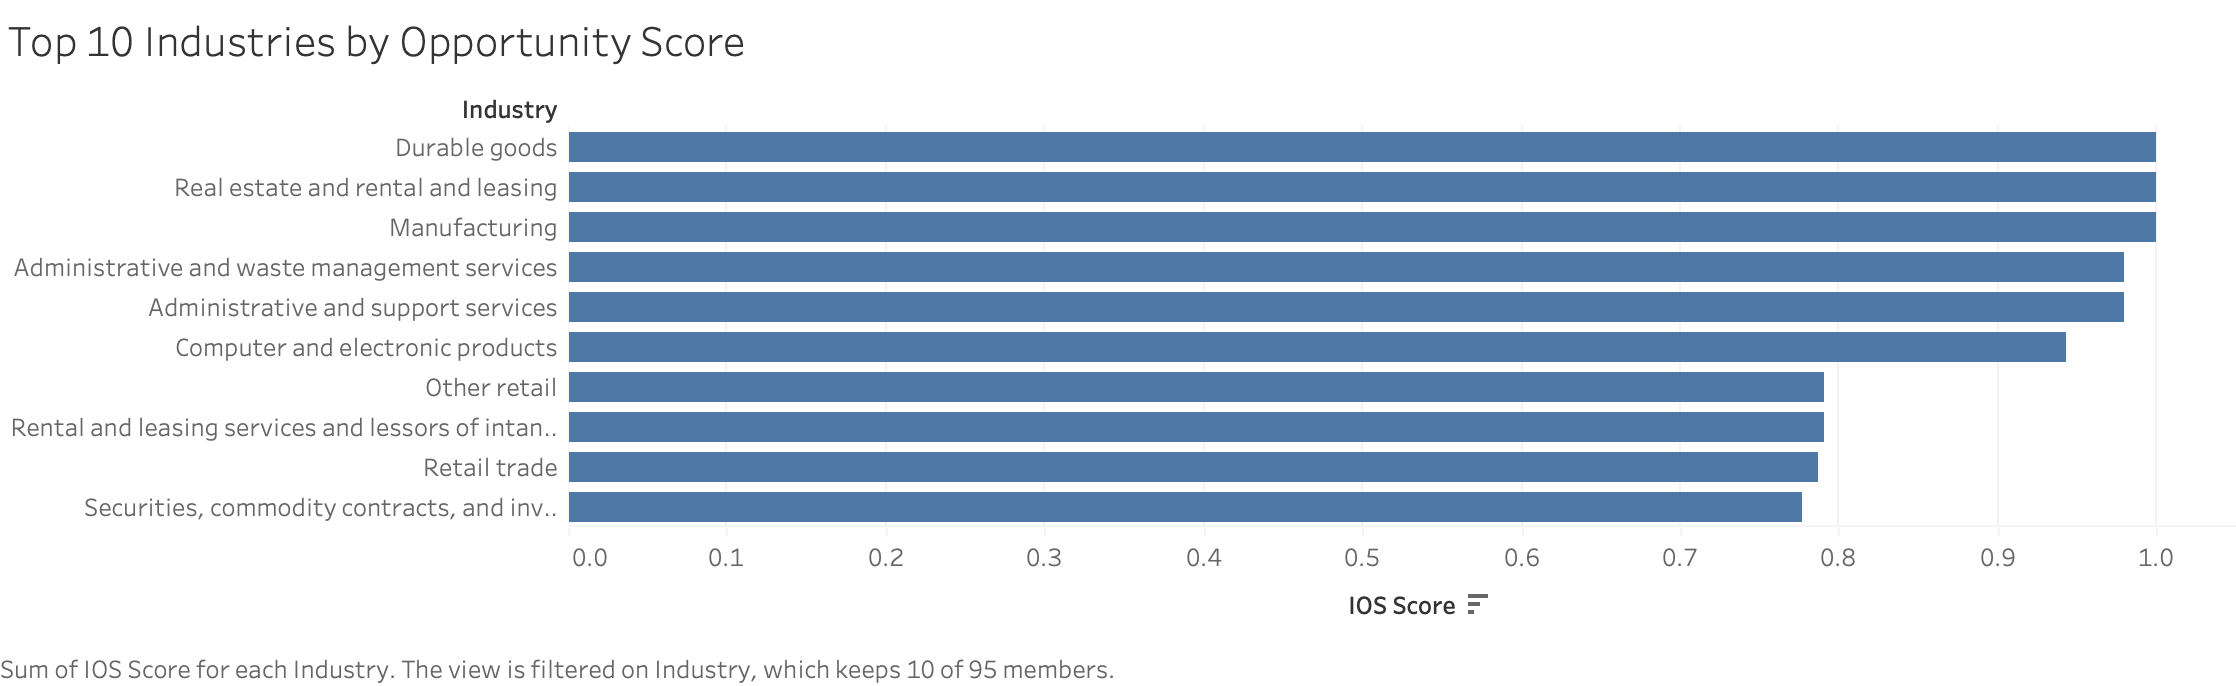
Top 10 by Opportunity Score
-
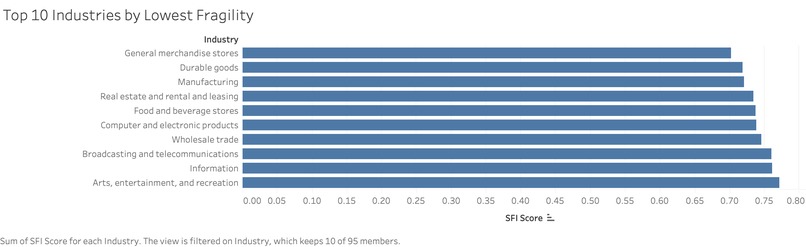
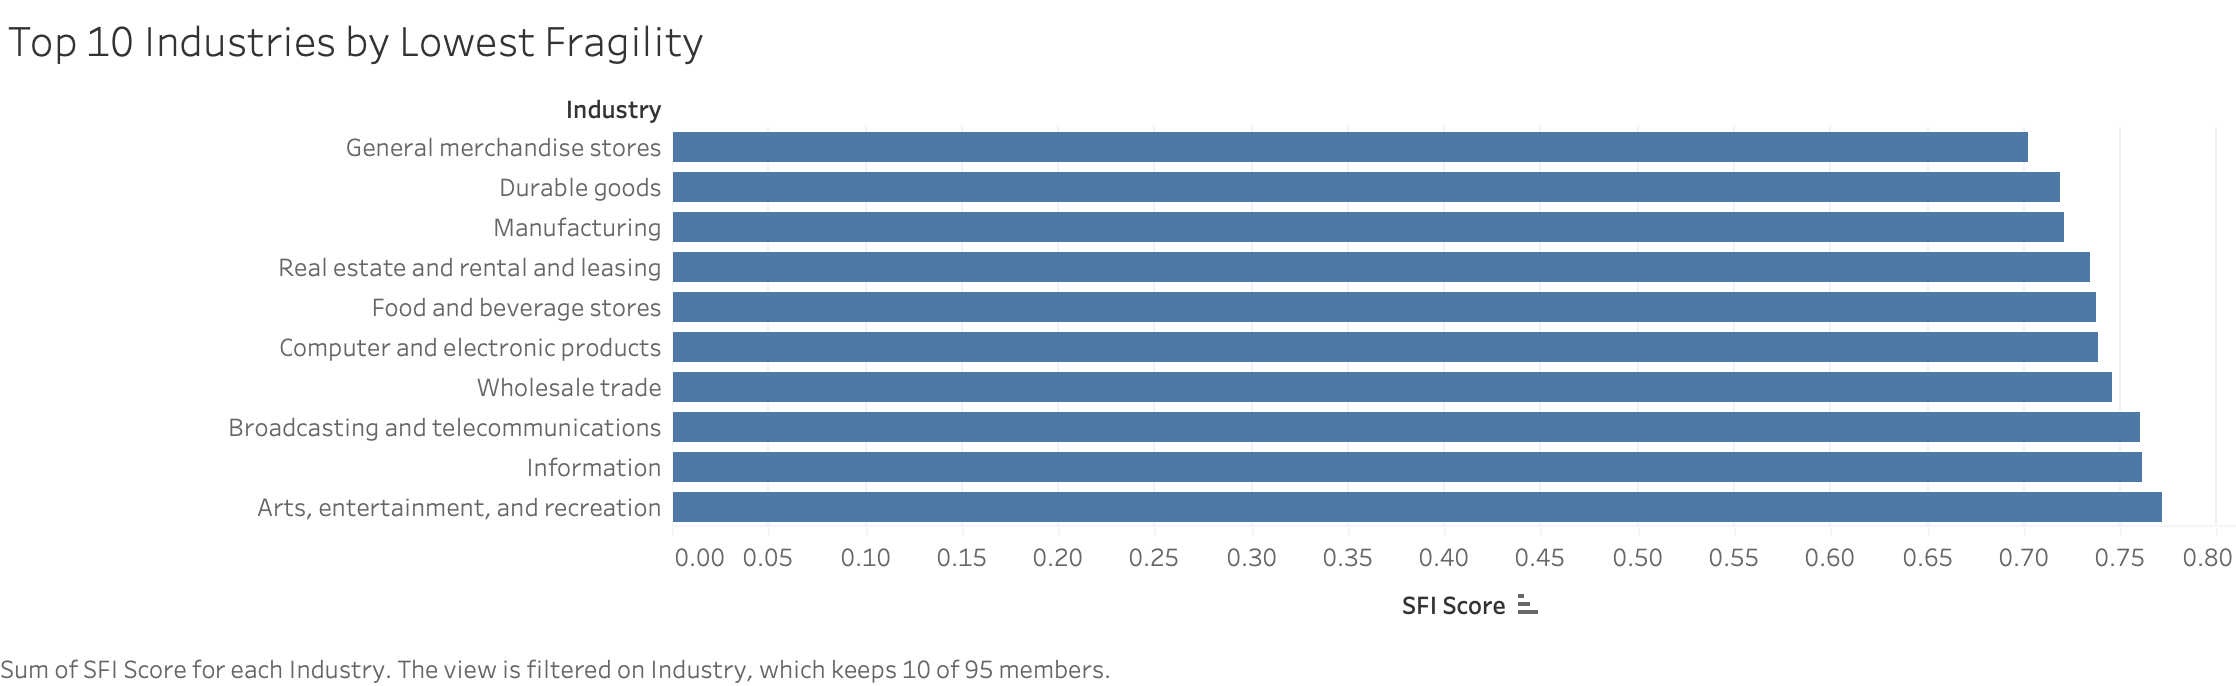
Top 10 by Fragility Score
-
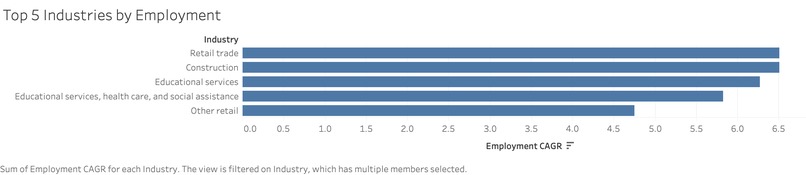
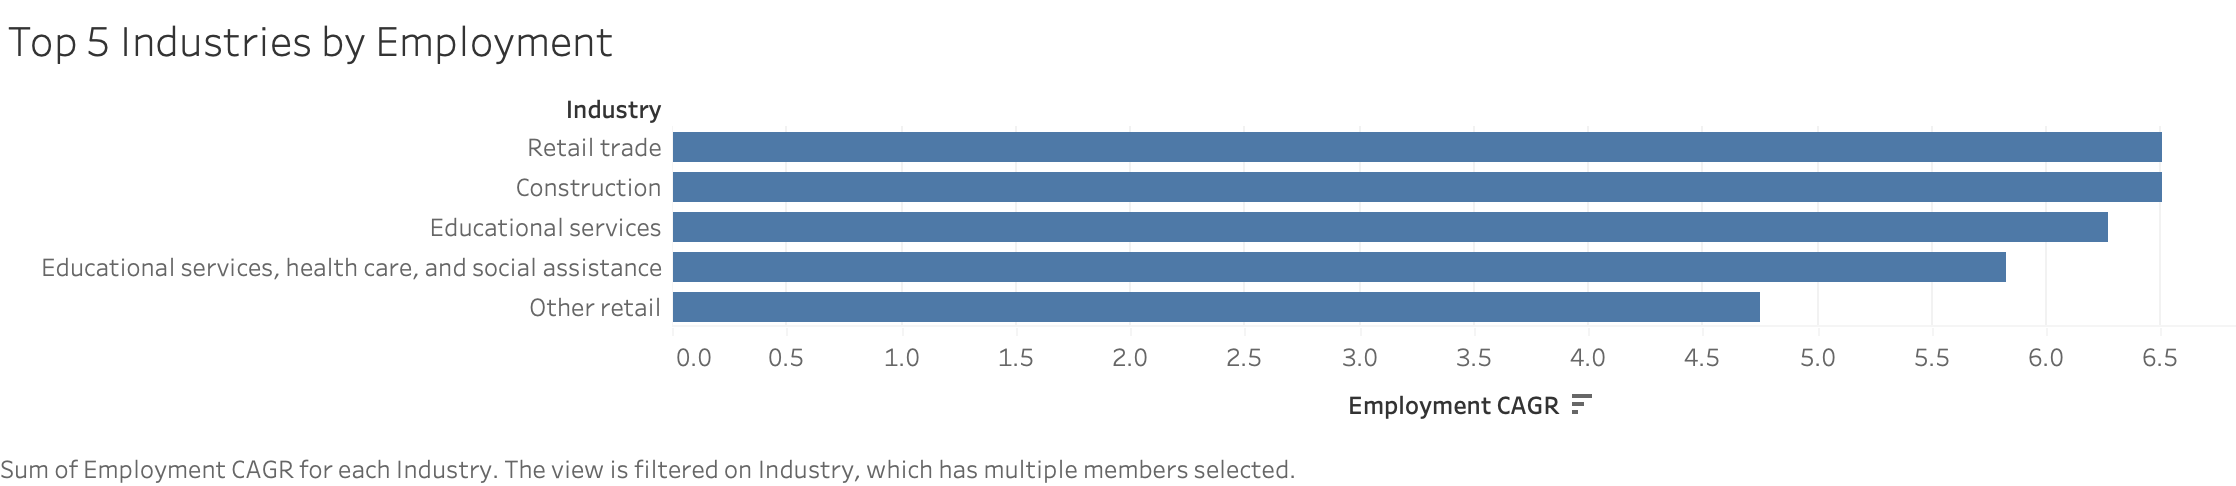
Top 5 Employment
-
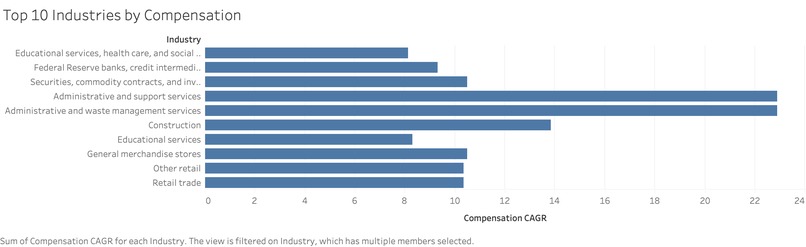
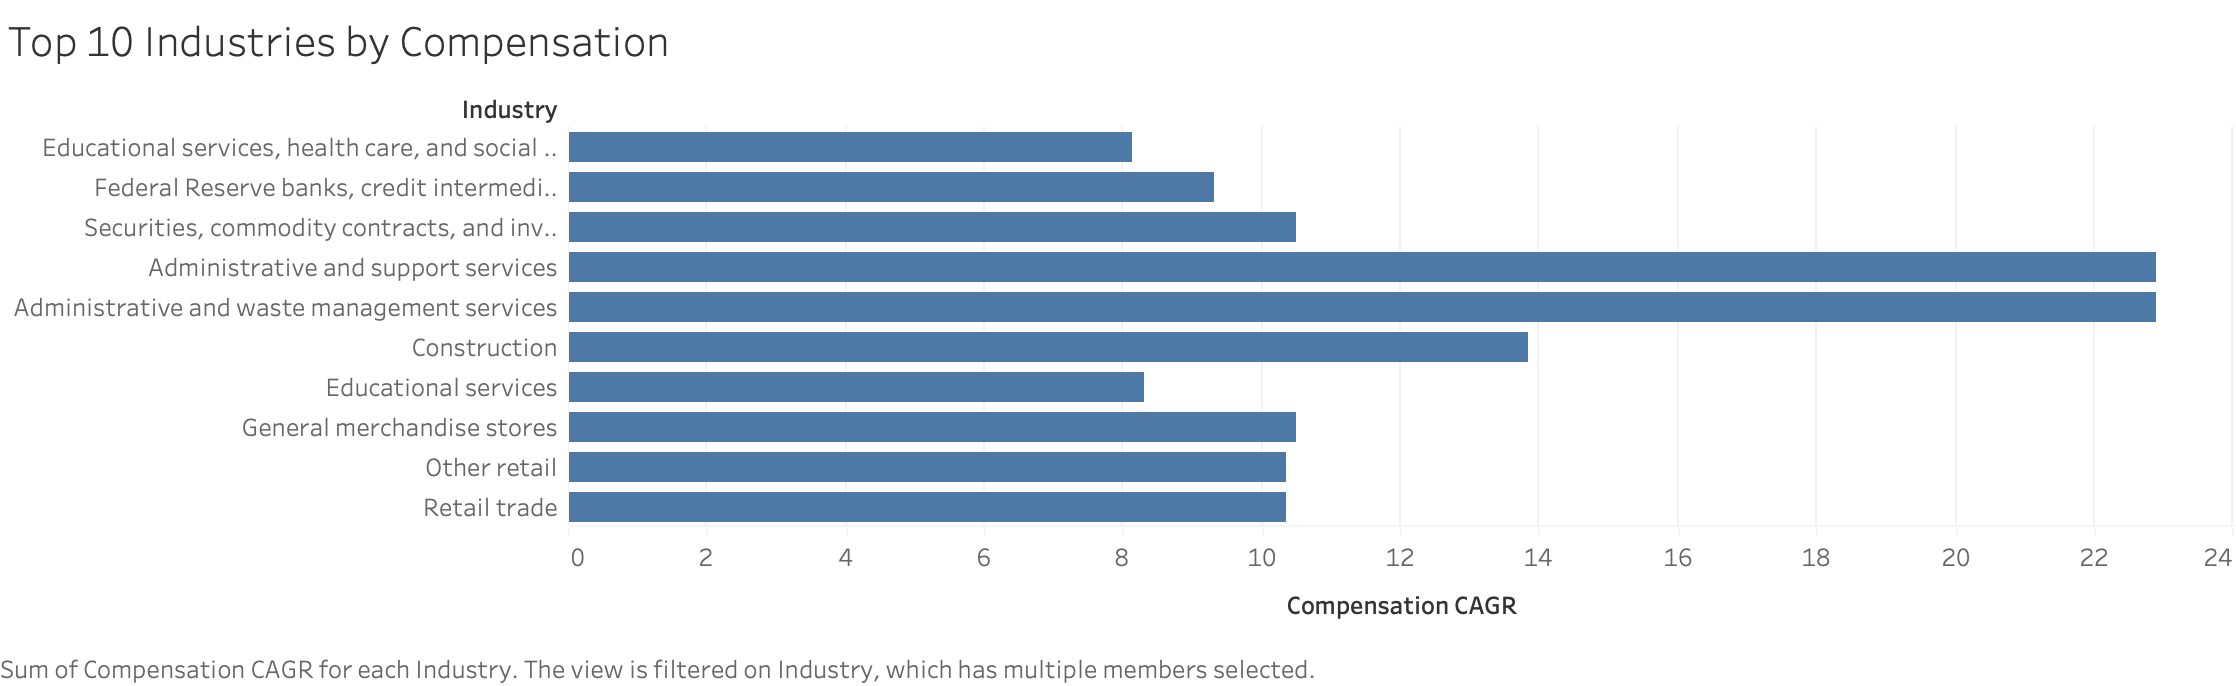
Top 10 Compensation
-
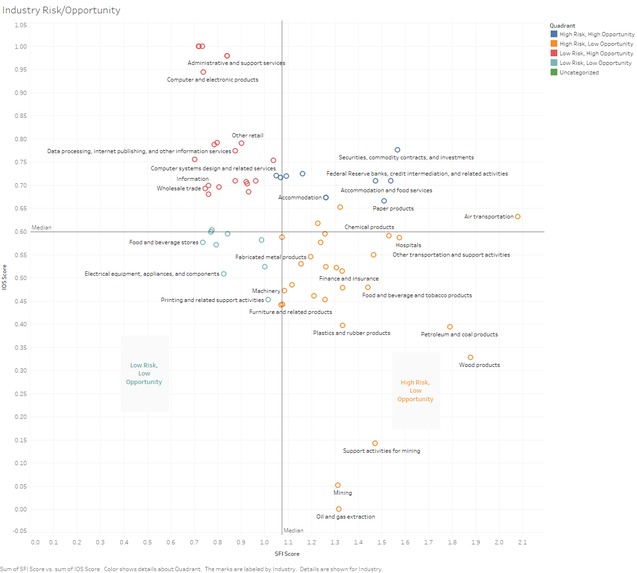
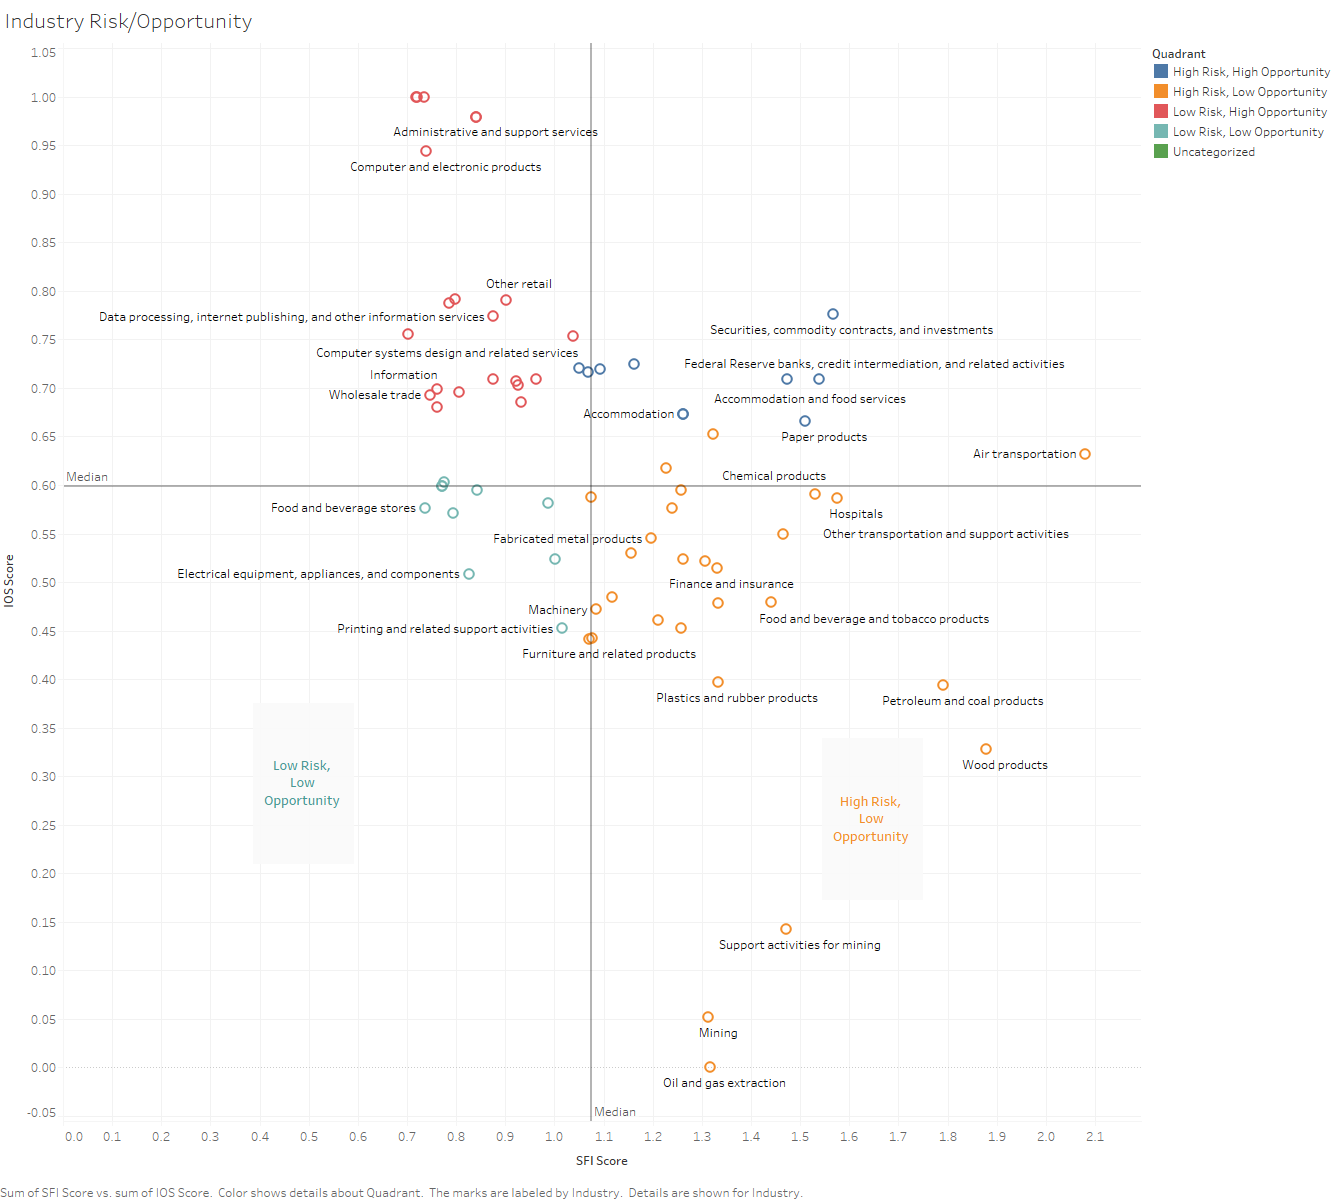
Quandrant by Industry
Inspiration
he U.S. space economy is a landscape of immense promise and significant capital, yet for policymakers and investors, making strategic decisions is often based on broad trends rather than granular data. We were inspired to create a real-world, useful tool to bridge this gap.
Our goal was to move beyond the hype and provide these key decision-makers with a clear, data-driven framework. For policymakers, this tool can help identify which sectors are self-sustaining versus those that might be fragile and require strategic support. For investors, it serves as a guide to distinguish high-potential growth opportunities from hidden risks, enabling smarter and more effective capital allocation.
What it does
This project analyzes over a decade of U.S. federal economic data to classify every sector of the private space economy. It transforms raw numbers into a clear, strategic assessment by categorizing each industry into one of four quadrants: Prospect, Healthy, Volatile, and Fragile
How we built it
The project was built entirely in a Python environment using the pandas library for data manipulation and analysis. Our process began with ingesting and cleaning multiple tables from the U.S. Bureau of Economic Analysis "Space Economy" dataset, focusing on Real Gross Output, Employment, and Compensation from 2012-2023. We then calculated three core performance metrics for each industry: the Compound Annual Growth Rate (CAGR) to measure average annual growth, Volatility using the standard deviation of annual percentage change, and Market Scale based on the industry's share of the total space economy. These metrics were then normalized and combined into our final SFI and IOS scores, which drove the classification.
Challenges we ran into
Our primary challenges were related to data cleaning and alignment. The various data tables from the BEA were not perfectly consistent; industry names had subtle differences, like extra whitespace, and the lists of industries were not identical across tables. We also had to carefully consider which economic metric—Real Gross Output versus Real Value Added—was the most appropriate for our risk assessment.
Accomplishments that we're proud of
We are most proud of creating a comprehensive, end-to-end analysis that transforms complex, raw government data into a simple and actionable classification system. Developing the SFI and IOS scores provided a quantifiable and objective way to compare dozens of disparate industries. Overcoming the significant data alignment challenges to produce a single, clean, and reliable master dataset was a major accomplishment that formed the foundation of the entire project.
What we learned
This project was a deep dive into the realities of data analysis. We learned that data cleaning is not just a preliminary step but a core part of the analytical process. The debate over using Real Gross Output vs. Real Value Added taught us that choosing the right metric is critical, as it frames the entire story your data tells.
What's next for U.S. Space Industry: A Risk and Opportunity Classification
The next logical step is to bring this analysis to life through an interactive dashboard. Using a tool like Plotly or Google Looker Studio, we can create a public-facing platform where users can explore the data, filter by industry, and visualize the risk and opportunity quadrants. Further enhancements could involve incorporating additional datasets, such as venture capital funding or government contract awards, to add even more depth to the opportunity and fragility scores.

Log in or sign up for Devpost to join the conversation.