

Inspiration
I strongly believe that visualizations is the best form of presentation. Yet if you sit in any lecture or meeting, all you get are bullet points. Type diagram is a diagramming solution provided as an Office add that tries to alleviate this problem.
What it does
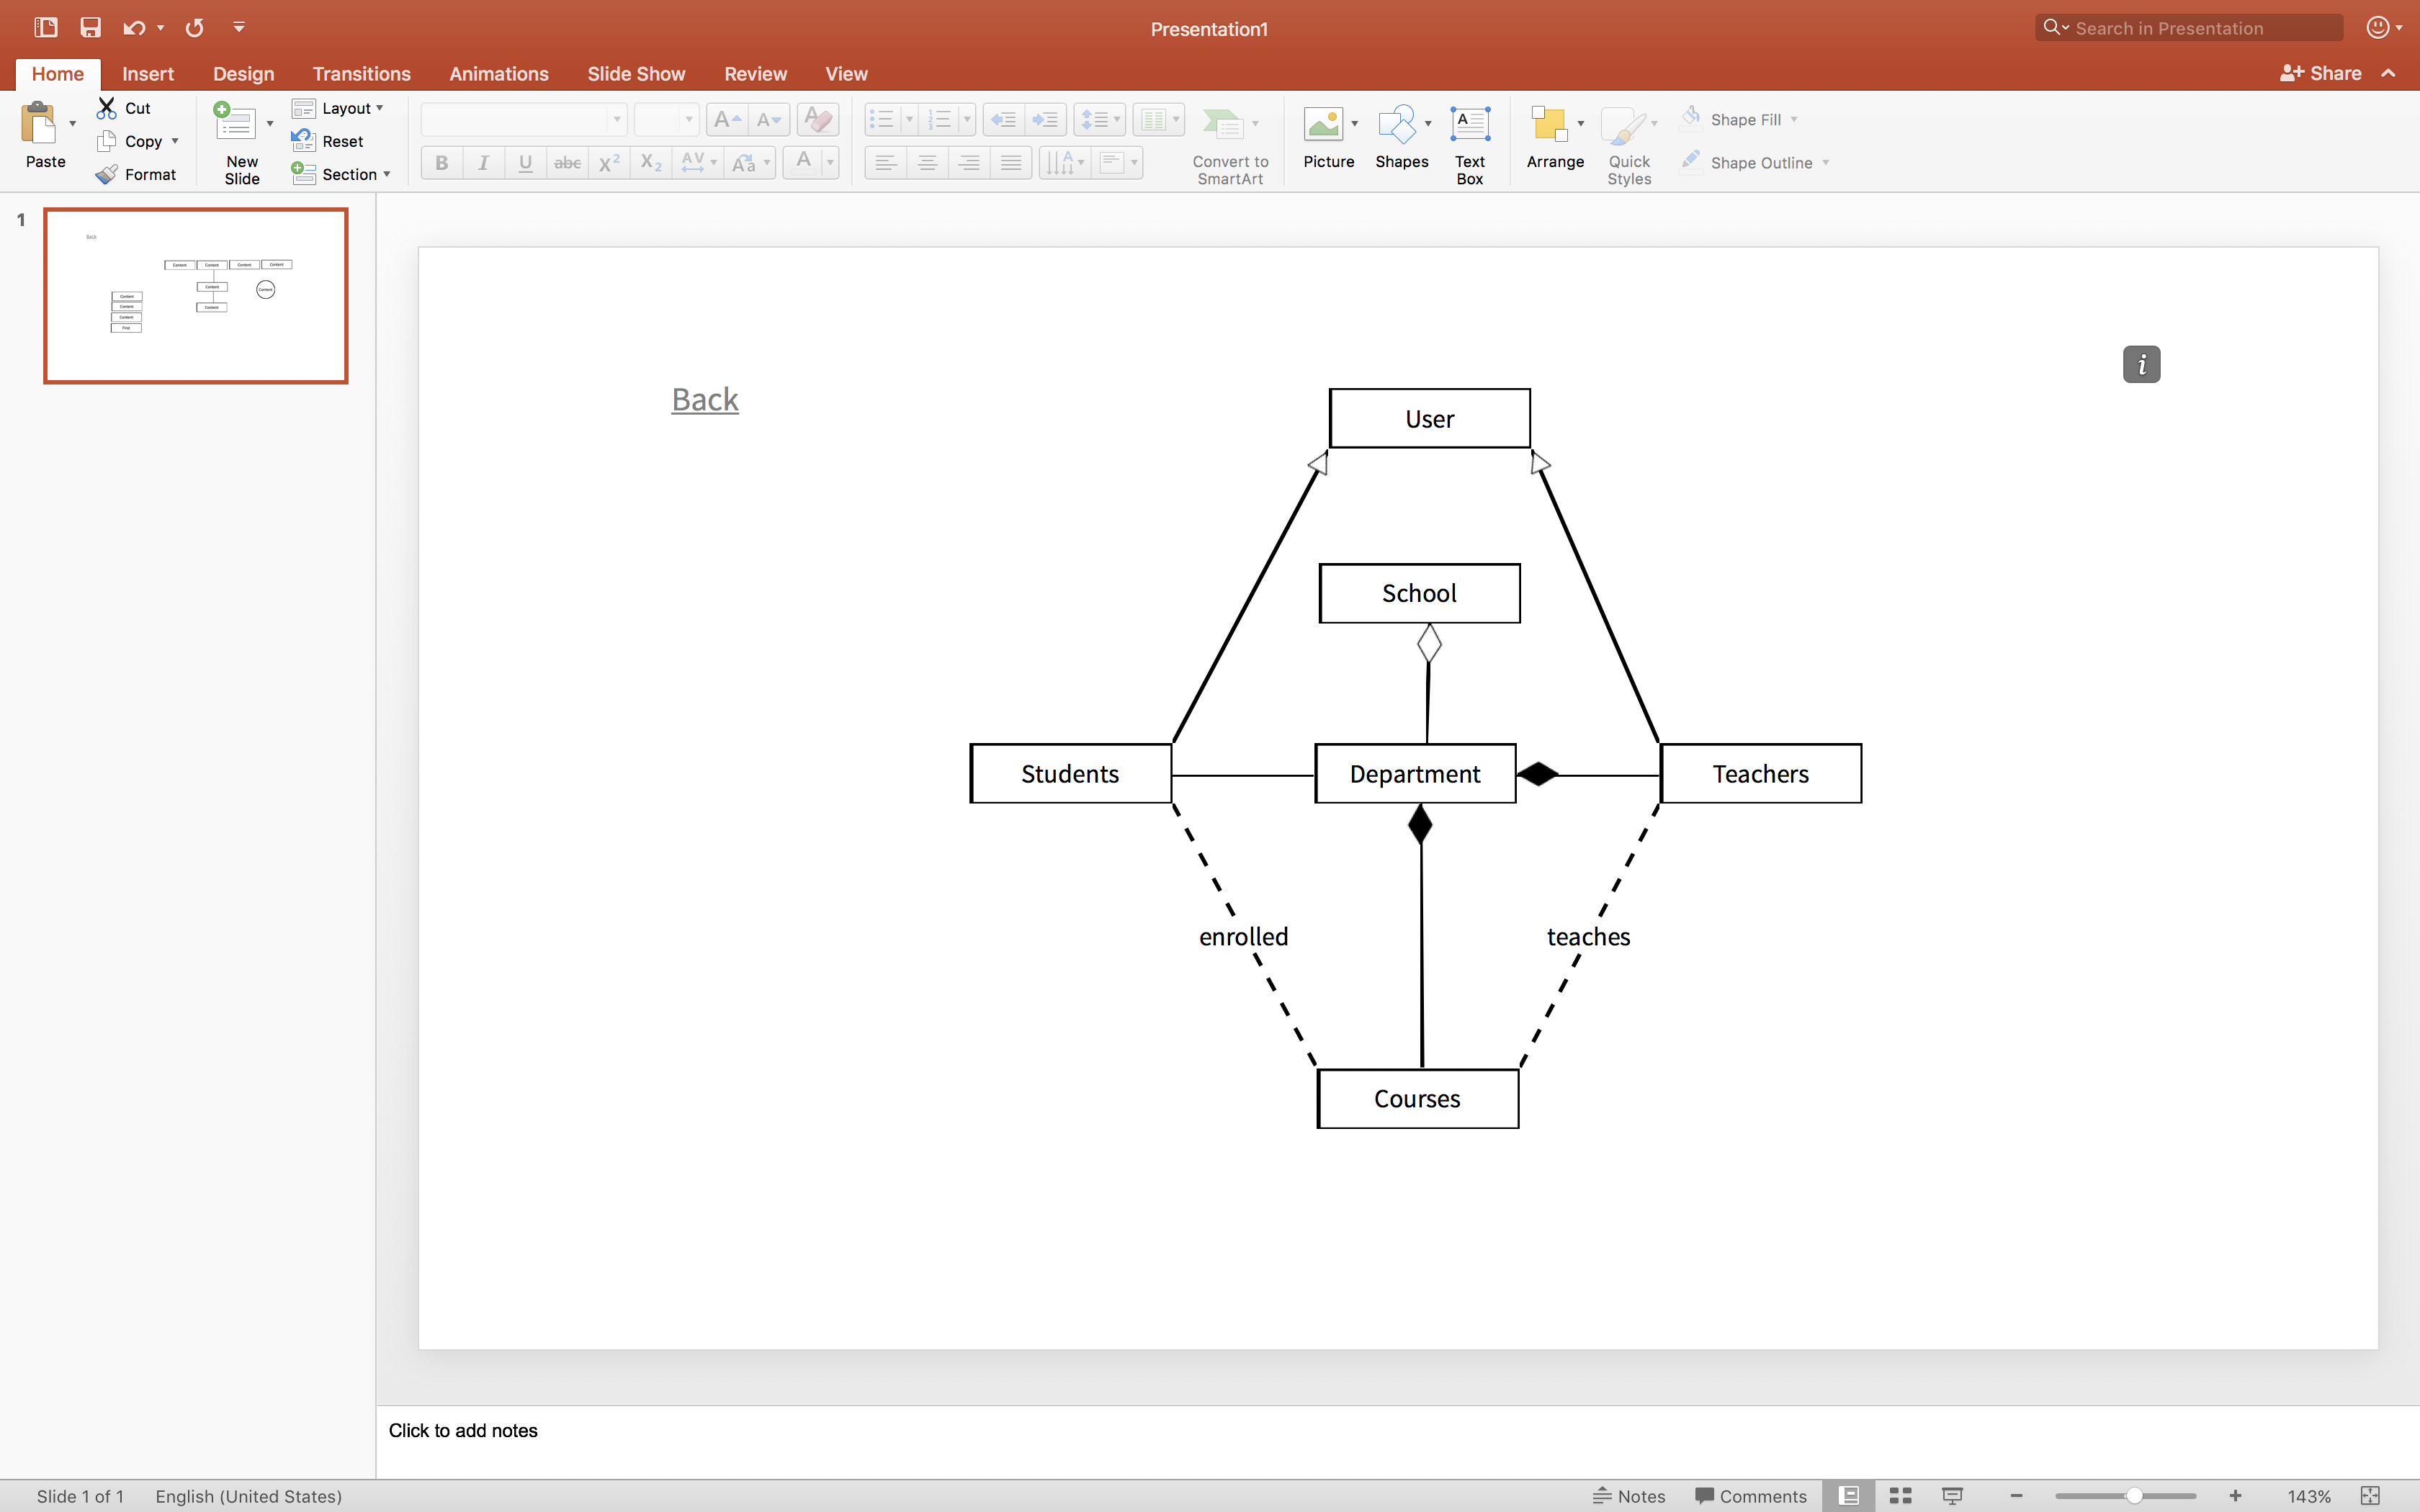
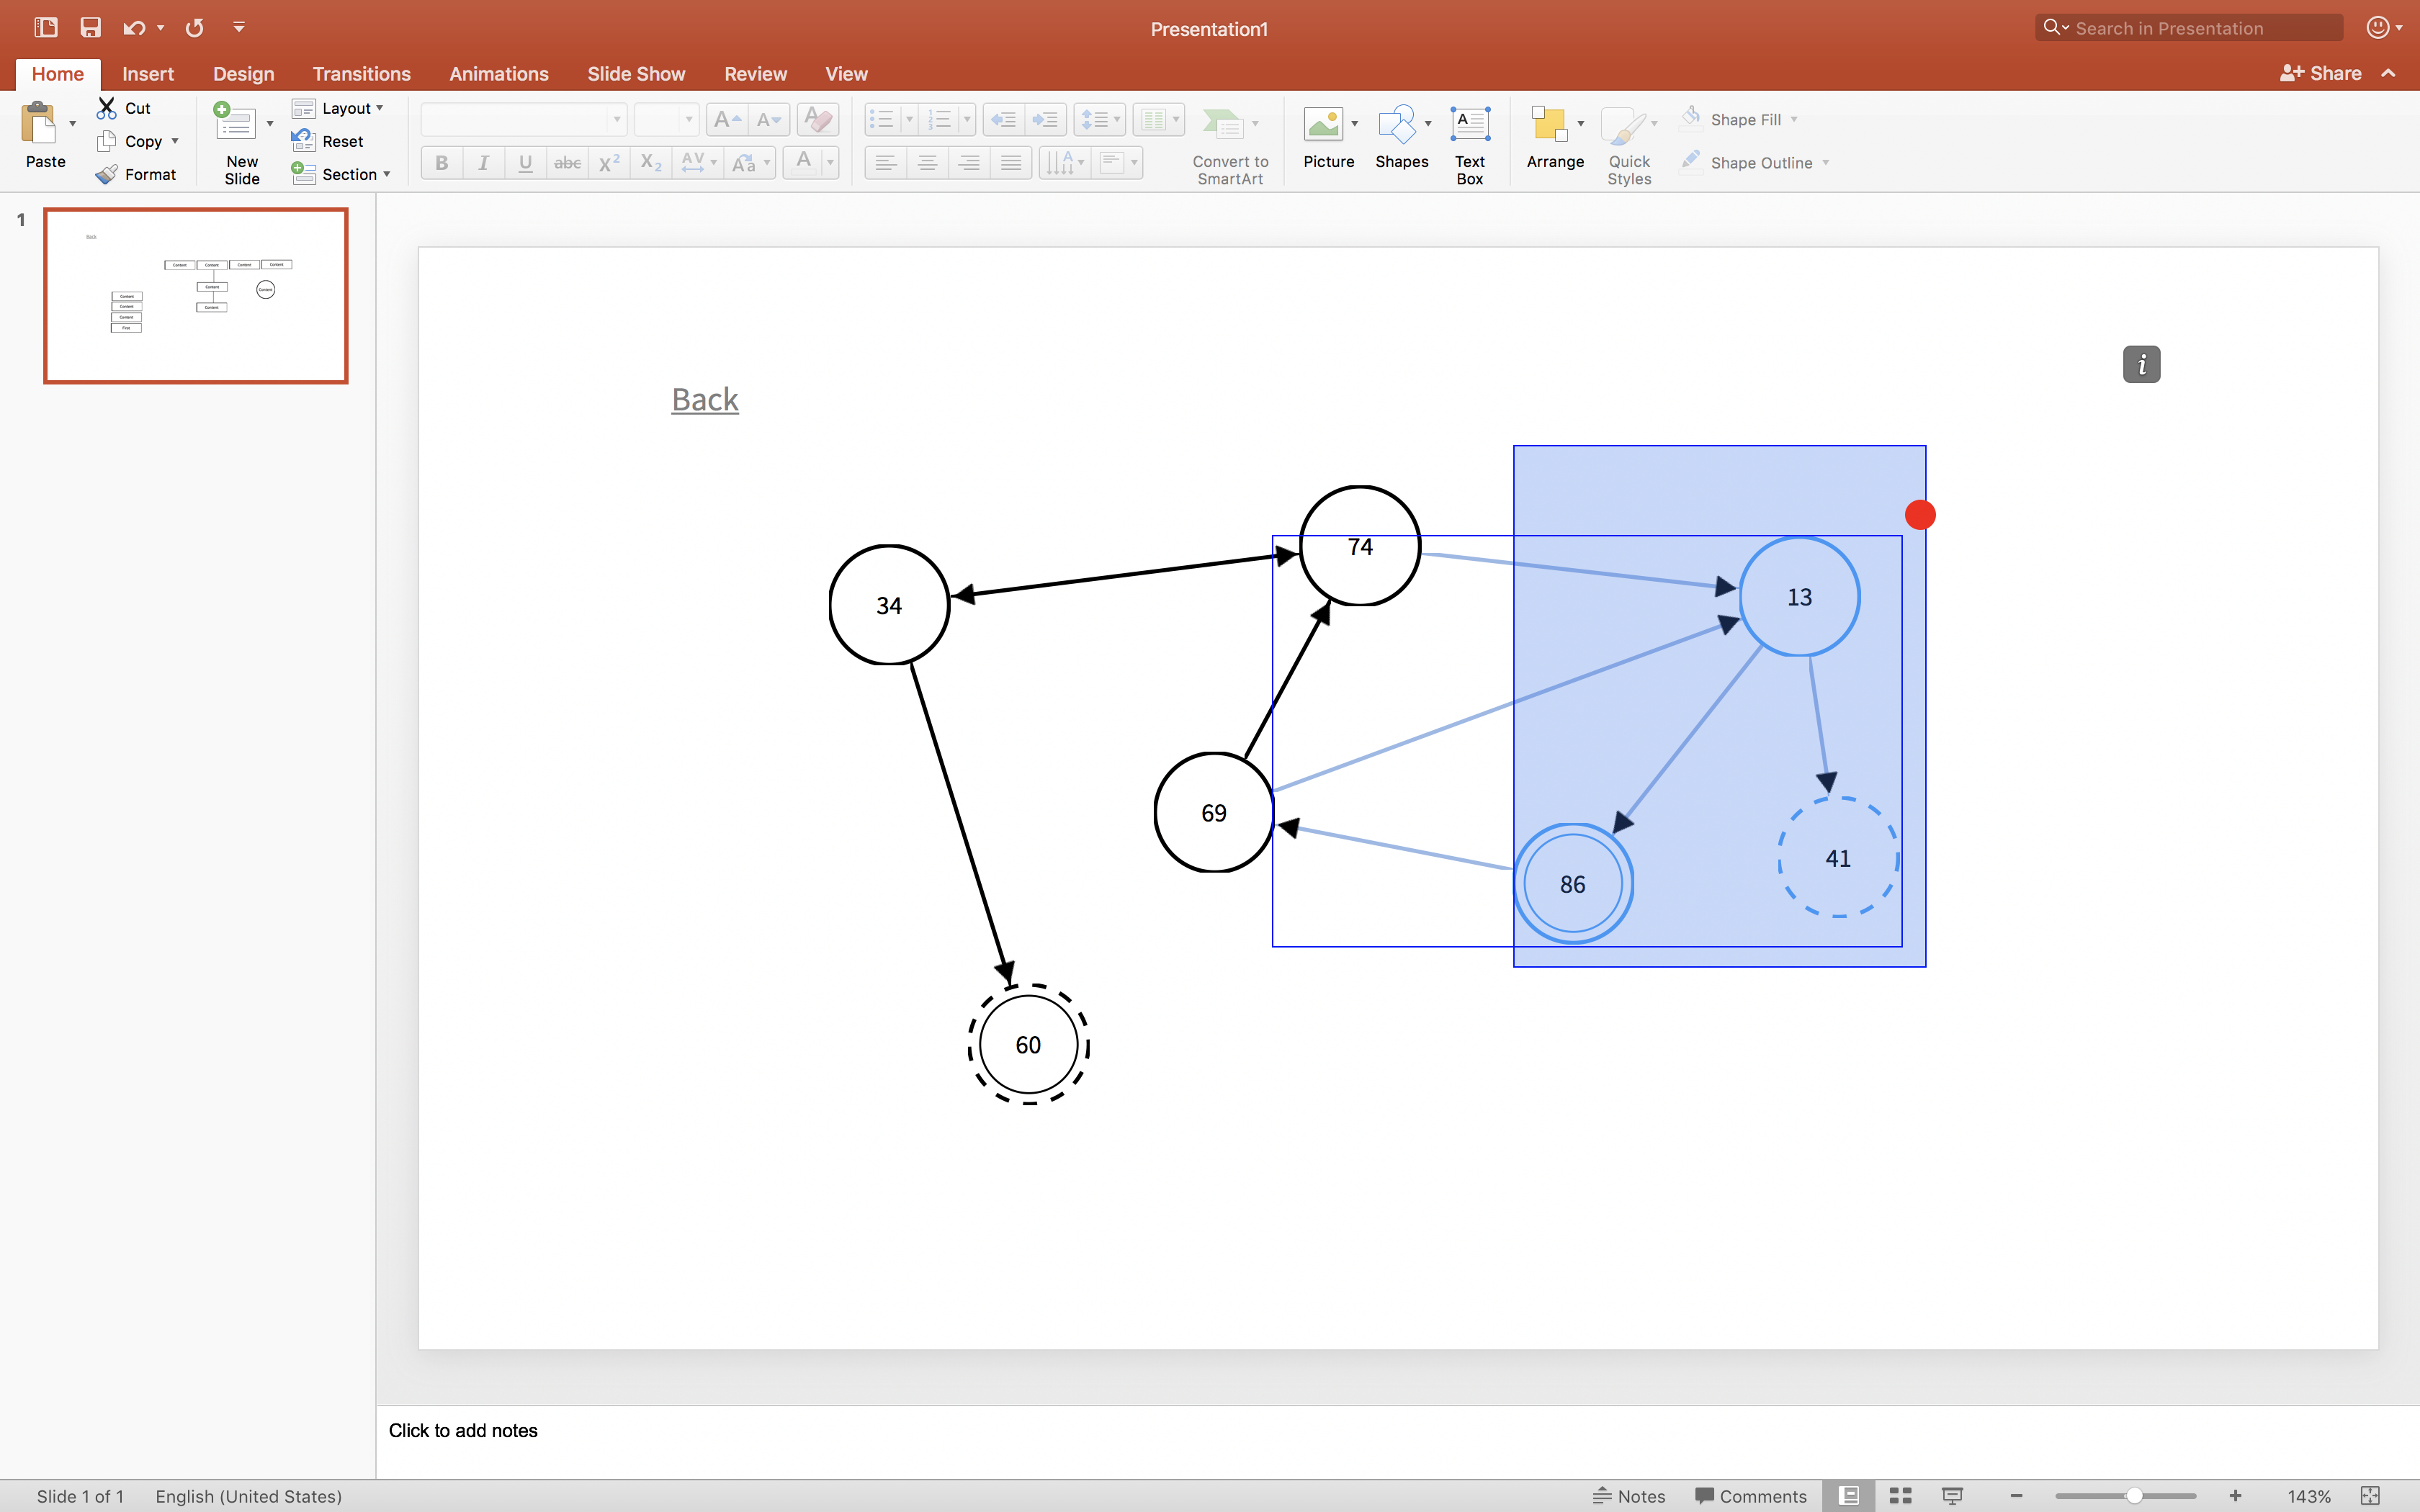
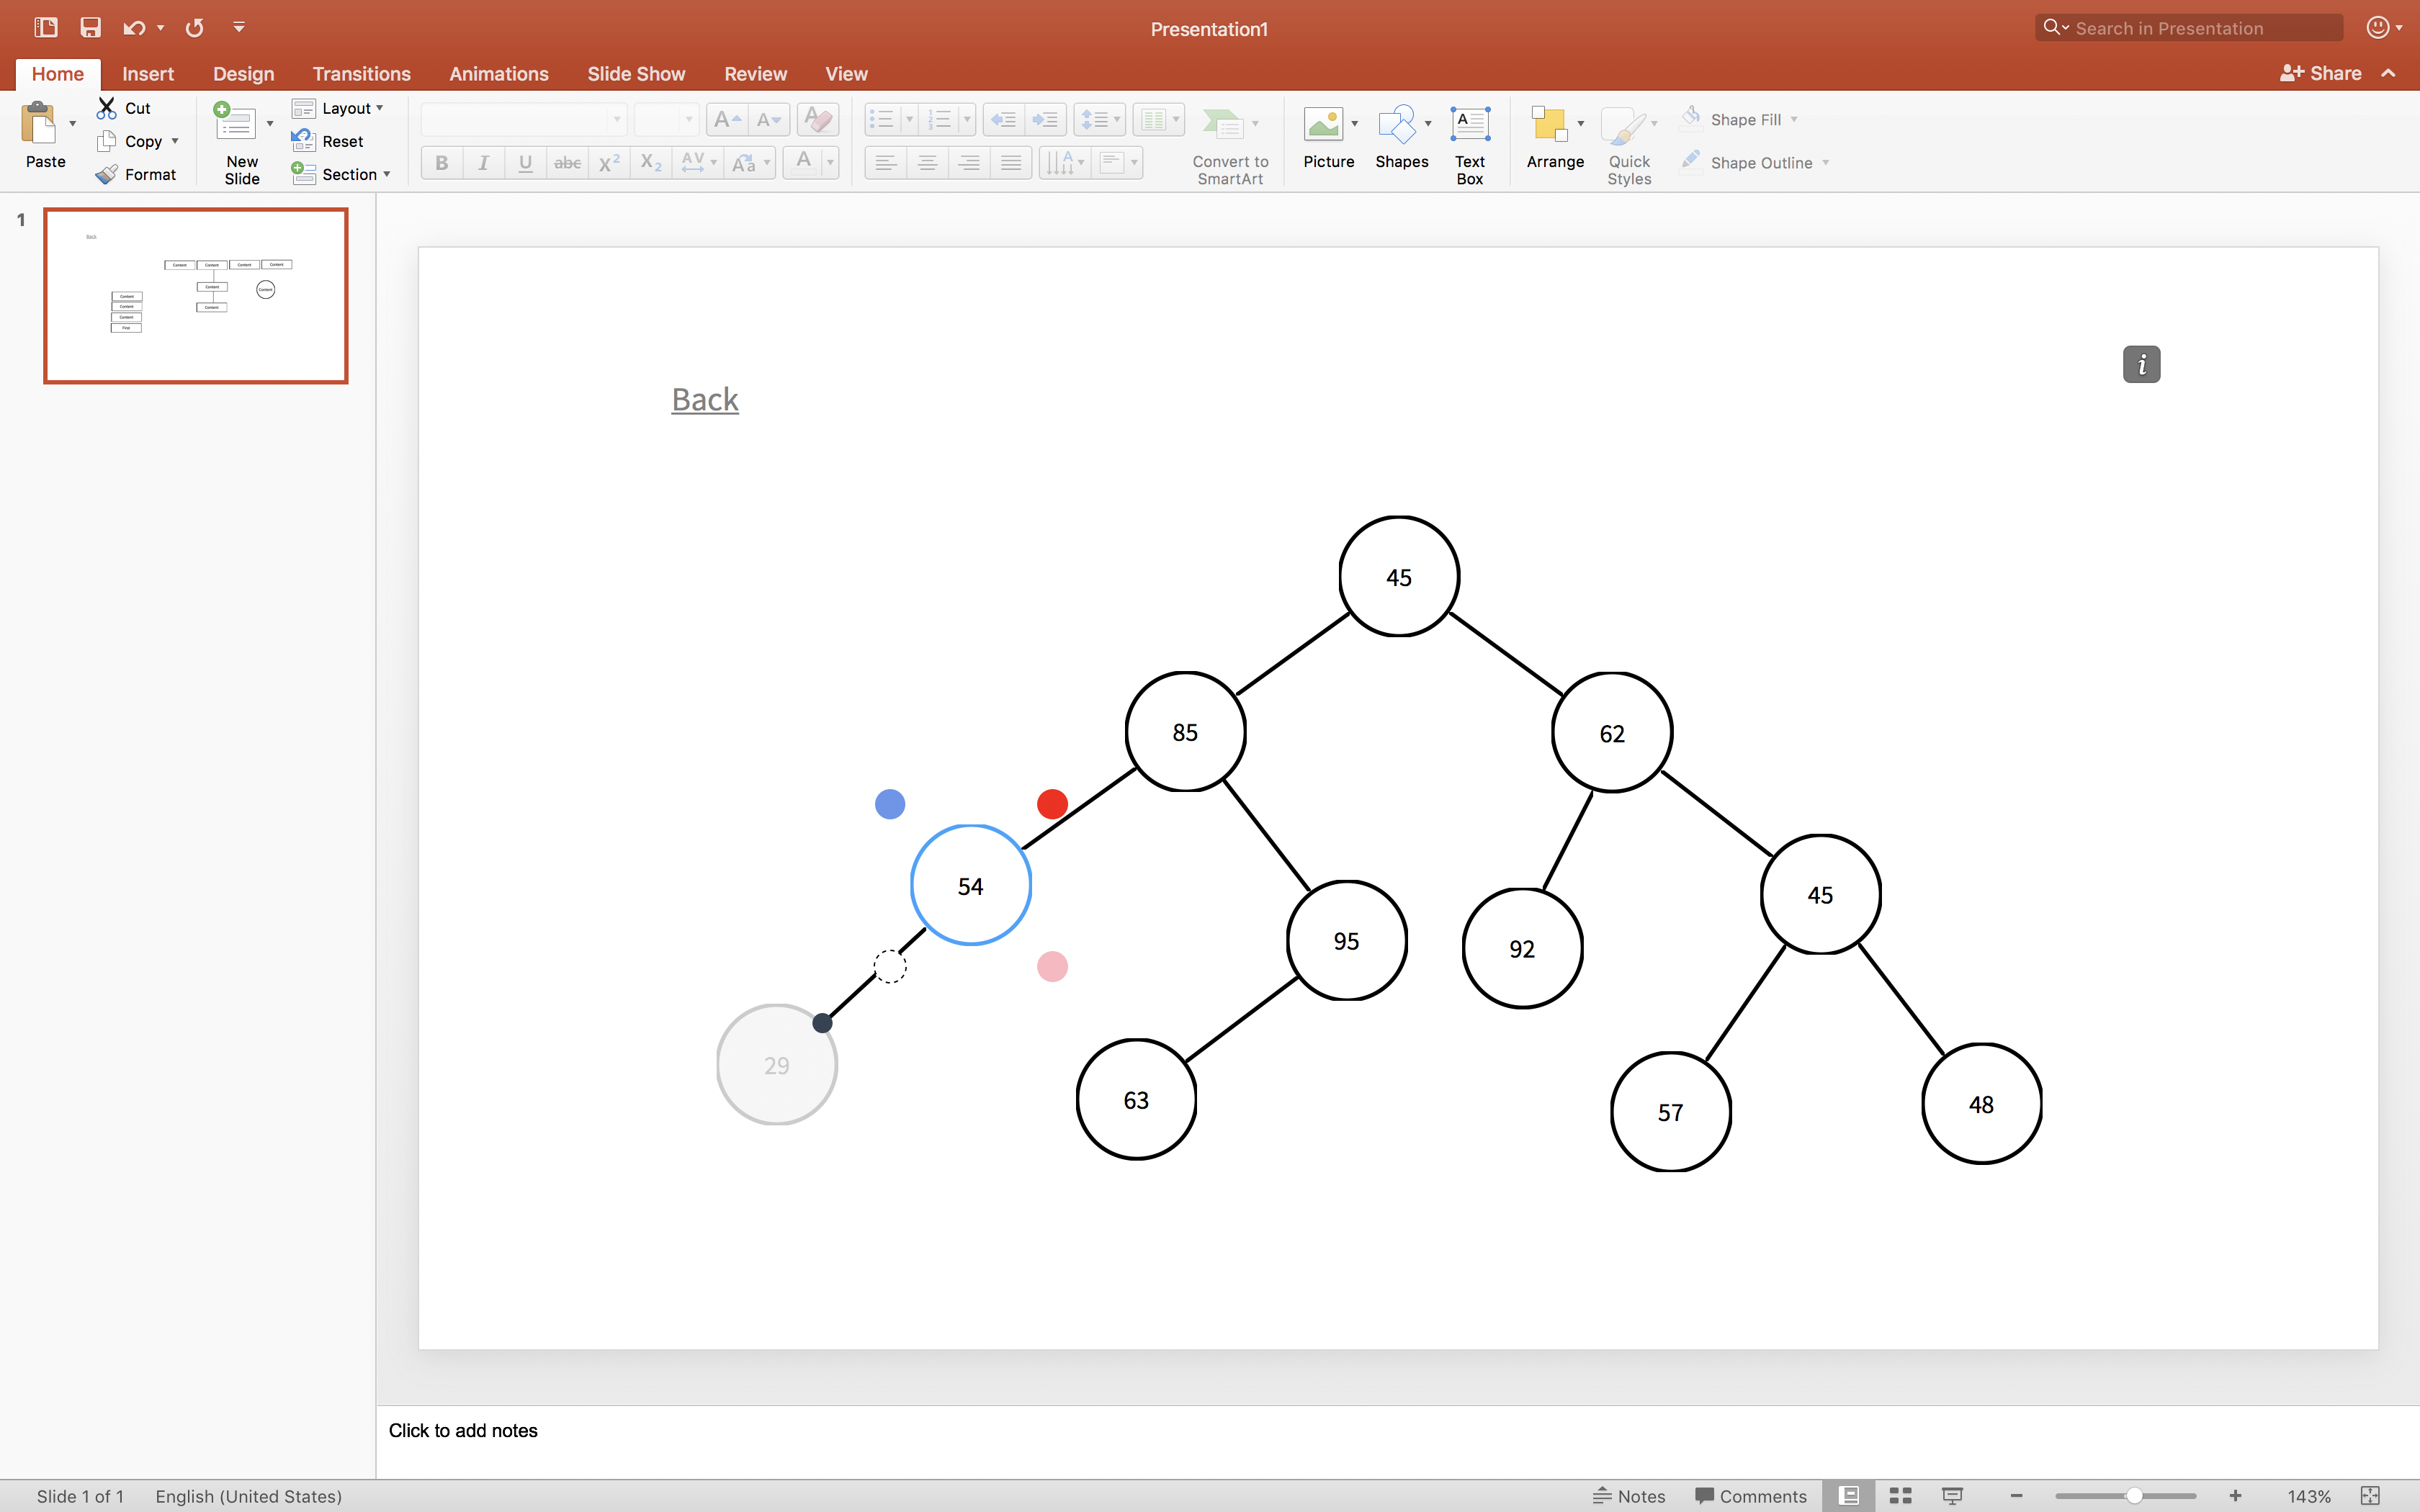
Creates beautiful diagram intuitively and fast. Like really fast. Like "create binary tree in mere seconds fast". Type Diagram was built with the understanding that using existing diagramming solutions take just too long.
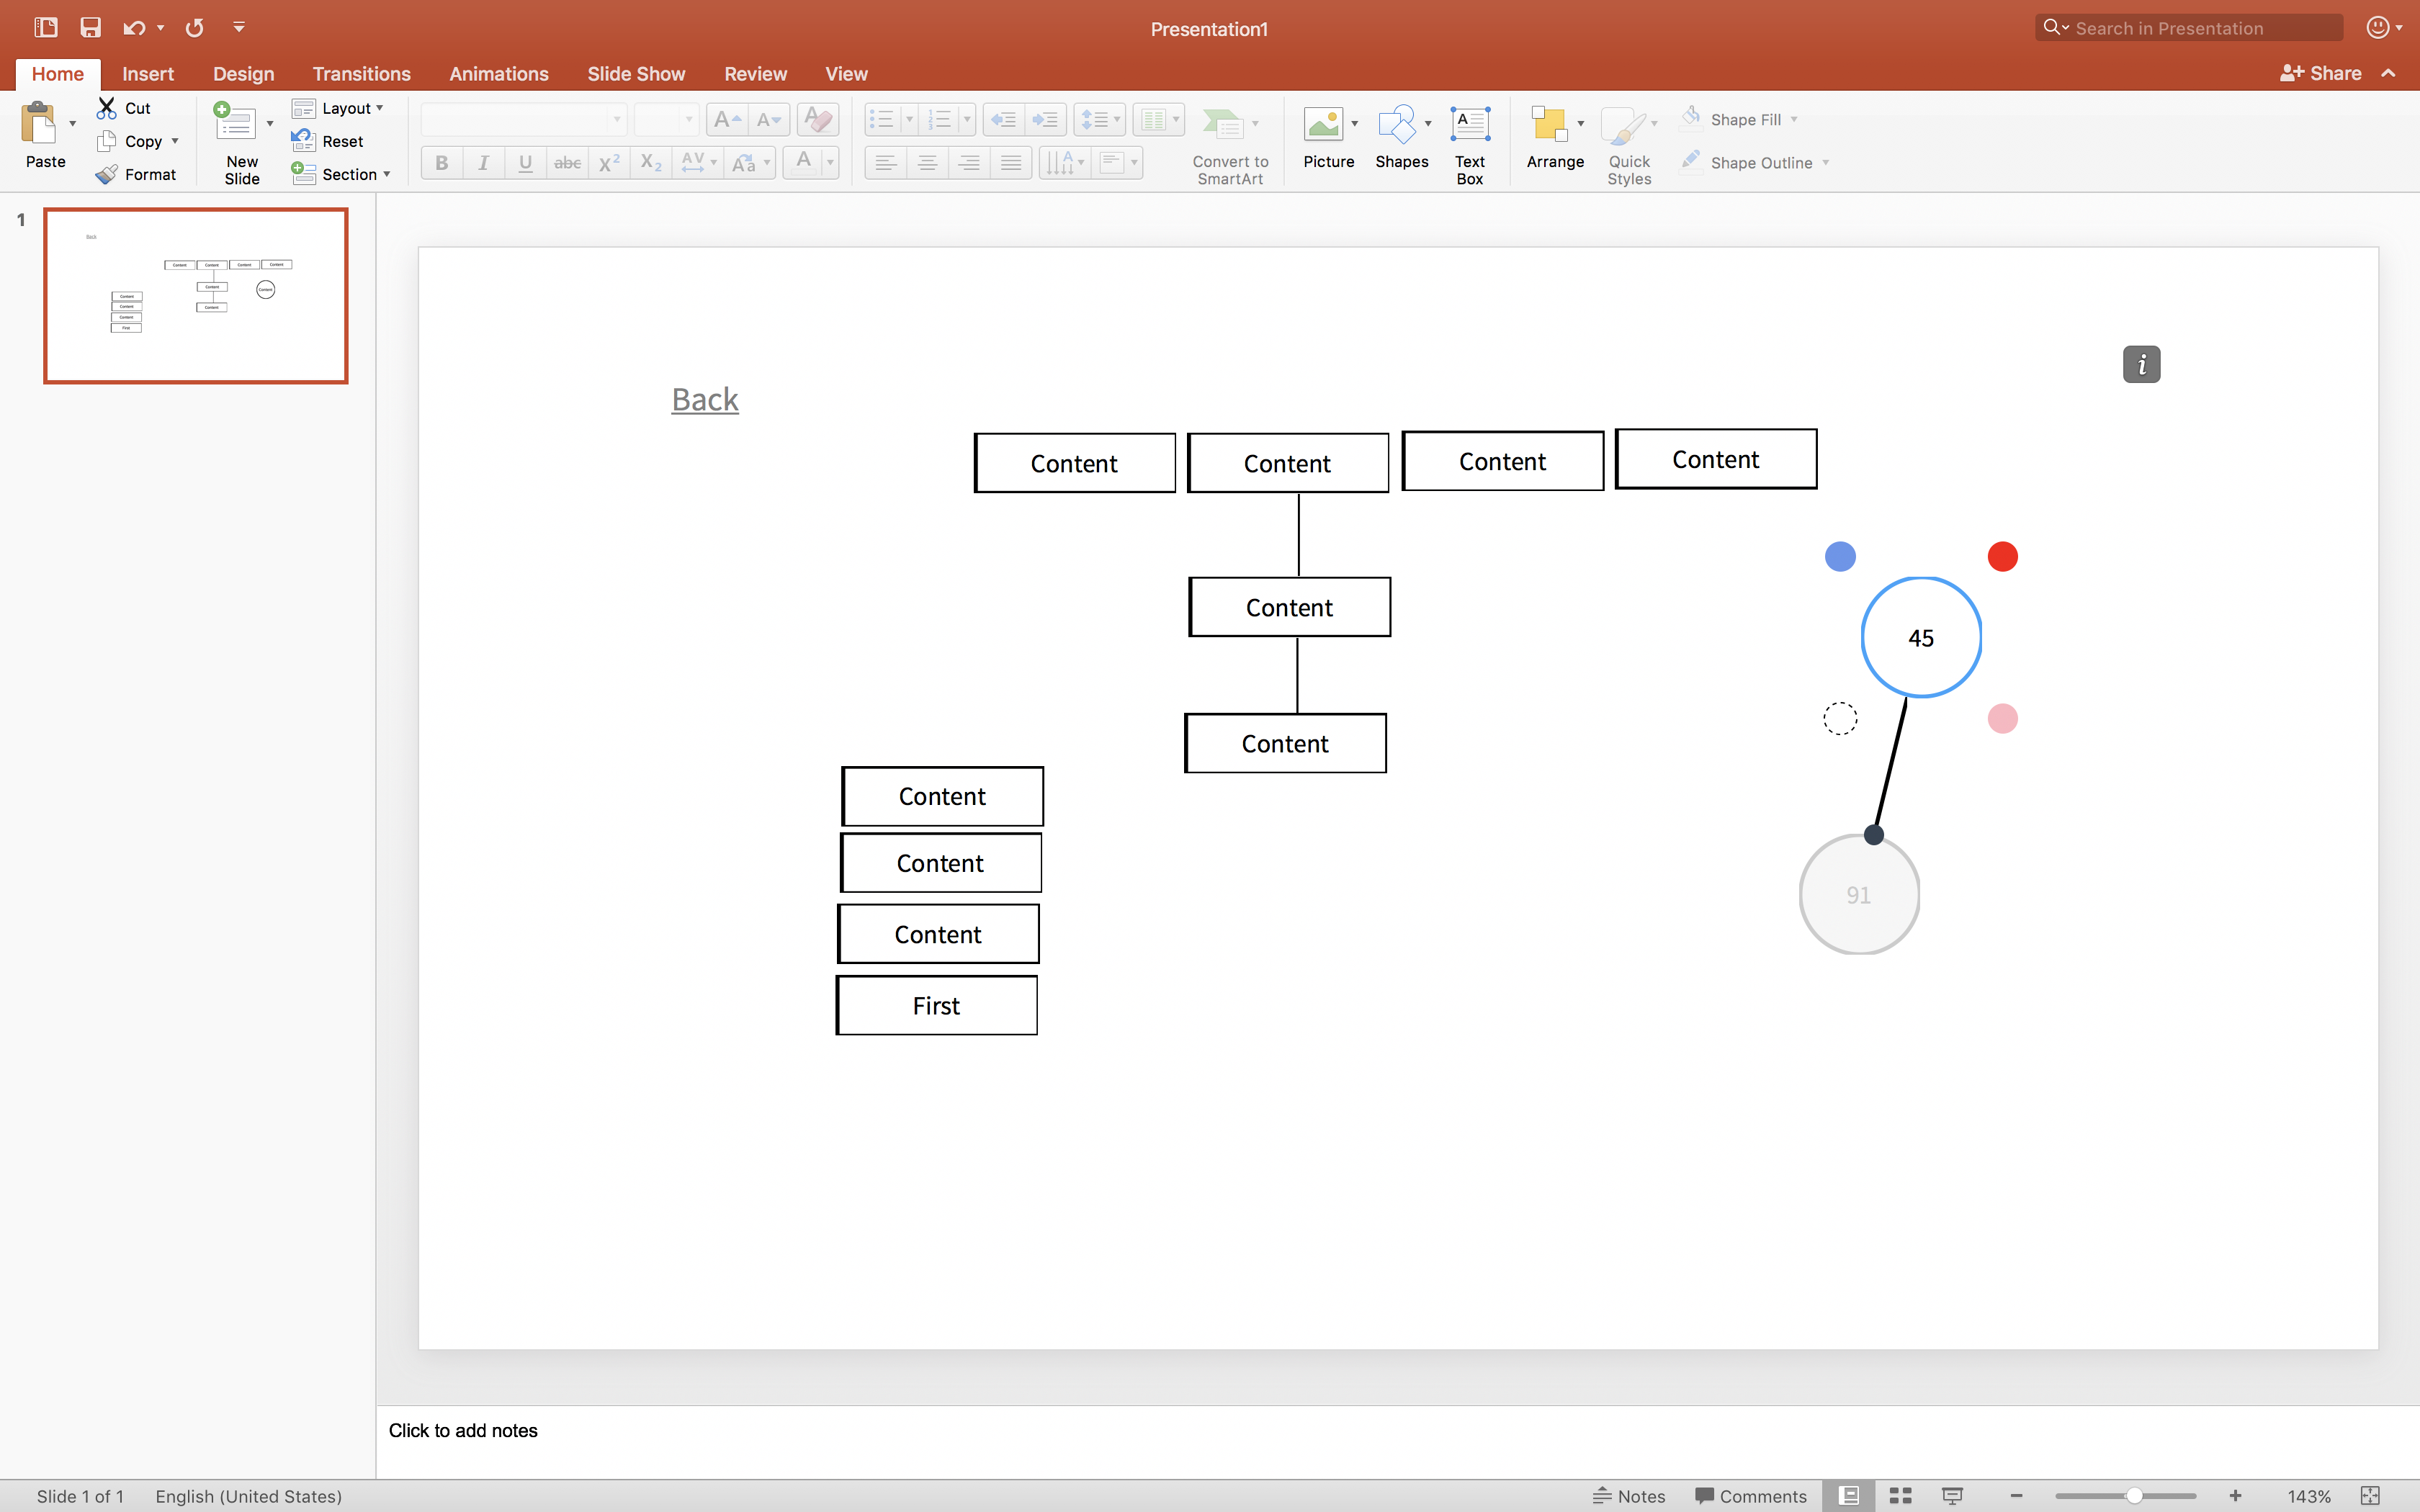
By design, you get to choose one of two shapes that you create from: Rectangle or Circle(psst... more shapes coming soon). Think of these shapes as nodes in your graph. Which means they can be connected via edges. You can write on your nodes and edges but what really makes this super flexibly is that all nodes and edges are mutable, meaning you can change any property of a node while still retaining its content and connections. You can change a node's shape, outline and content. Similarly for an edge you can change its endpoints, label and dashing.
On top of this Type Diagram provides several other useful features like autosaving, undo-redo, panning*, multiple selection, ghost nodes, auto generated node content, edge endpoint preference and common sense hotkeys(*copy paste will come soon too).
With the idea of a better user experience, I hope that this tool empowers diagrammers everywhere.
*(to pan hold space and drag)
Check out the Github Repo for more details about the project. Also, if you are looking for an older video where I discuss the some of the features in details, its over here
How I built it
Lots of tech! Its built on node.js.
Frontend: Angular 2 (love this beast!) running on TypeScript, WebPack configured.
Backend: Express.js (also on TypeScript), OrientDB (Graph Databases FTW)
Challenges I ran into
- Lots of configuration issues! Starting with the project setup all the way to infrastructure setup on digital ocean.
- Learning to use graph database for the first time.
- Revision of several design decisions for better user experience.
- SSL configuration and setup (also first time)
- Working hours on end as a solo developer, plenty of sleepless nights.
Accomplishments that I'm proud of
I have worked on several long term and short term independent projects (You can check my website). But this was the most fast paced project I have ever done. Believing that I can pull such a huge project in just one month was really hard, but I did it.
What I learned
This project solidified my technical skills, both in frontend and backend. And I am really happy to learn about SSL and Graph Database. At the same time, my frontend skills have gone up.
What's next for Type Diagram
I will be adding more shapes, add option to choose node's colors, and options to change styling of content ( like bold, italics etc.)
Built With
- angular2
- express.js
- node.js
- orientdb


Log in or sign up for Devpost to join the conversation.