-
-
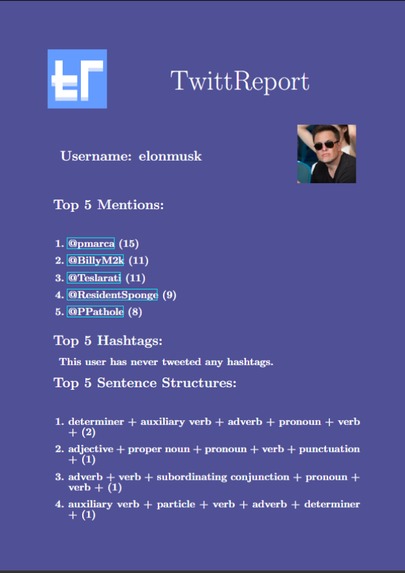
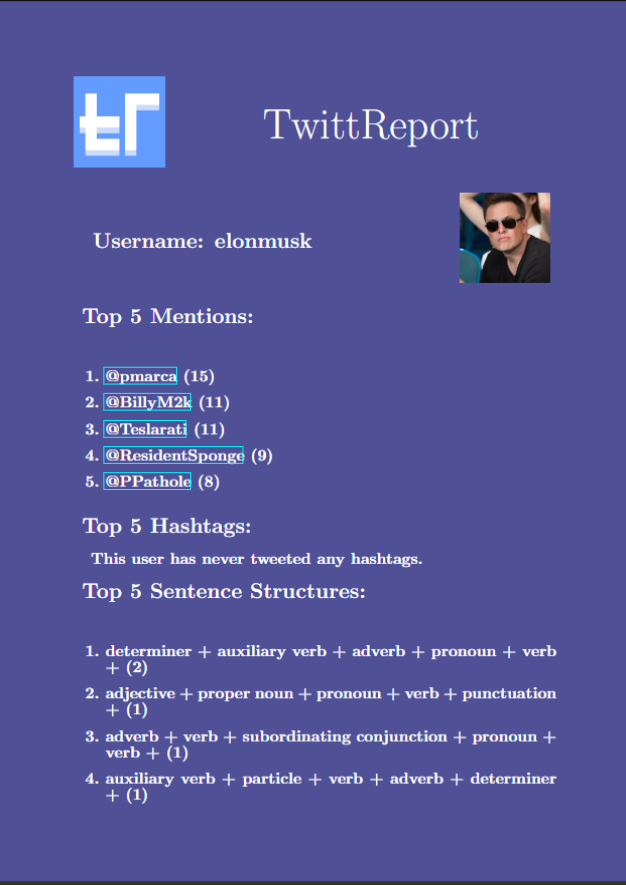
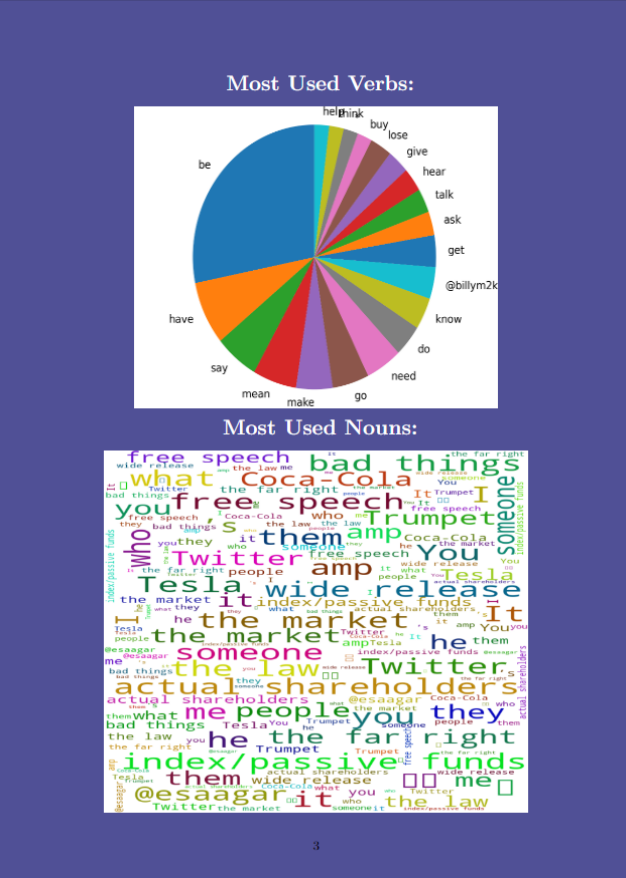
Page 1 of the report
-
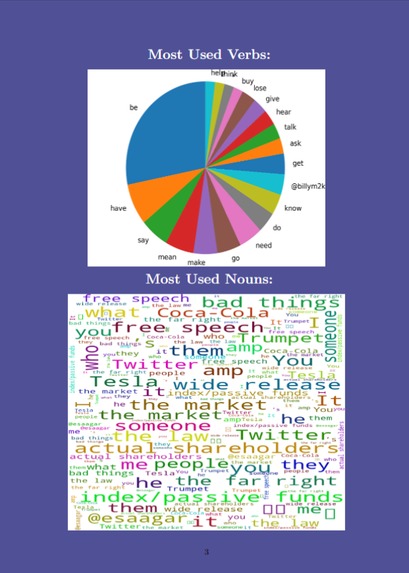
Page 2 of the report
-
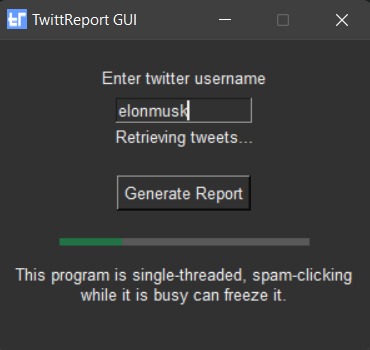
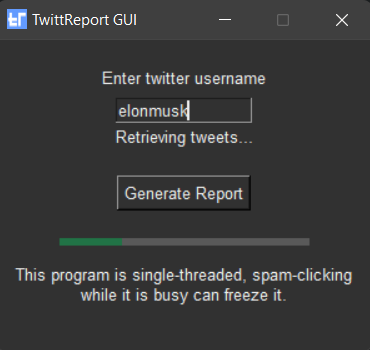
Graphical User Interface
Inspiration
We were inspired by many great web-scraping and data visualization projects from other hackathons. We have also decided to associate our project with a social media so it would resonate with more users.
What it does
It scrapes users tweets, analyzes them, and then saves the analyzed report into a nice looking pdf! (Sounds like a piece of cake, but trust me, theres a lot of things going on under the hood)
How we built it
To build TwittReport we went with Python programming language as it had all the libraries we needed for our task. It also gave us a development speed boost which was handy as we did not have much time. To accomplish our goal, we used the following libraries:
twint - To scrape tweets
spacy - To analyze tweets
tkinter - Graphical User Interface
matplotlib - Graphics for the report
numpy / pandas - Required by matplotlib
LaTeX / pdflatex - To generate a pdf
Challenges we ran into
- Limited time - we were in a rush the whole process, but thankfully manage to accomplish everything we wanted.
- Libraries - using many different libraries is confusing and requires a lot of work to use them properly.
- Look-and-feel - we tried hard to make the pdf and gui look neat, as close to real-life products as possible.
Accomplishments that we're proud of
- Flawless retrieval of tweets
- Fantastic language analysis
- Fenomenal graphics generation
- Fabulous looking pdf
- Flamboyant GUI
What we learned
We learned how to use various python libraries such as matplotlib, spacy, twint and tkinter. We learned how to manage our project under time limit and how to plan short-term projects. We also learned how to put those libraries all together to make a meaningful and useful program.
What's next for TwittReport
- More statistics for the report
- Report document color themes
- Saving to formats other than pdf
- To be continued!
Discords (in case we win 🙏): iggy#7050, aa-h#1476


Log in or sign up for Devpost to join the conversation.