
What it does
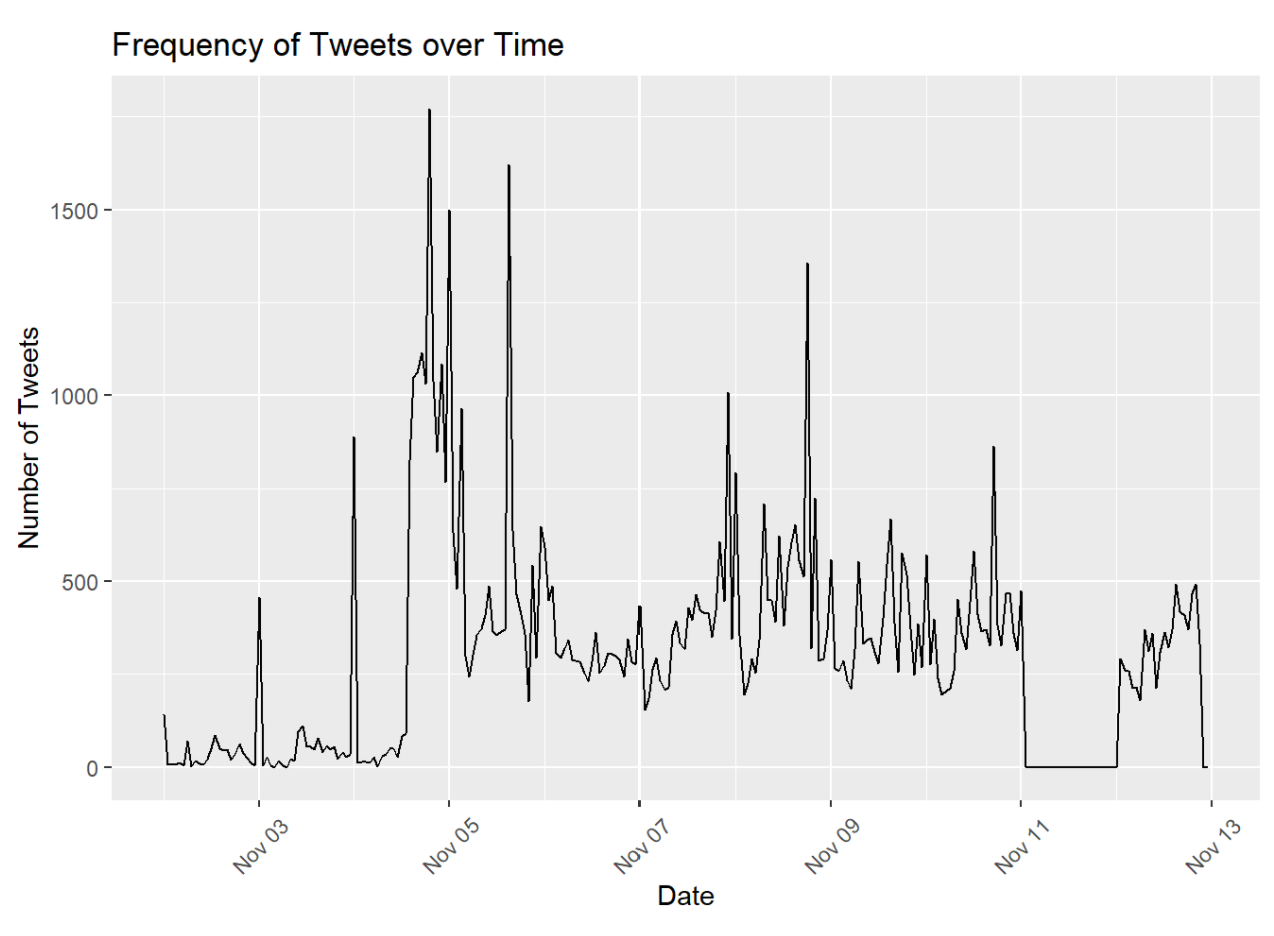
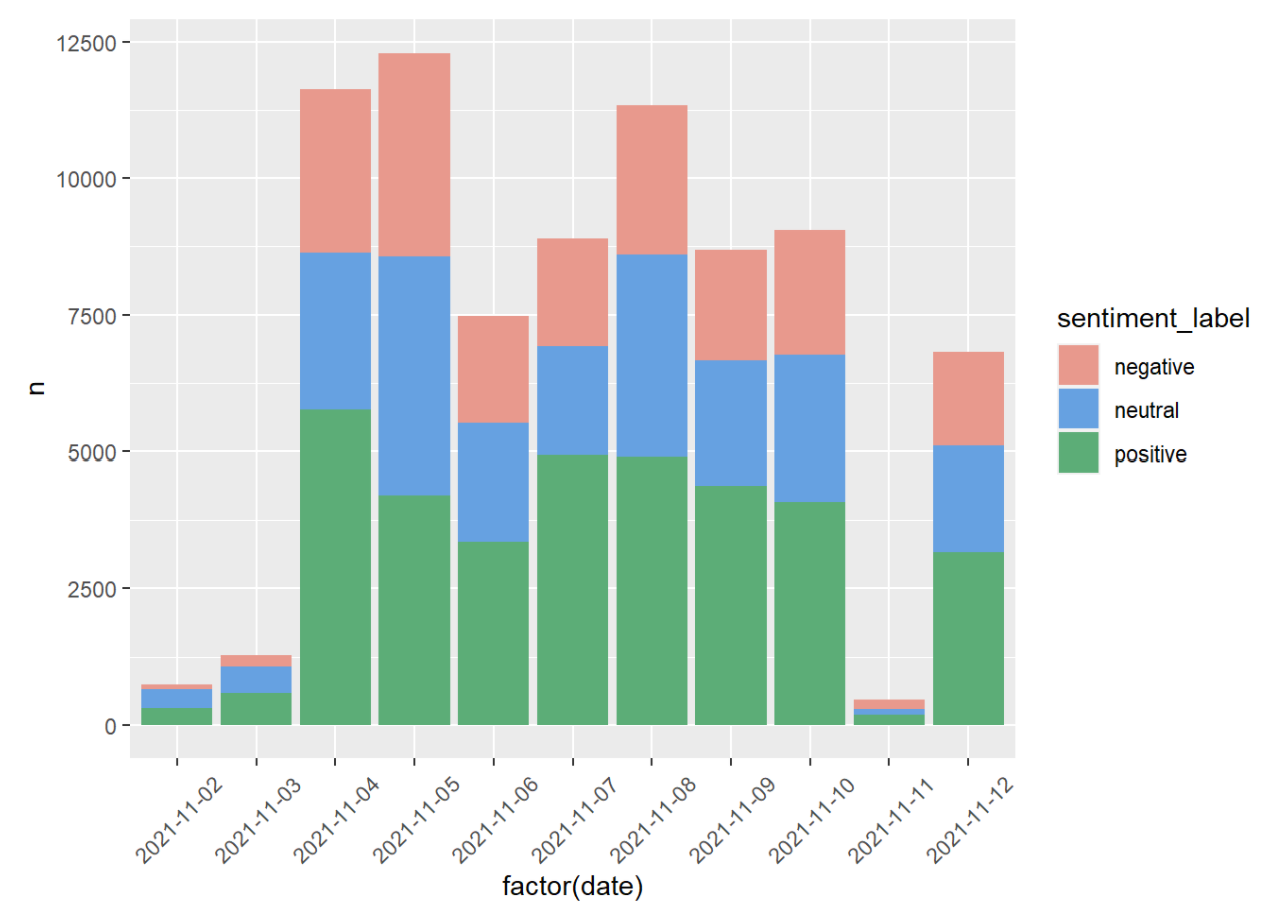
Our Hack visualizes data scraped from Twitter over a 10 day period and formats it in an interactive wordcloud displaying trends in keywords and hashtags used. We also explore what this data could mean by displaying it over several types of visualizations and providing analysis on the HTML page.
How we built it
- R in RStudio for the bulk of the data processing and visualizations
- Python scripting for further parsing and cleaning of the data
- R-Markdown for the HTML and presentation portion
Challenges we ran into
- Irregularities in the dataset
- Thinking of ways to present the data in analysis
Accomplishments that we're proud of
- Figuring out how to work with new libraries and frameworks to achieve our goals
- Creating an interactive model to display the data and give further meaning to it
- Solving issues with data inconsistencies and irregularities
What's next for Twitter Story
- Cloud-based hosting for our interactive product for increased access
- Larger data sets with increased scraping
- More breadth achieved by collecting data from other places on the internet, like Instagram or Reddit


Log in or sign up for Devpost to join the conversation.