-
Project index/home page
-
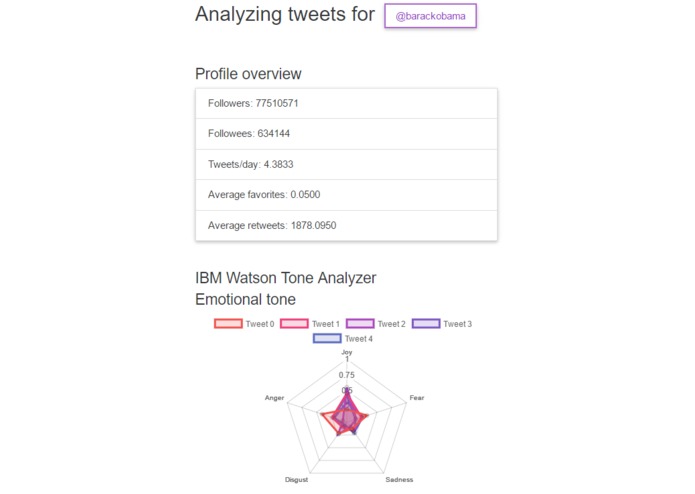
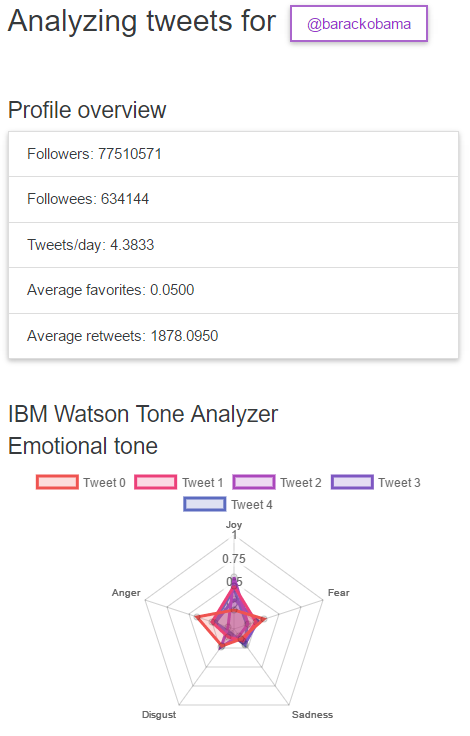
Profile overview for a user
-
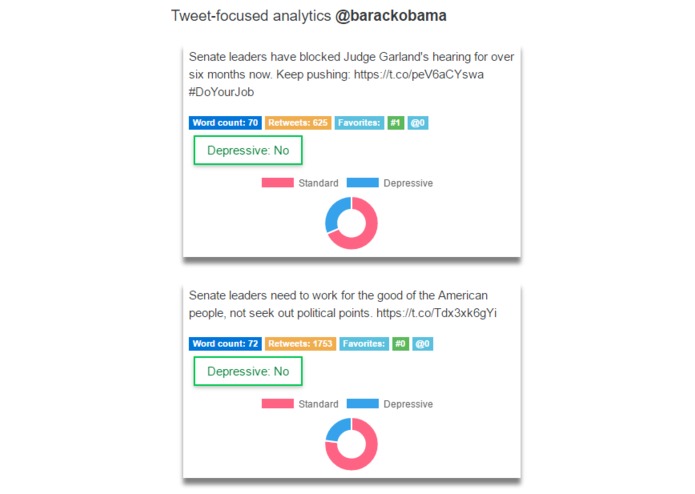
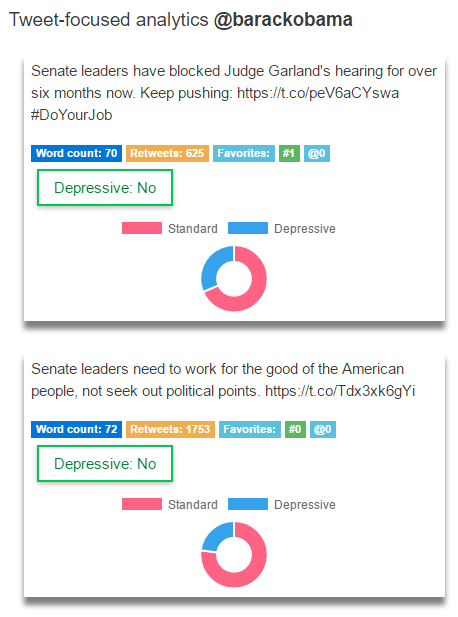
Tweet-focused analysis including classifications for each tweet
-
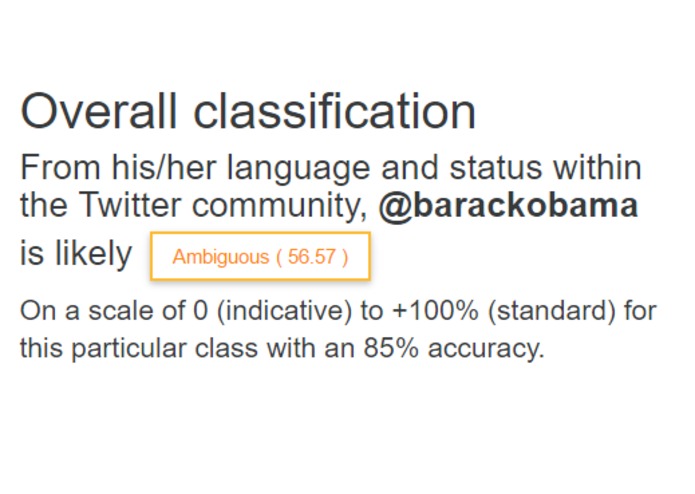
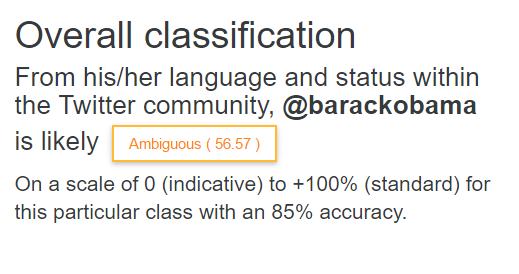
Overall ranking
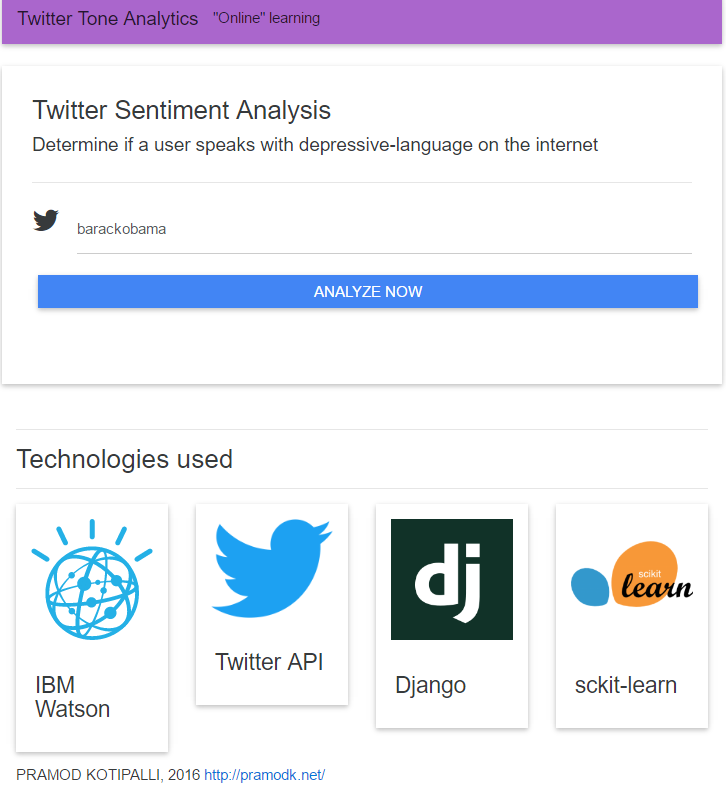
Twitter Sentiment Analysis
Motivation
Twitter offers hundreds of millions of users the ability to post "microblogs" for the world to see. These Tweets offer a very unique insight into the minds of users because:
- Users label the mood and tone of their tweets with hashtags
- Sentiment is compressed into a very short (and often emotionally charged) blurb
In this project, I used the self-labelled nature of tweets to try and uncover depressive language within the language of Twitter users' tweets. I created a machine learning model that attempts to discriminate between users using depressive-indicative language those who are not.
I used scikit-learn's k-Nearest-Neighbors classification model that provided probability estimates for new data points belonging to a particular class.
What it does
This project encapsulated multiple distinct phases:
- Data collection: Collect nearly 4,000 tweets from Twitter using their Twitter Developer API and label them based on their hashtag. For example, tweets containing "depressed" (or related hashtags) will be labelled as belonging to the "depressive-indicative" class; tweets containing "happy" (or related hashtags) will be labelled as part of the "non-depressive-indicative" class.
- Under the user's position in the Twitter community: Call the Twitter API to gain information about the user's followers, followees, average retweet counts, and more.
- Data analysis: Send each of the 4,000 tweets to IBM Watson's Tone Analyzer API to gain more dimensions of information about each tweet.
- Classification model: Use the labelled data to discriminate (with a machine learning algorithm) between tweets that are "depressive-indicative" or not in terms of their language characteristics.
- Understand an unknown user: Given an unknown user, provide visualizations and a classification of their Twitter tweet language.
Technologies used
Technologies used include:
- Django web framework
- scikit-learn
- chart.js
- Bootstrap and Material Bootstrap (mdbootstrap)
Challenges
Here are some challenges I faced:
- Data collection was difficult and very time consuming. Creating a pipeline that collected tweets and contacted the IBM Watson API was very difficult to have run flawlessly
- Visualizations are tough. Find the right types of charts and graphs to illustrate data is a trying task.
Use cases
- Identify psychiatric patients in need of immediate help or intervention
- Tools to help presenters language their talks more positively
- Tools to identify long-term trends in user language that can be modeled as time-dependent series (think Hidden Markov Models)

Log in or sign up for Devpost to join the conversation.