-
-
Project ScreenShot 4
-
Project ScreenShot 5
-
Project ScreenShot 7
-
Project ScreenShot 8
-
Project ScreenShot 3
-
Project ScreenShot 2
-
Project ScreenShot 1
-
Project ScreenShot 6
Inspiration
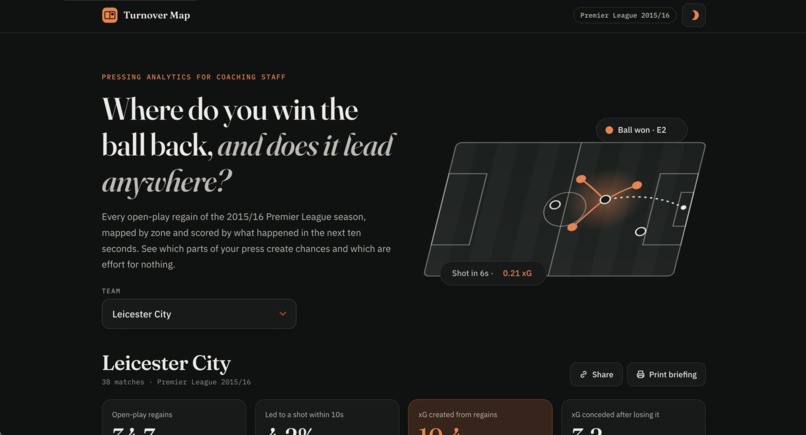
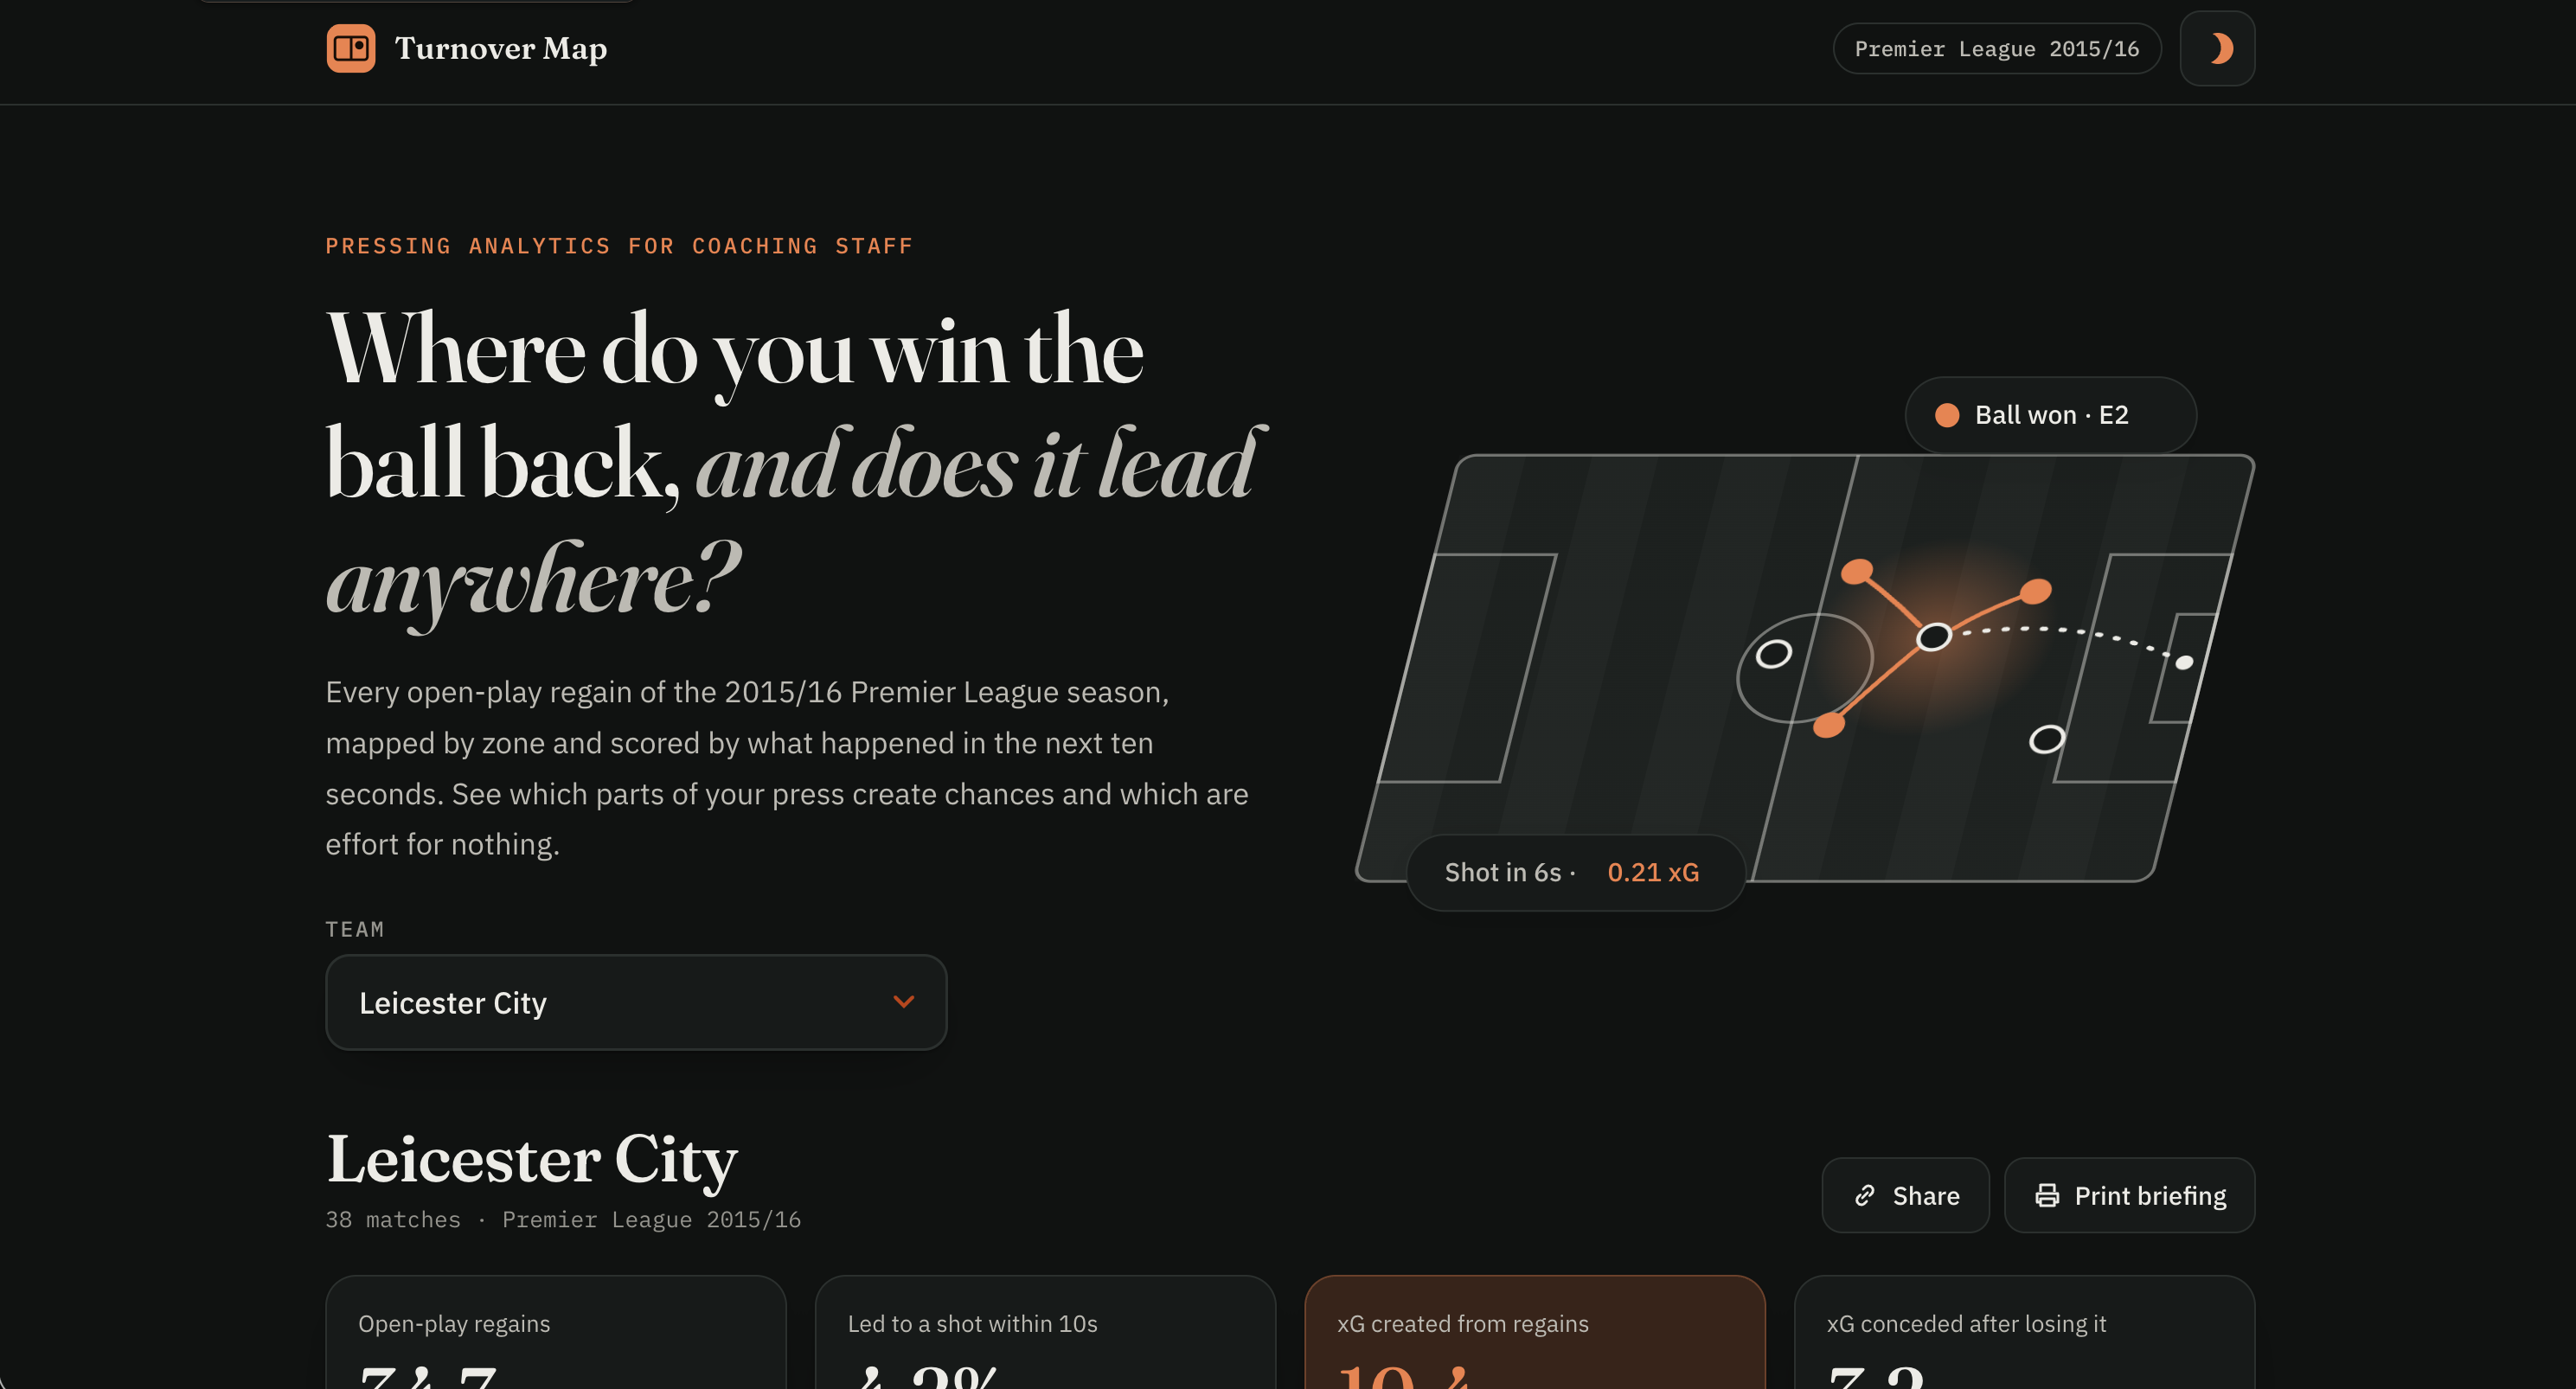
Every coach talks about pressing, but few can say which zones of their press create chances and which are wasted running. Most recovery maps only count volume, so a clearance in your own box looks the same as a regain on the edge of the opposition area that becomes a shot. I wanted to measure the value of each regain, not the count.
What it does
Turnover Map analyses all 26,715 open-play turnovers from the 2015/16 Premier League (all 380 matches, StatsBomb Open Data). Pick any of the 20 teams and you get:
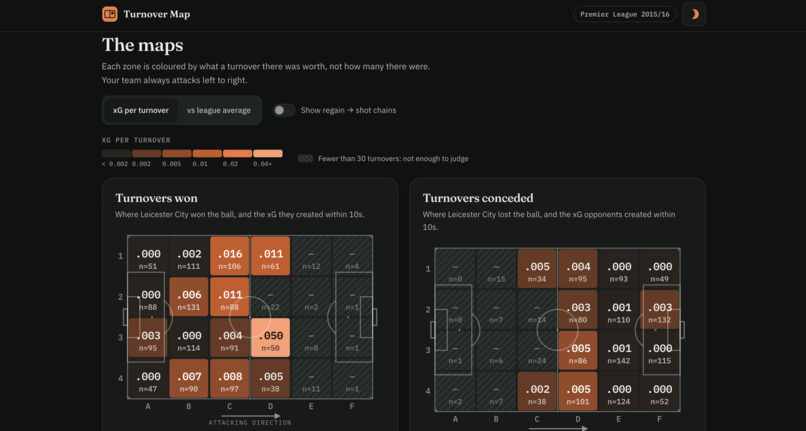
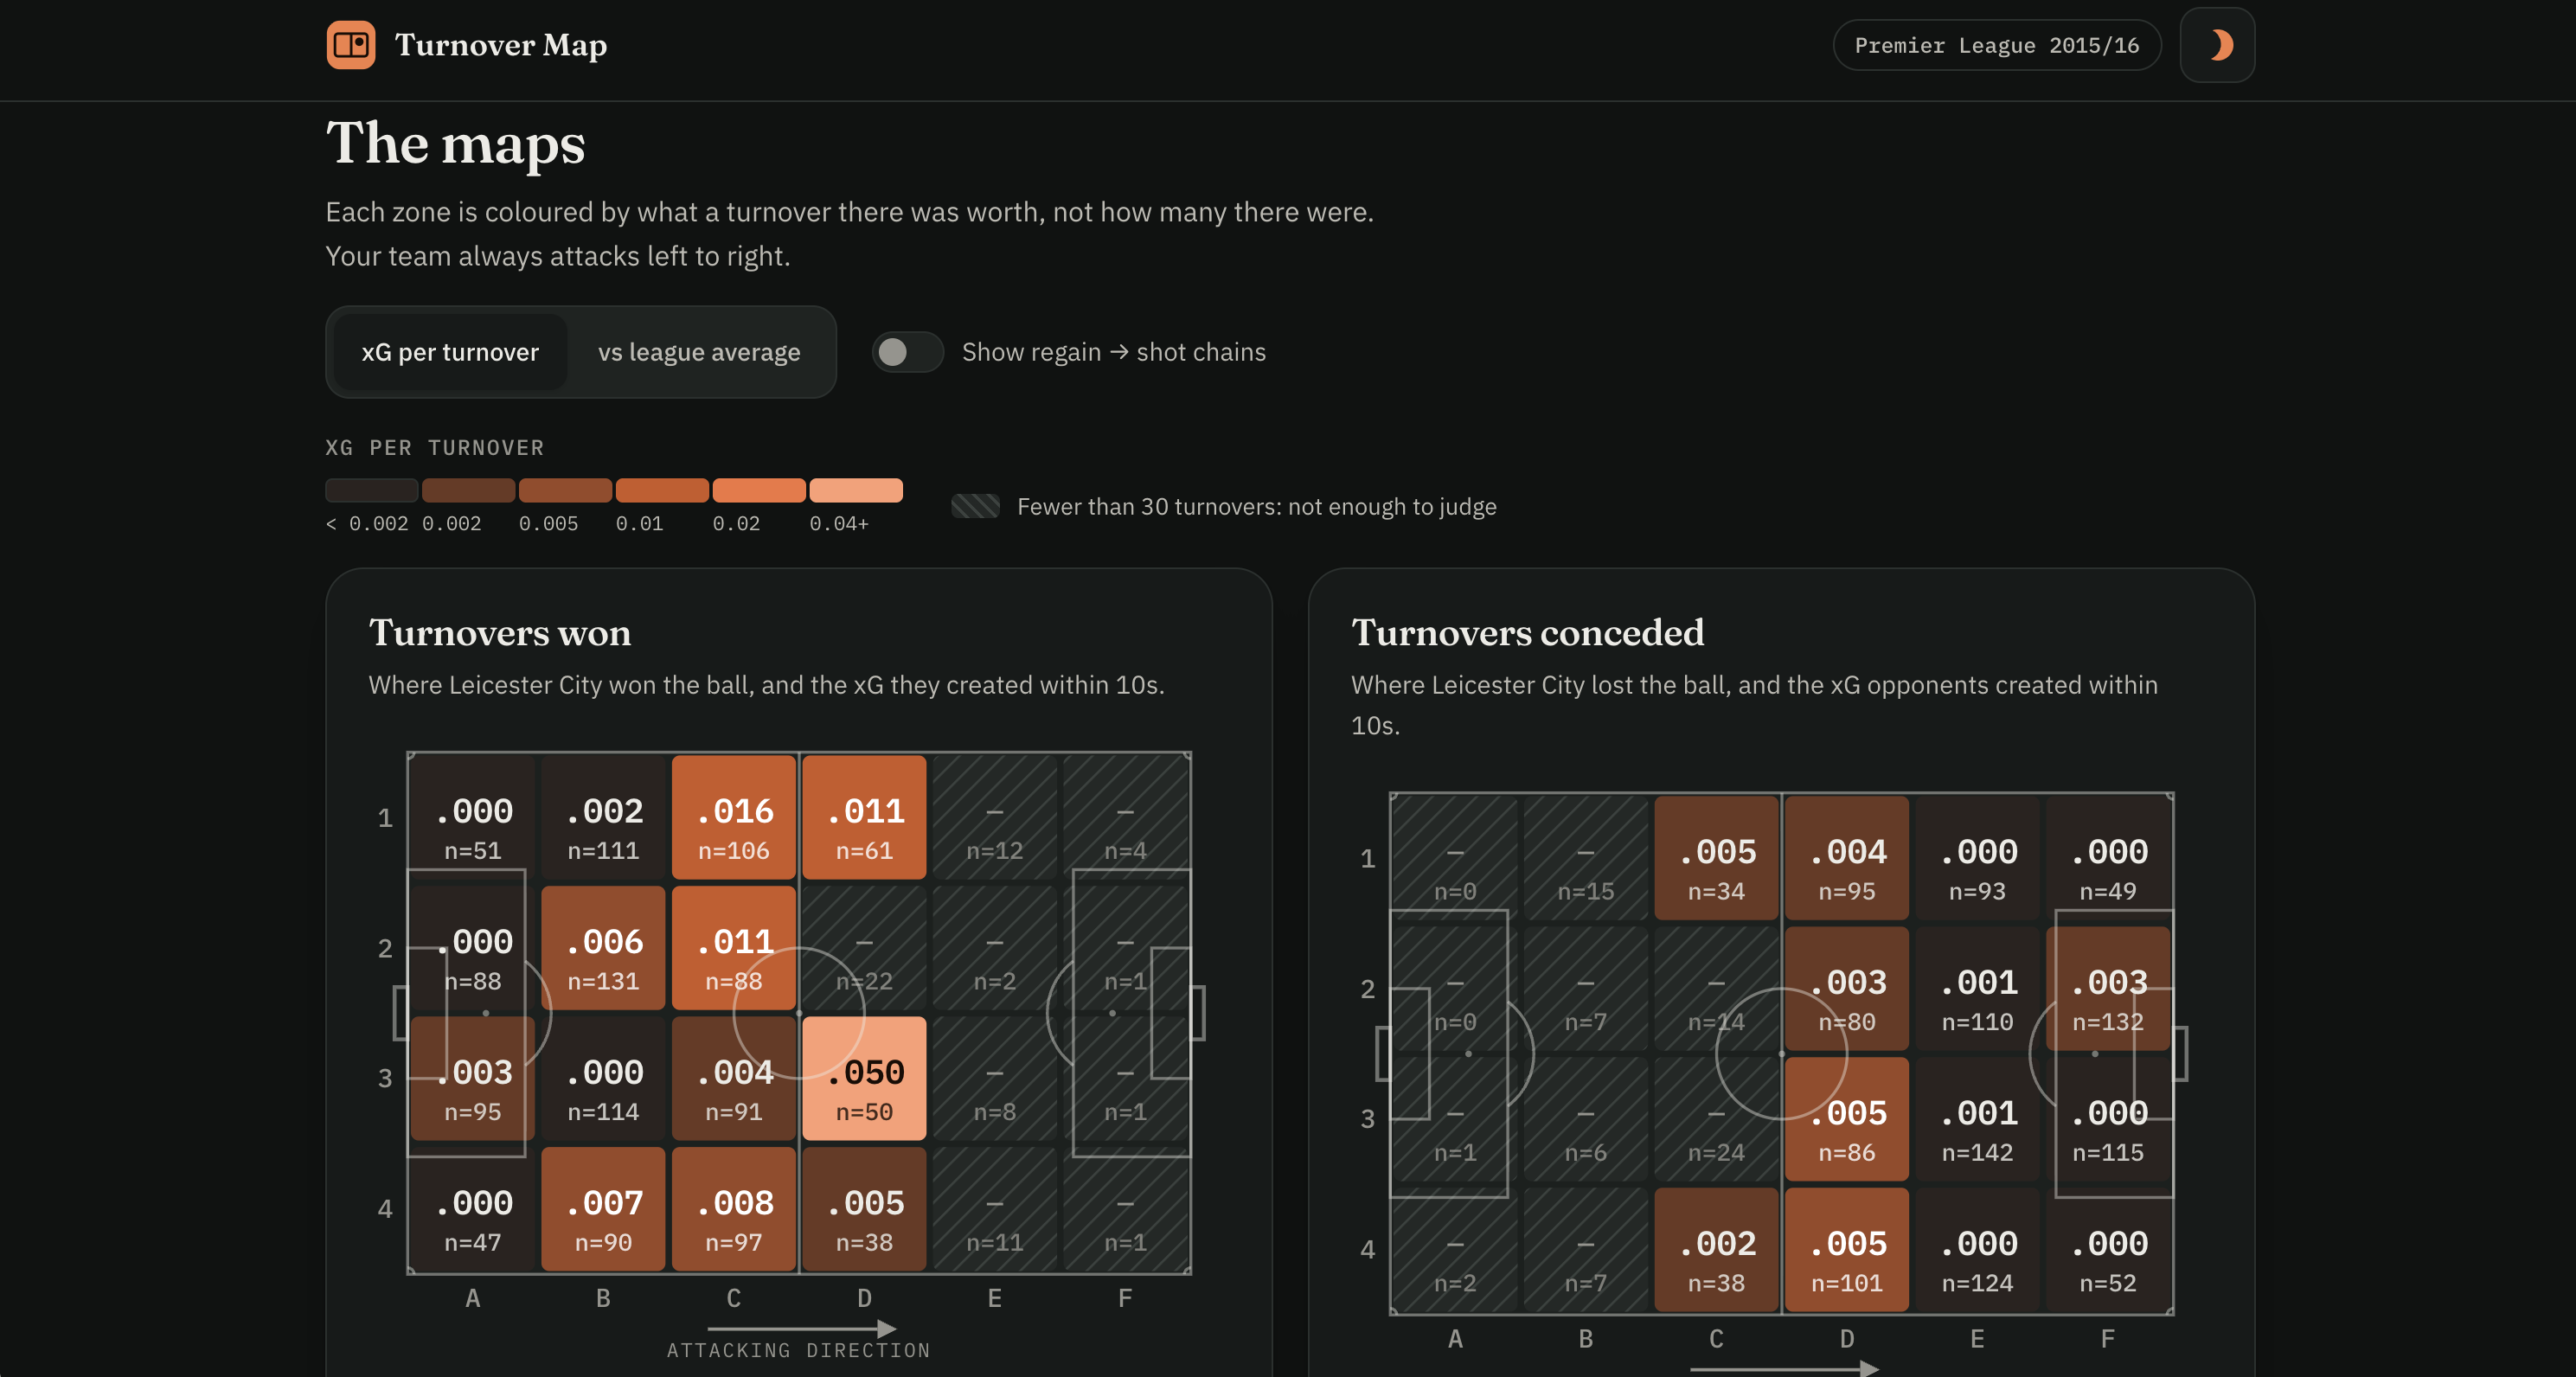
- Pitch heatmaps, won and conceded. 24 zones coloured by xG created within 10 seconds per turnover, or by comparison with the league average from the same zone. Both maps use the team's own attacking direction.
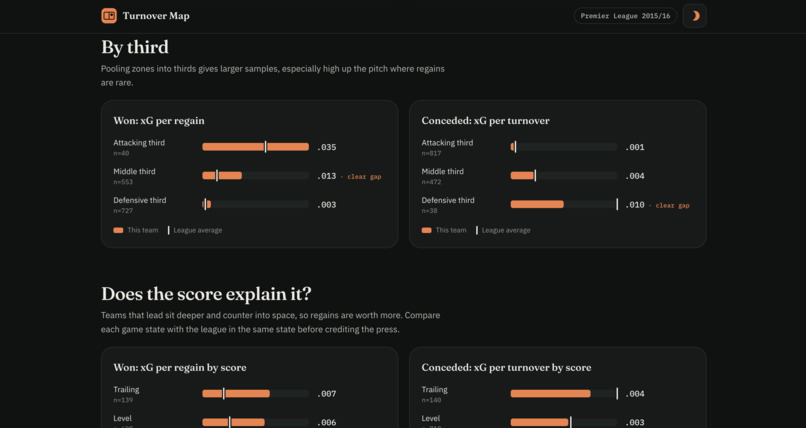
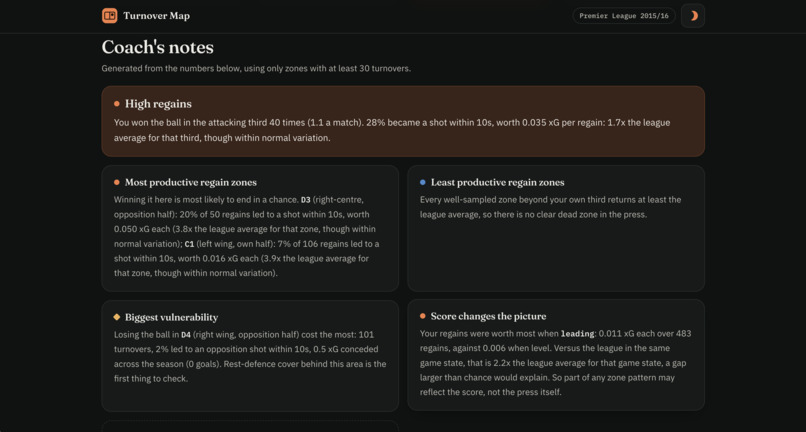
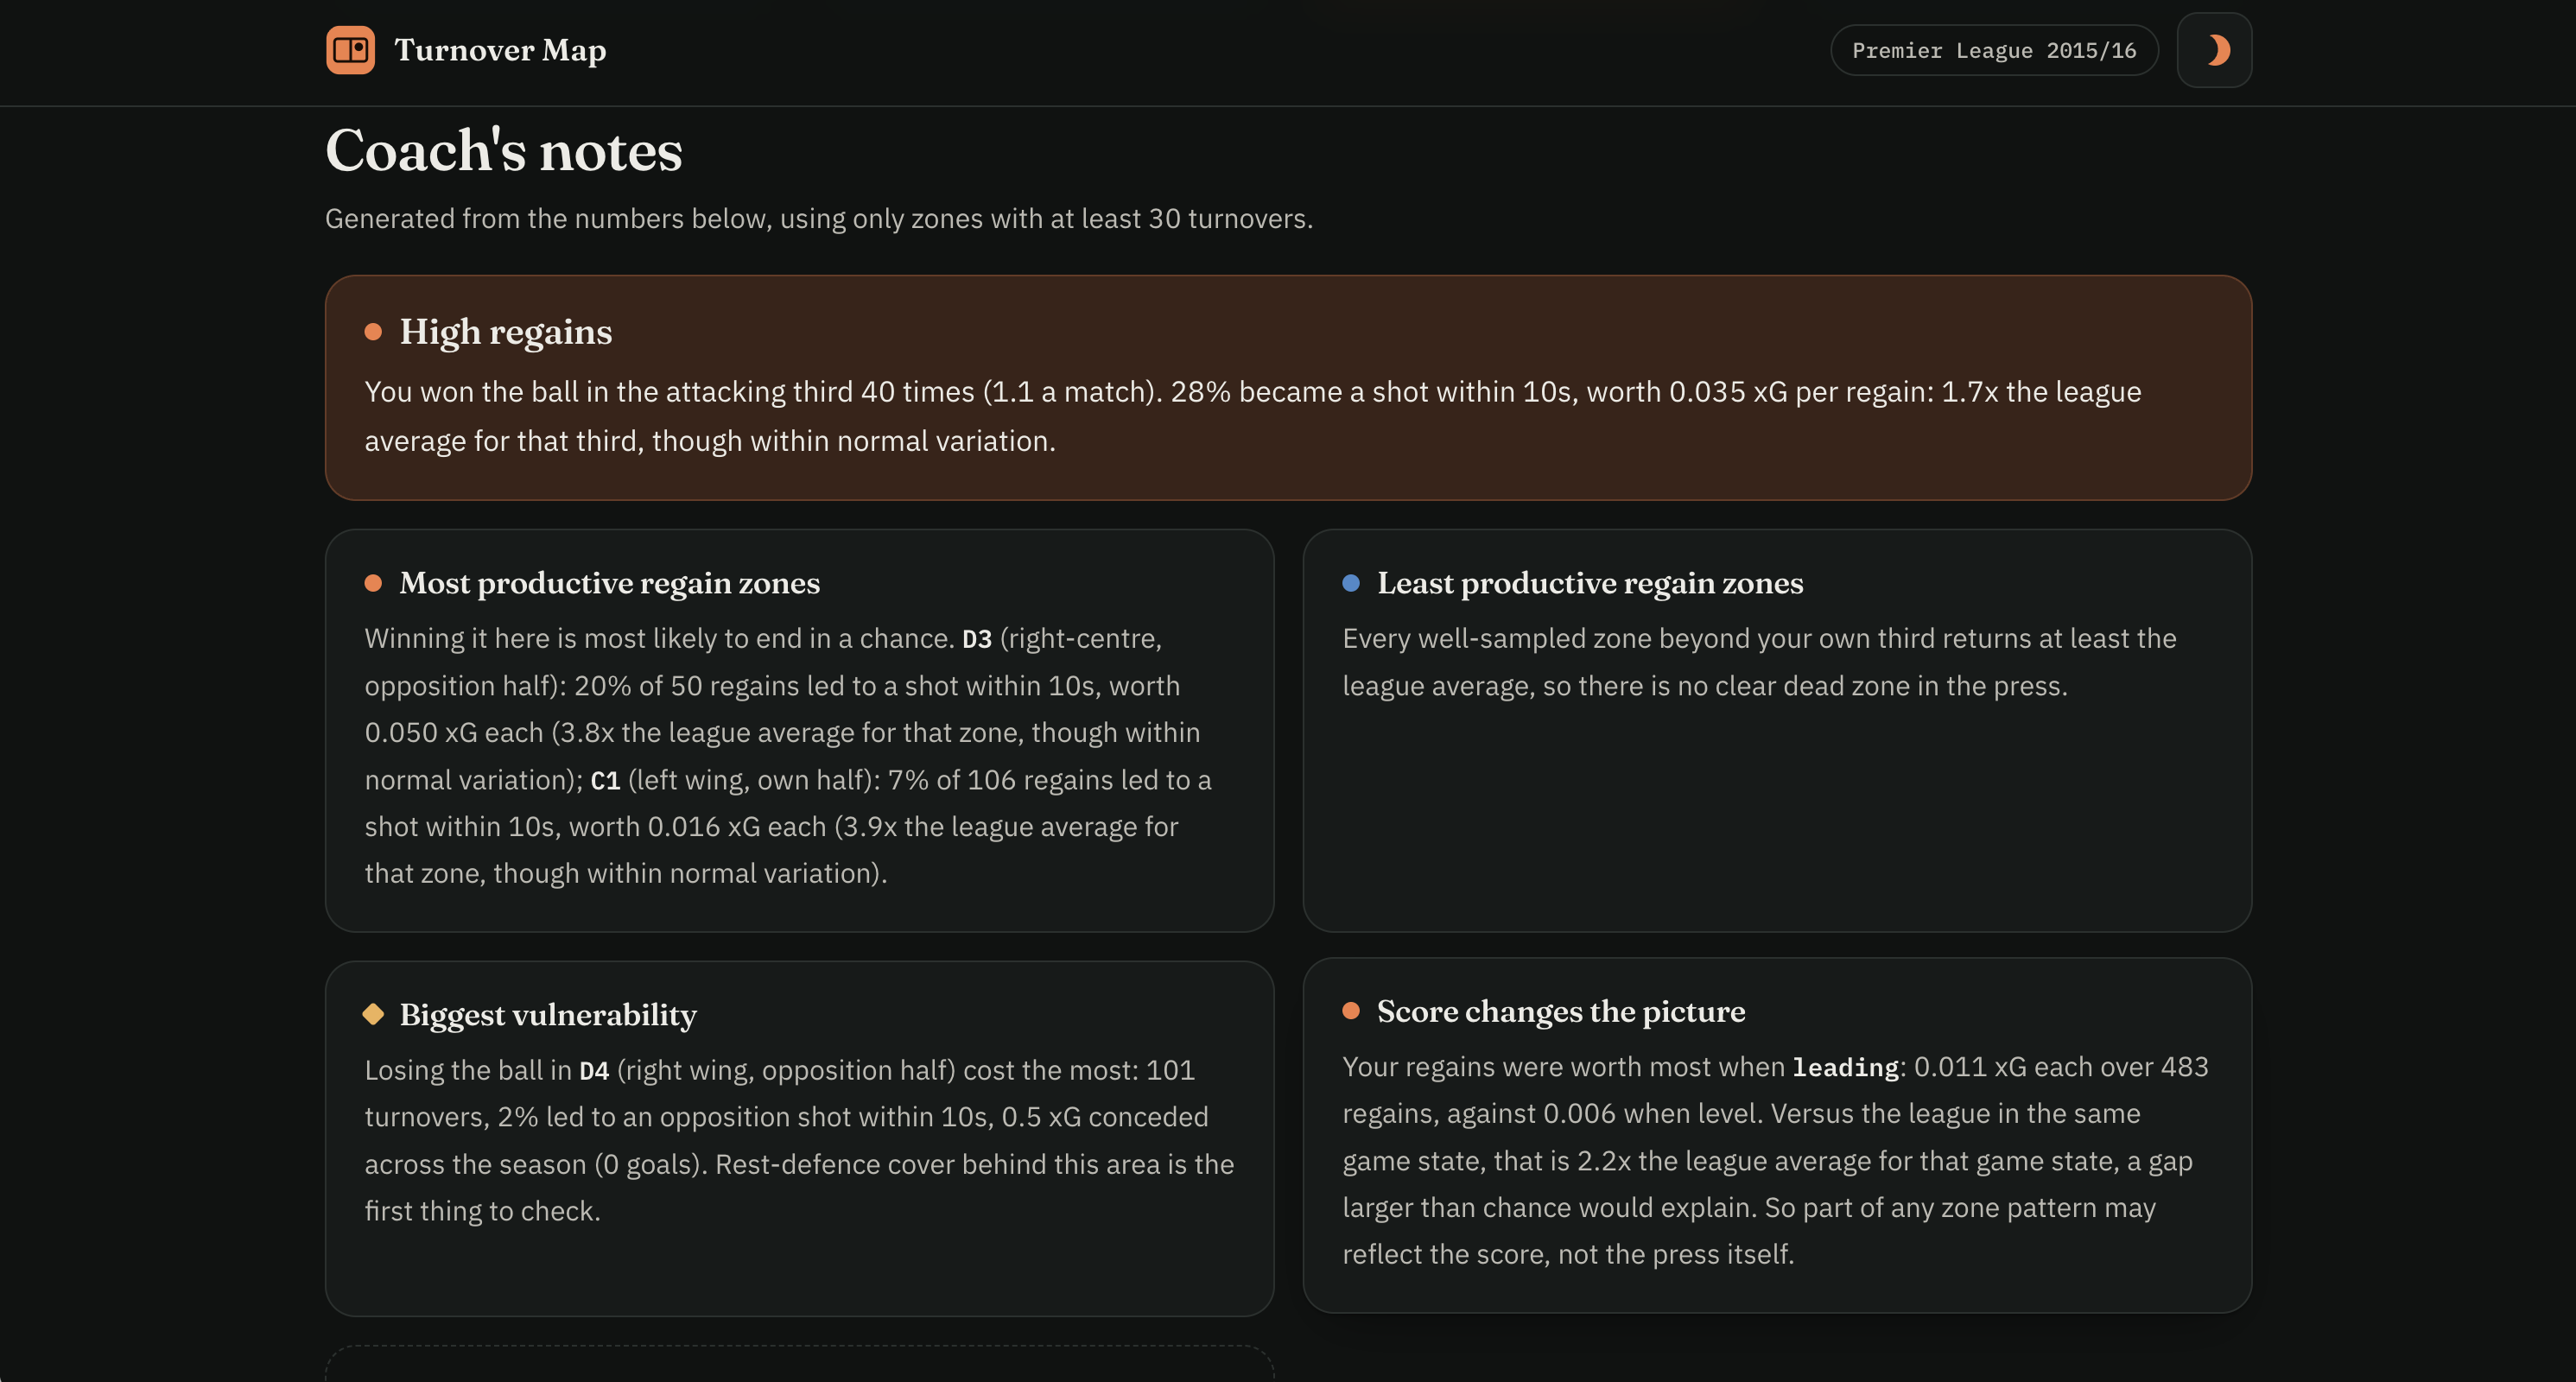
- Coach's notes in plain English. The most and least productive regain zones, the biggest defensive vulnerability, and whether the scoreline explains the pattern.
- Regain → shot chains drawn on the pitch, with goals highlighted.
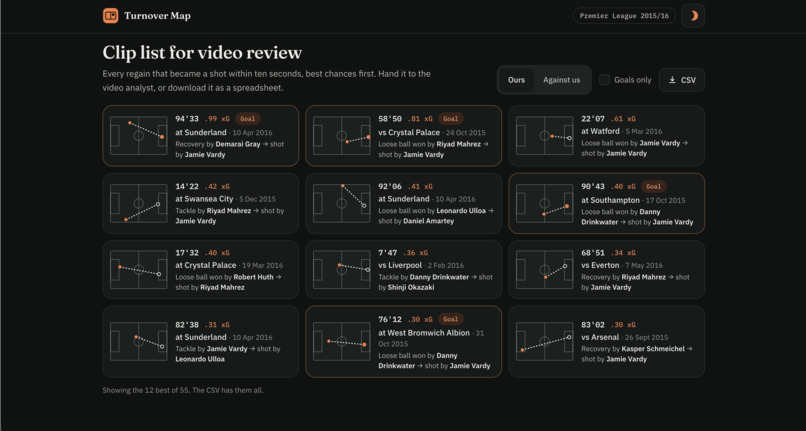
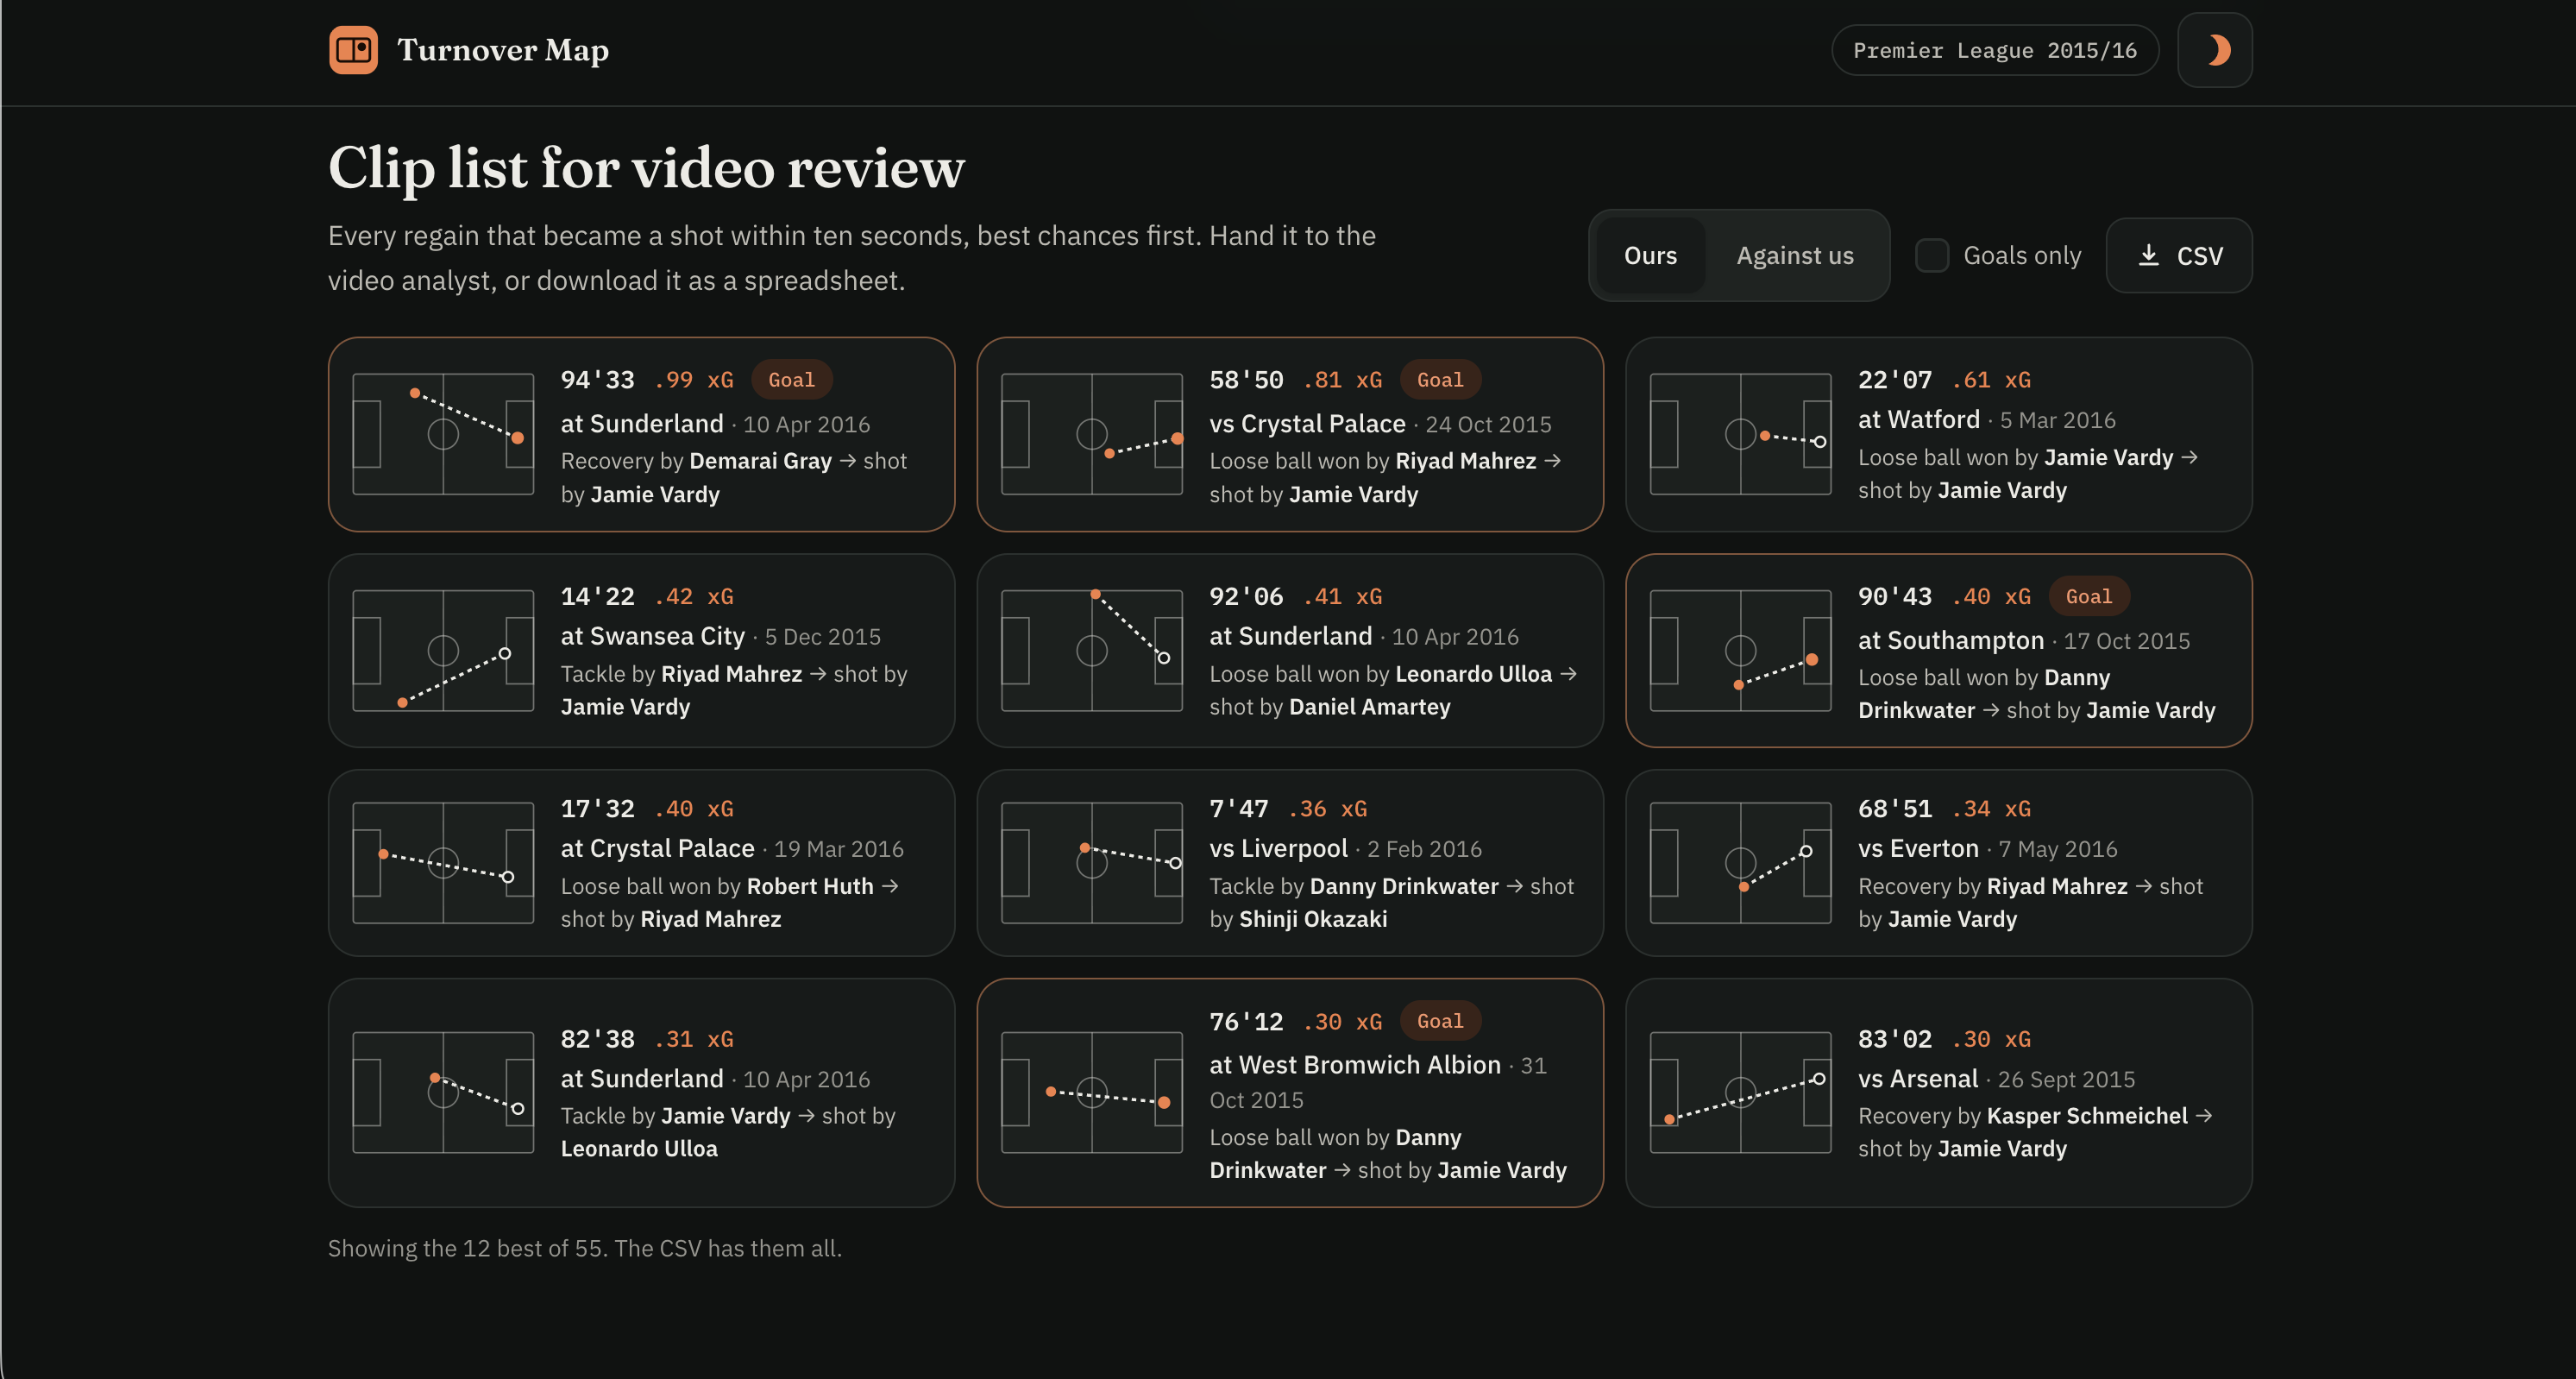
- A clip list for video staff. Every regain that became a shot, with match, minute, ball-winner and shooter. Exports to CSV.
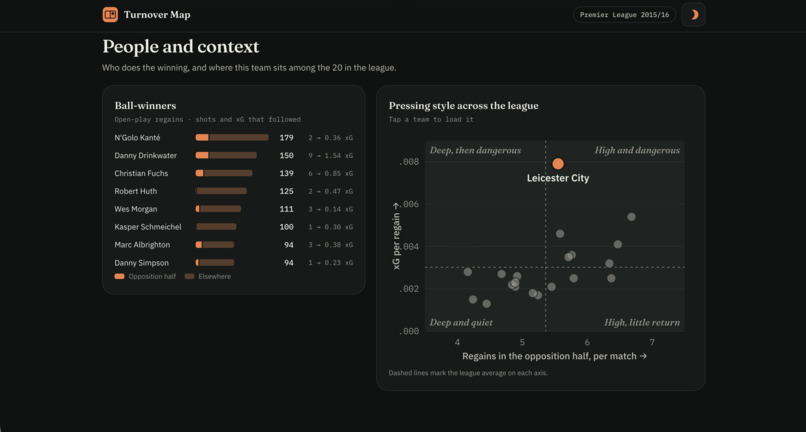
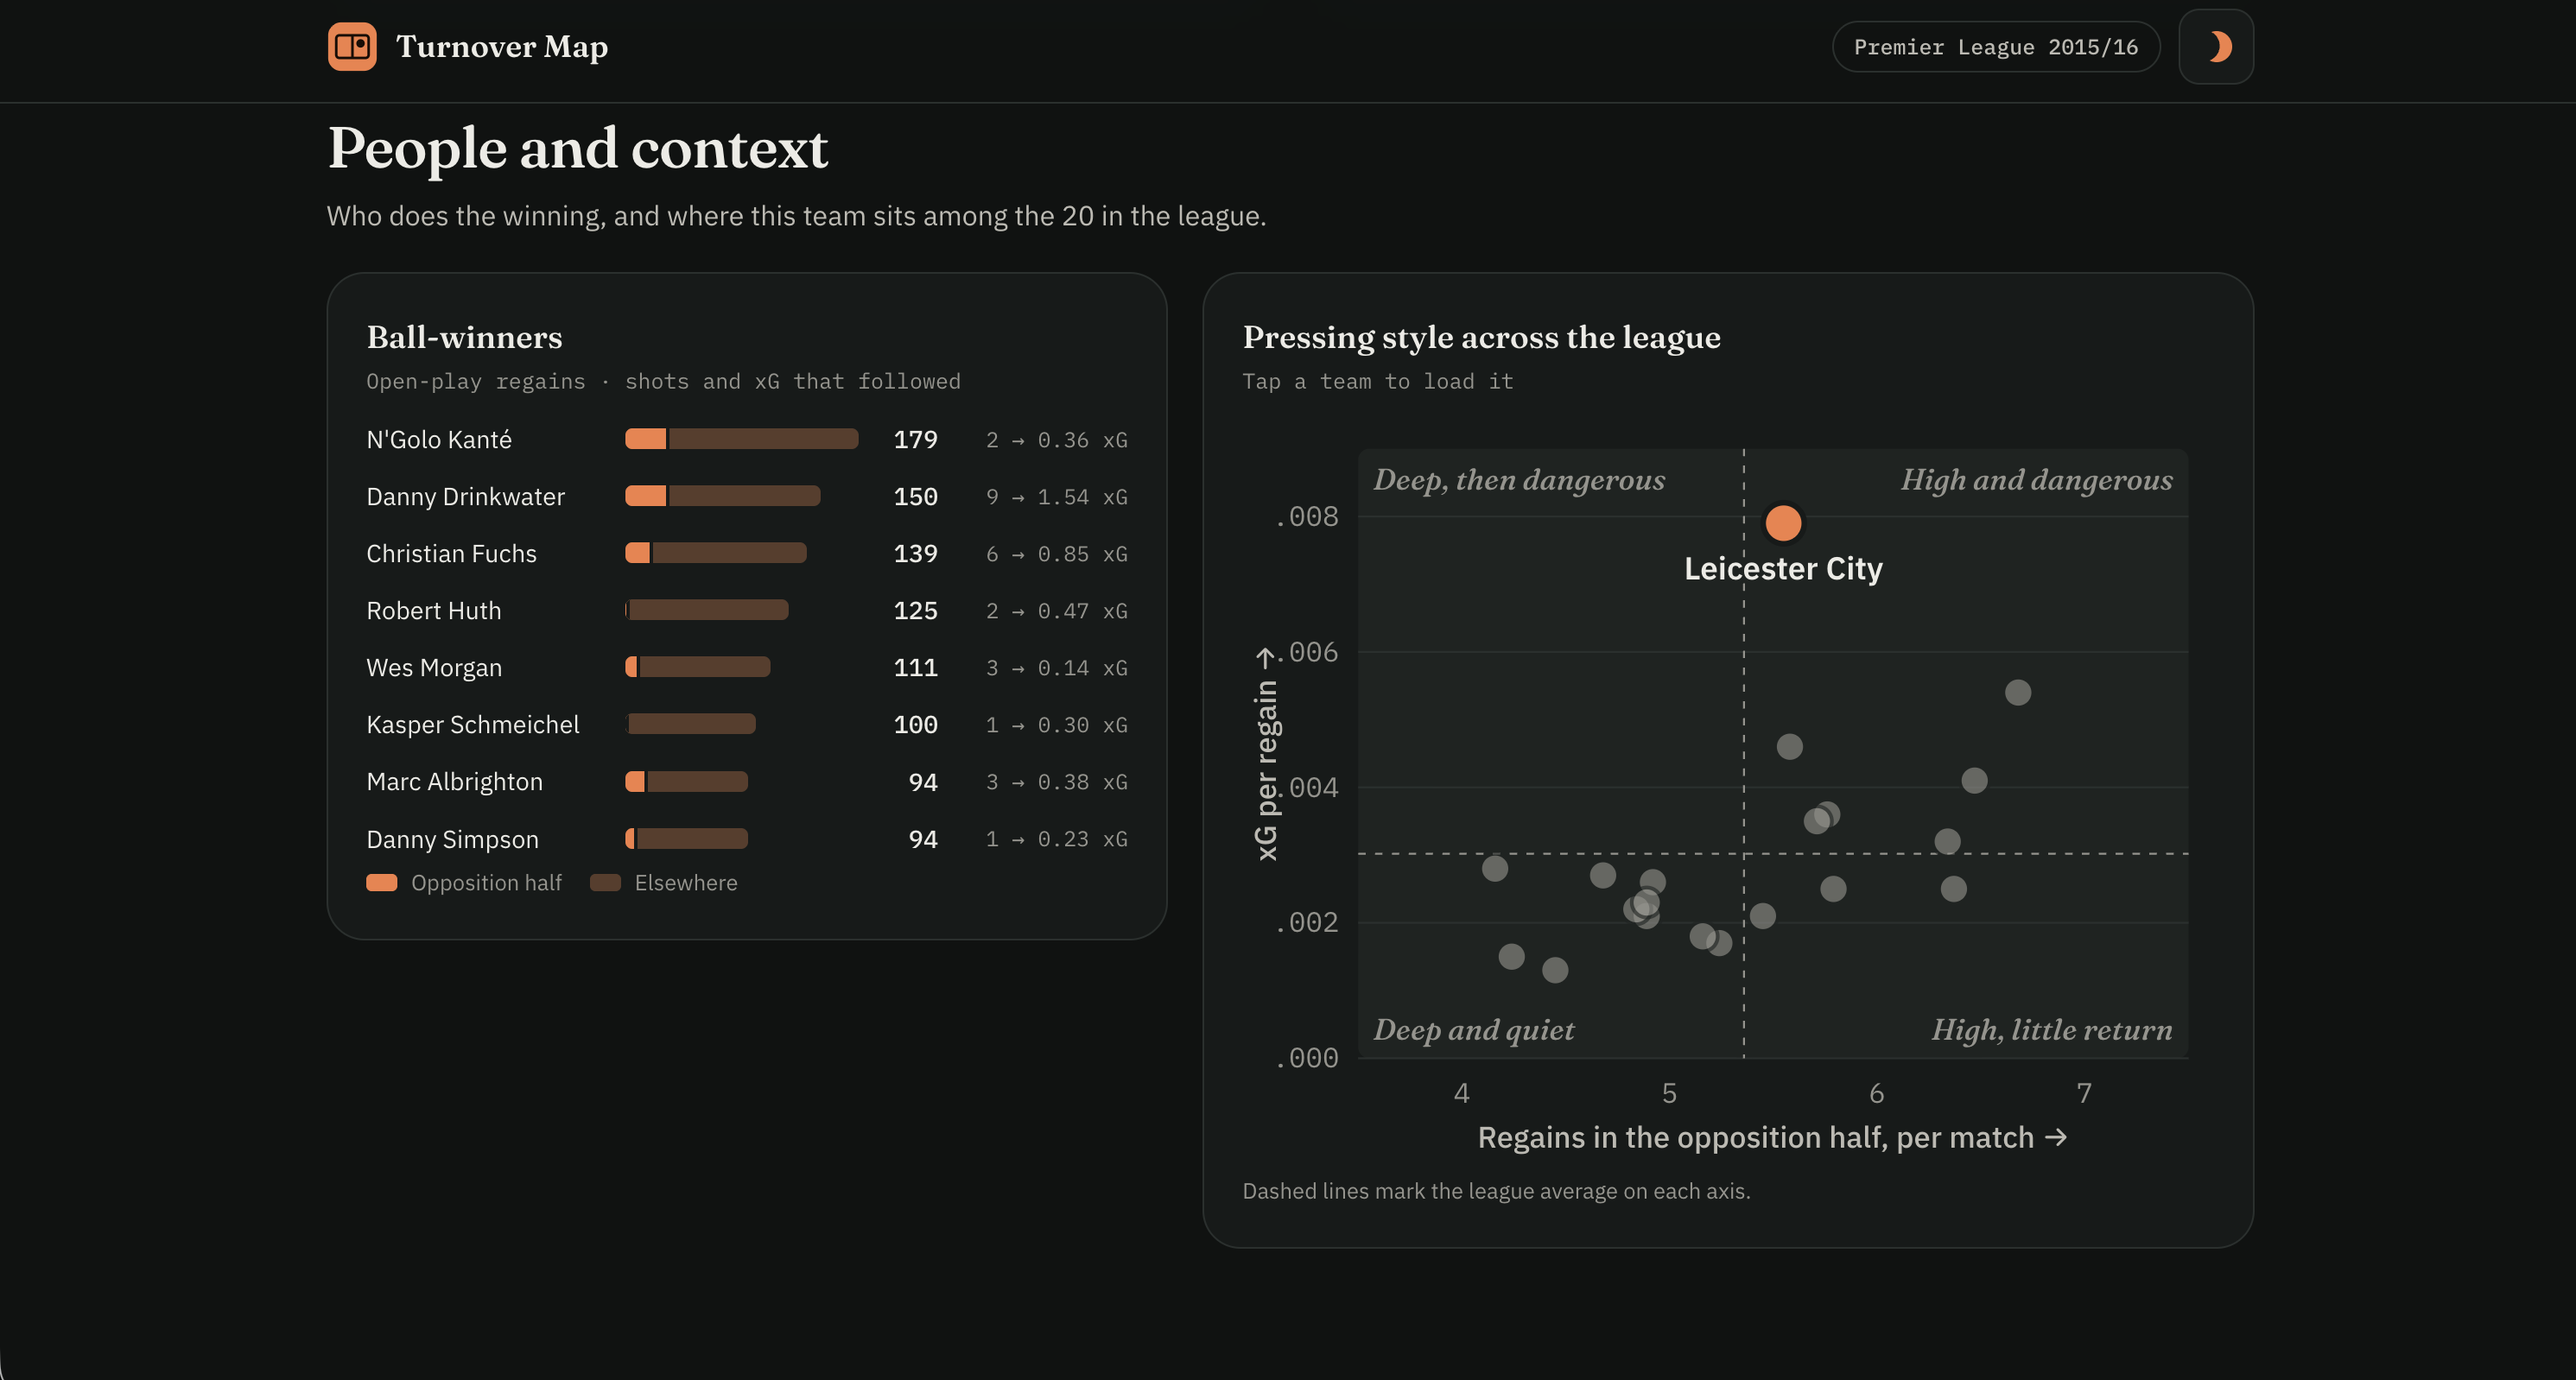
- Game-state split (leading / level / trailing), top ball-winners, and a league-wide pressing-style scatter.
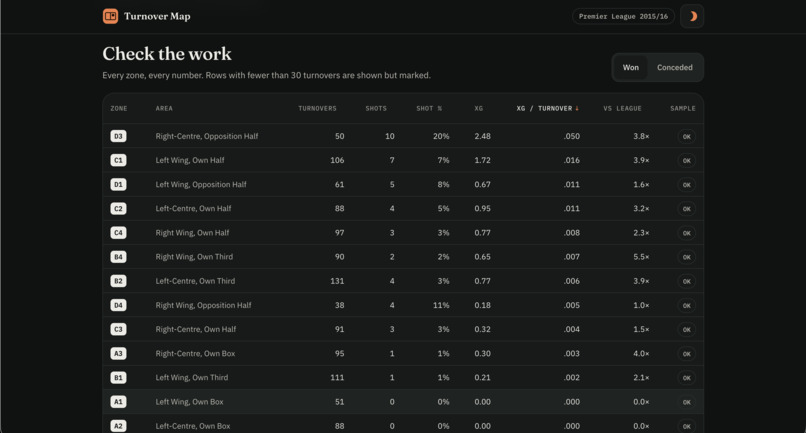
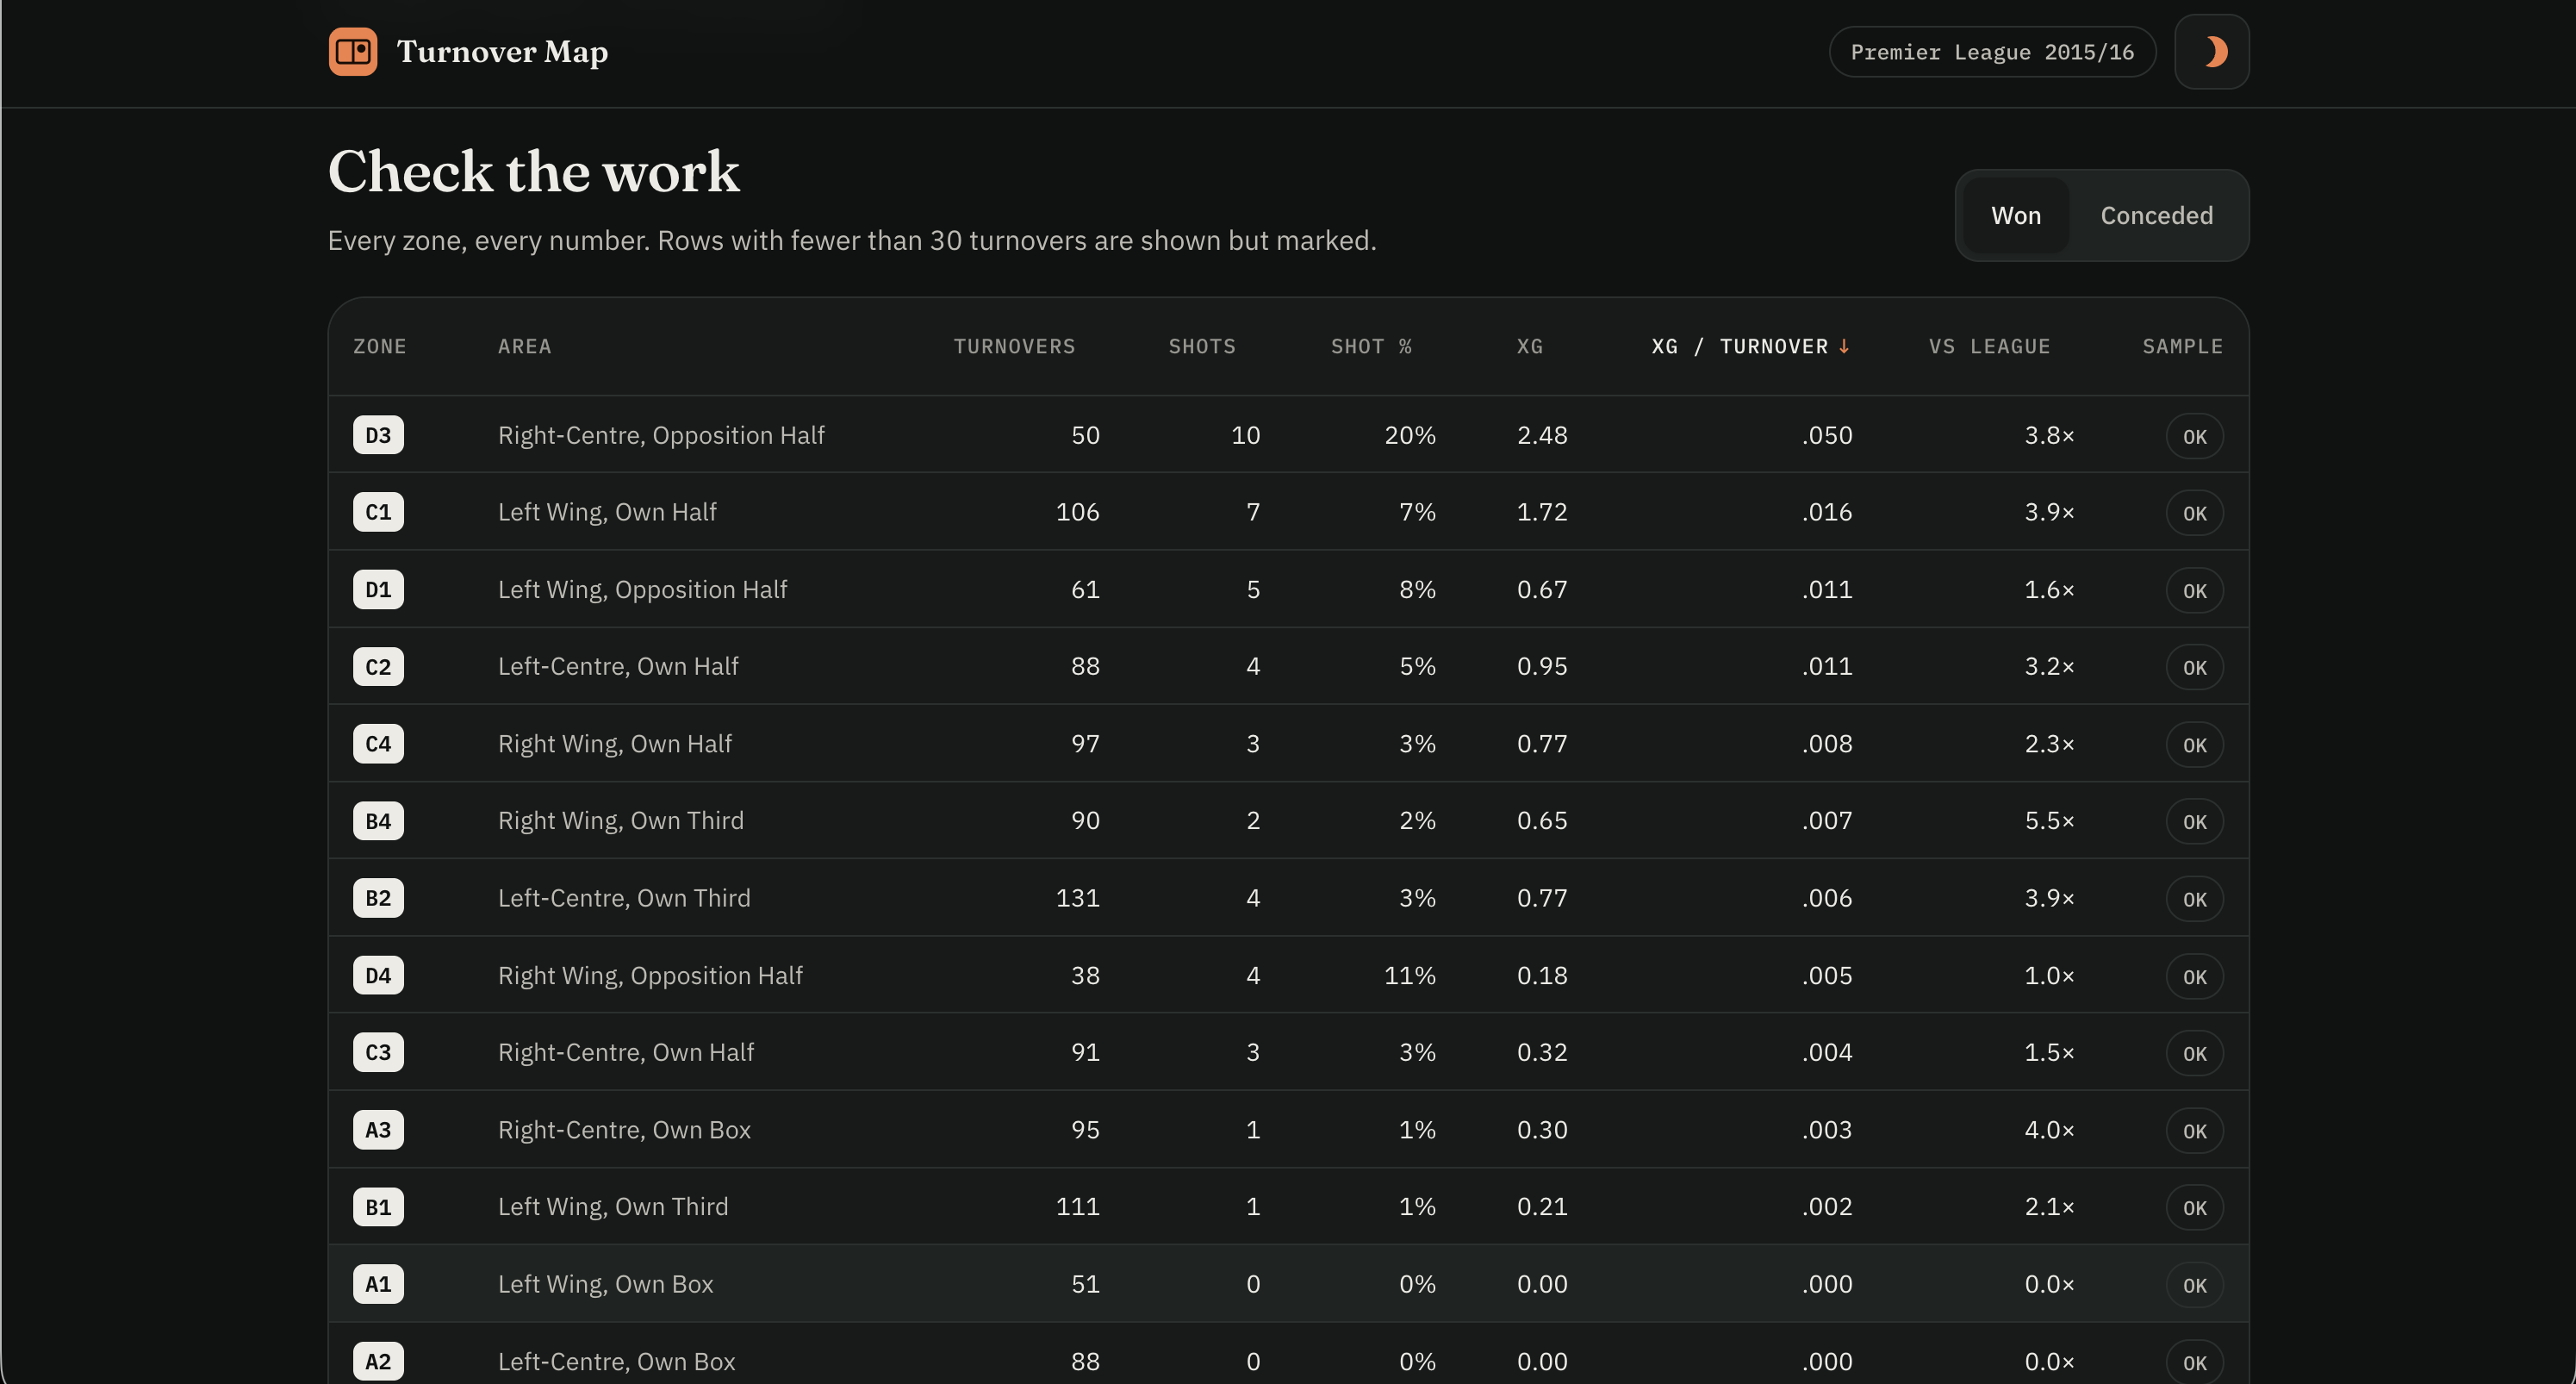
- A full table with sample sizes so anyone can check the work, plus a printable briefing and a share link per team.
Actionable impact
- Pressing triggers: commit runners where regains pay off, not just where they happen.
- Post-regain coaching: a zone where the team wins the ball often but gets less than the league from it points to the next action (first pass, support runs), not the press itself.
- Rest-defence: the vulnerability note names the zone where losing the ball cost the most xG across the season.
- Video prep: the clip list turns a season of footage into a ranked list of timestamps.
How I built it
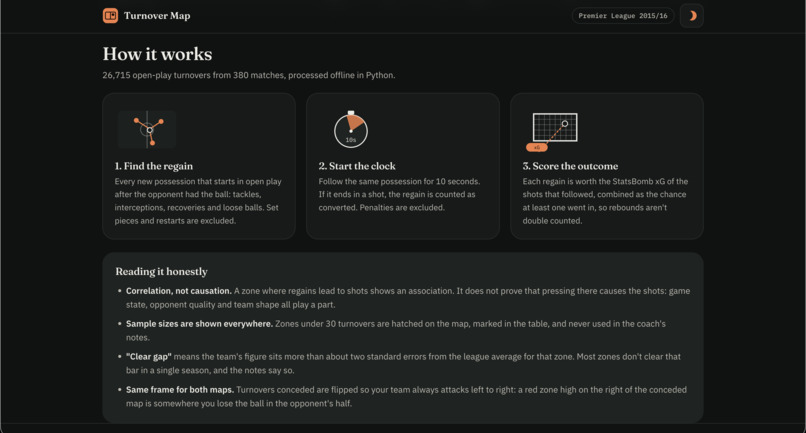
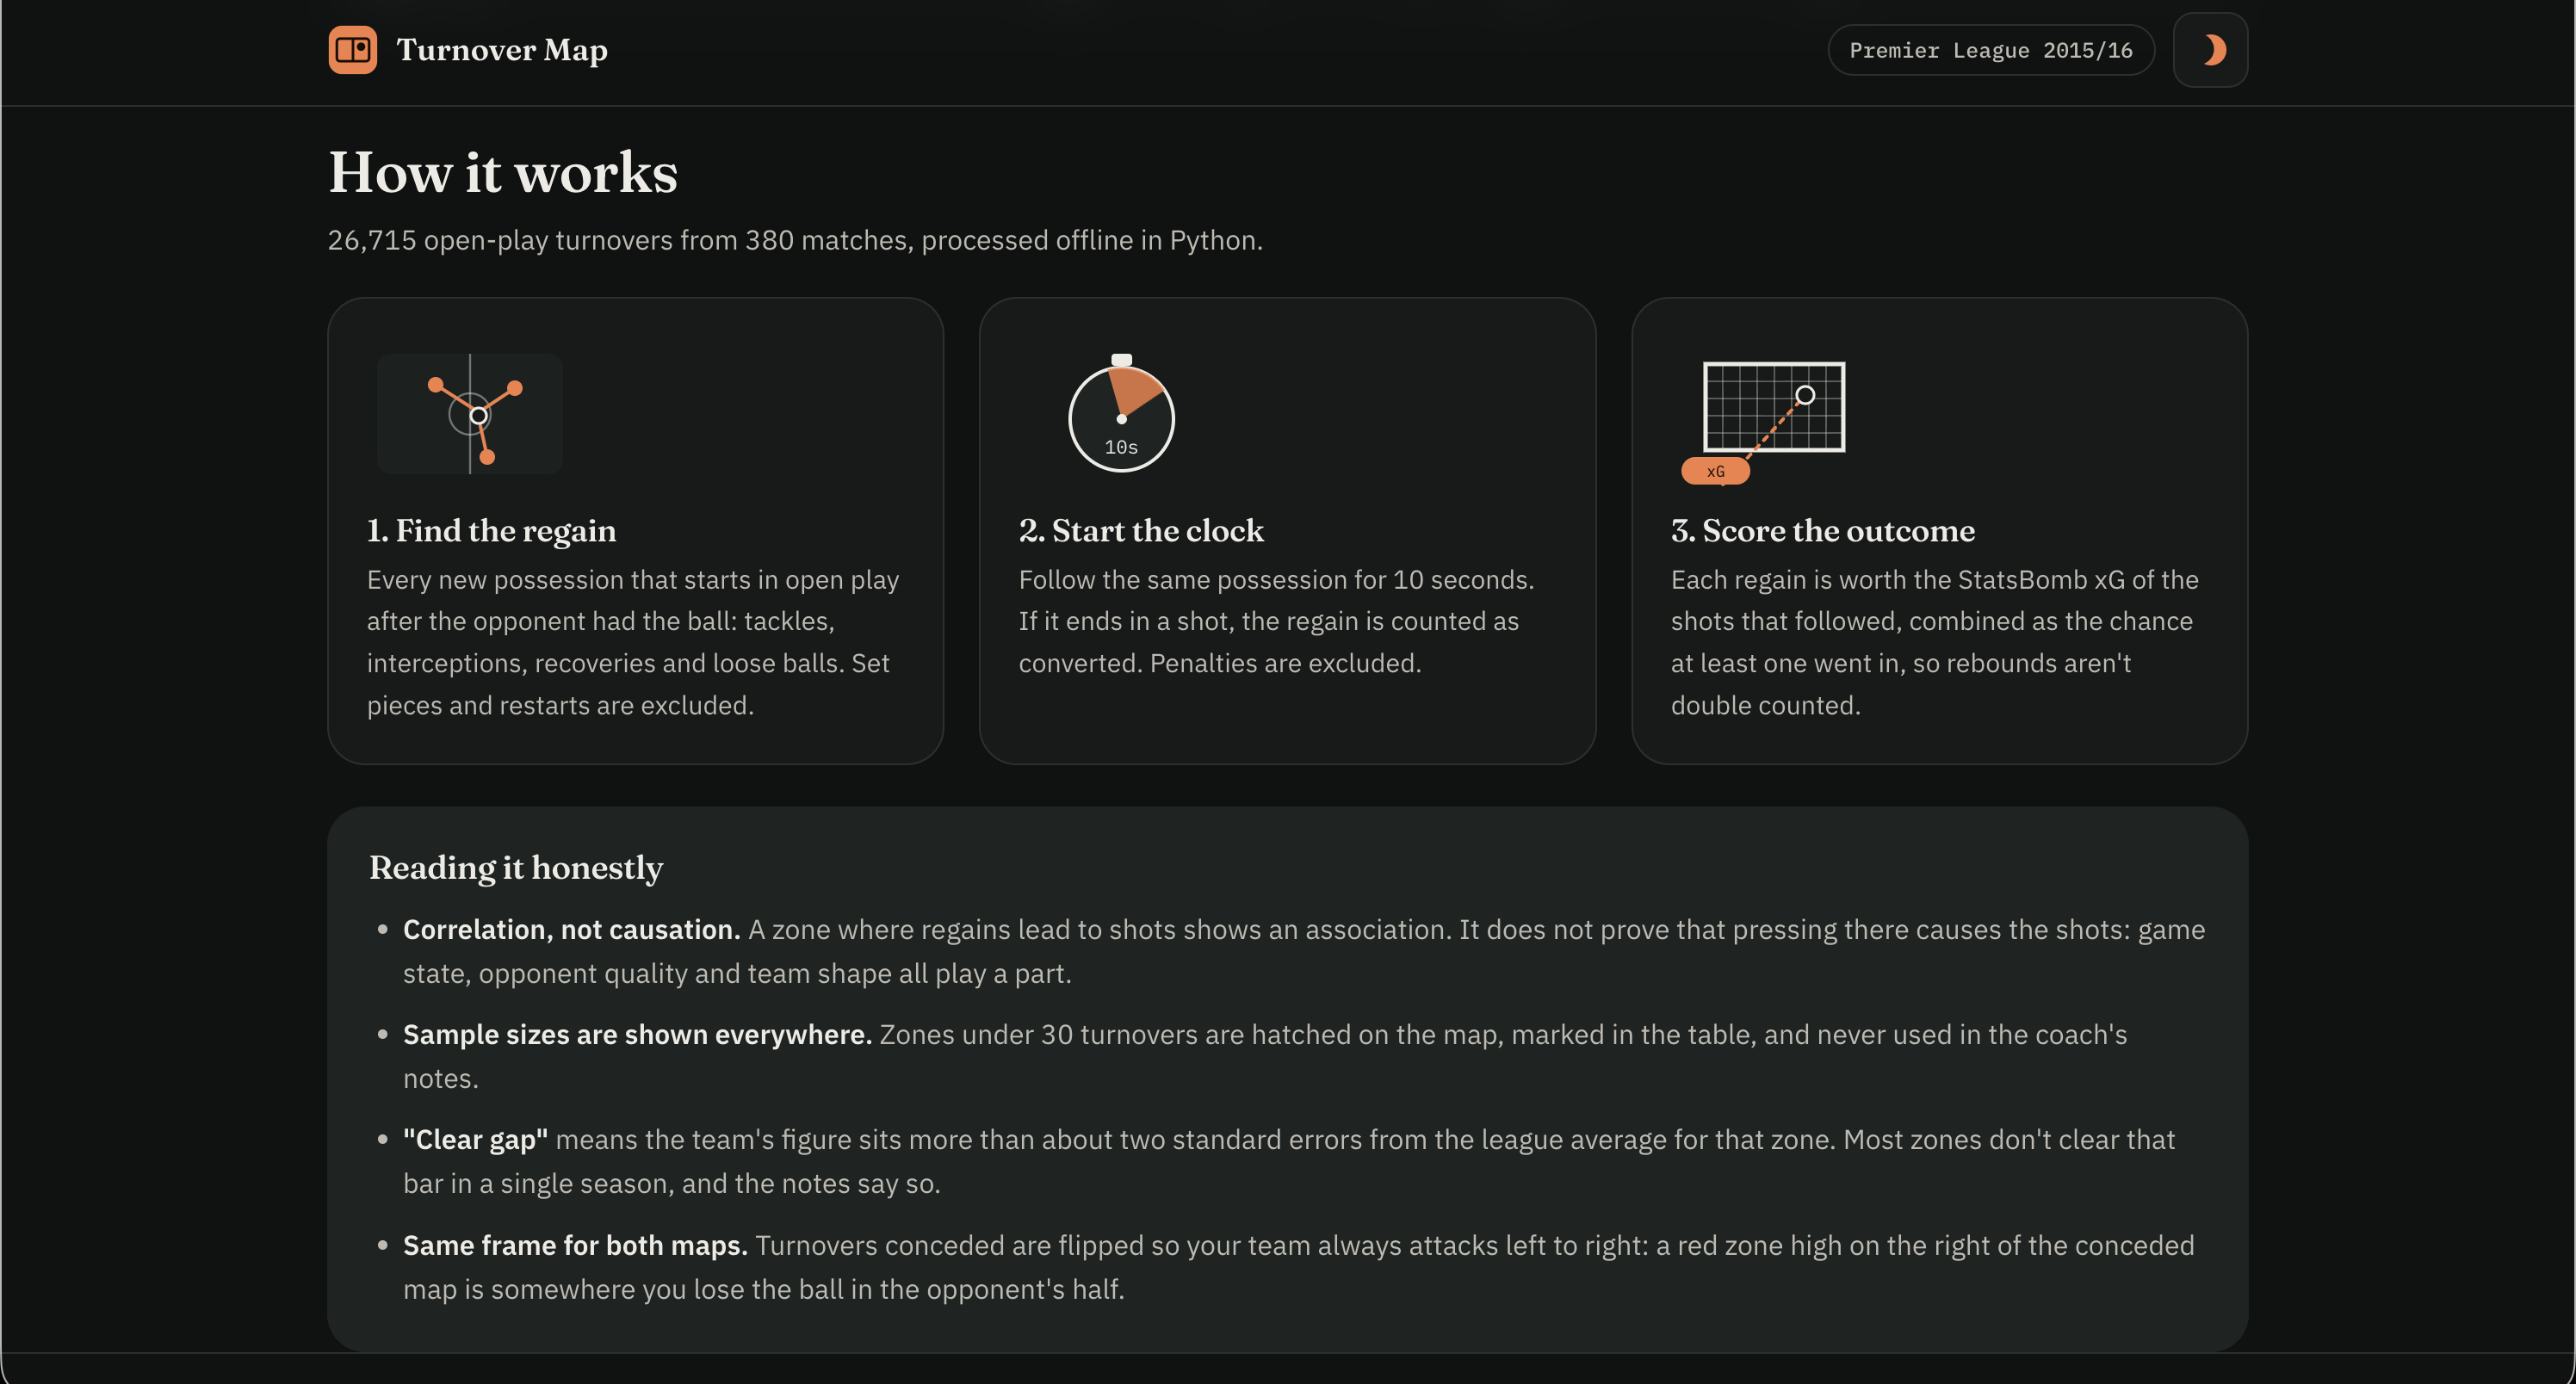
- Python + pandas, offline. For each new possession that starts in open play after the opponent had the ball, the pipeline finds the tackle, interception or recovery that won it, follows the possession for 10 seconds, and values it with the StatsBomb xG of any shots, combined as the chance at least one scored: \( 1 - \prod_i (1 - xG_i) \), so rebounds aren't double counted.
- Results are aggregated per team and zone with standard errors and league baselines, then written to one JSON file.
- React + TypeScript + plain SVG front end that only reads that file: no runtime analysis and no database, so it loads instantly. Pitch, heatmaps, chains and scatter are hand-built SVG with no charting library.
- Deployed on Cloudflare Pages. 36 Python tests and 39 browser tests (Playwright, desktop and phone, including accessibility scans).
Statistical honesty
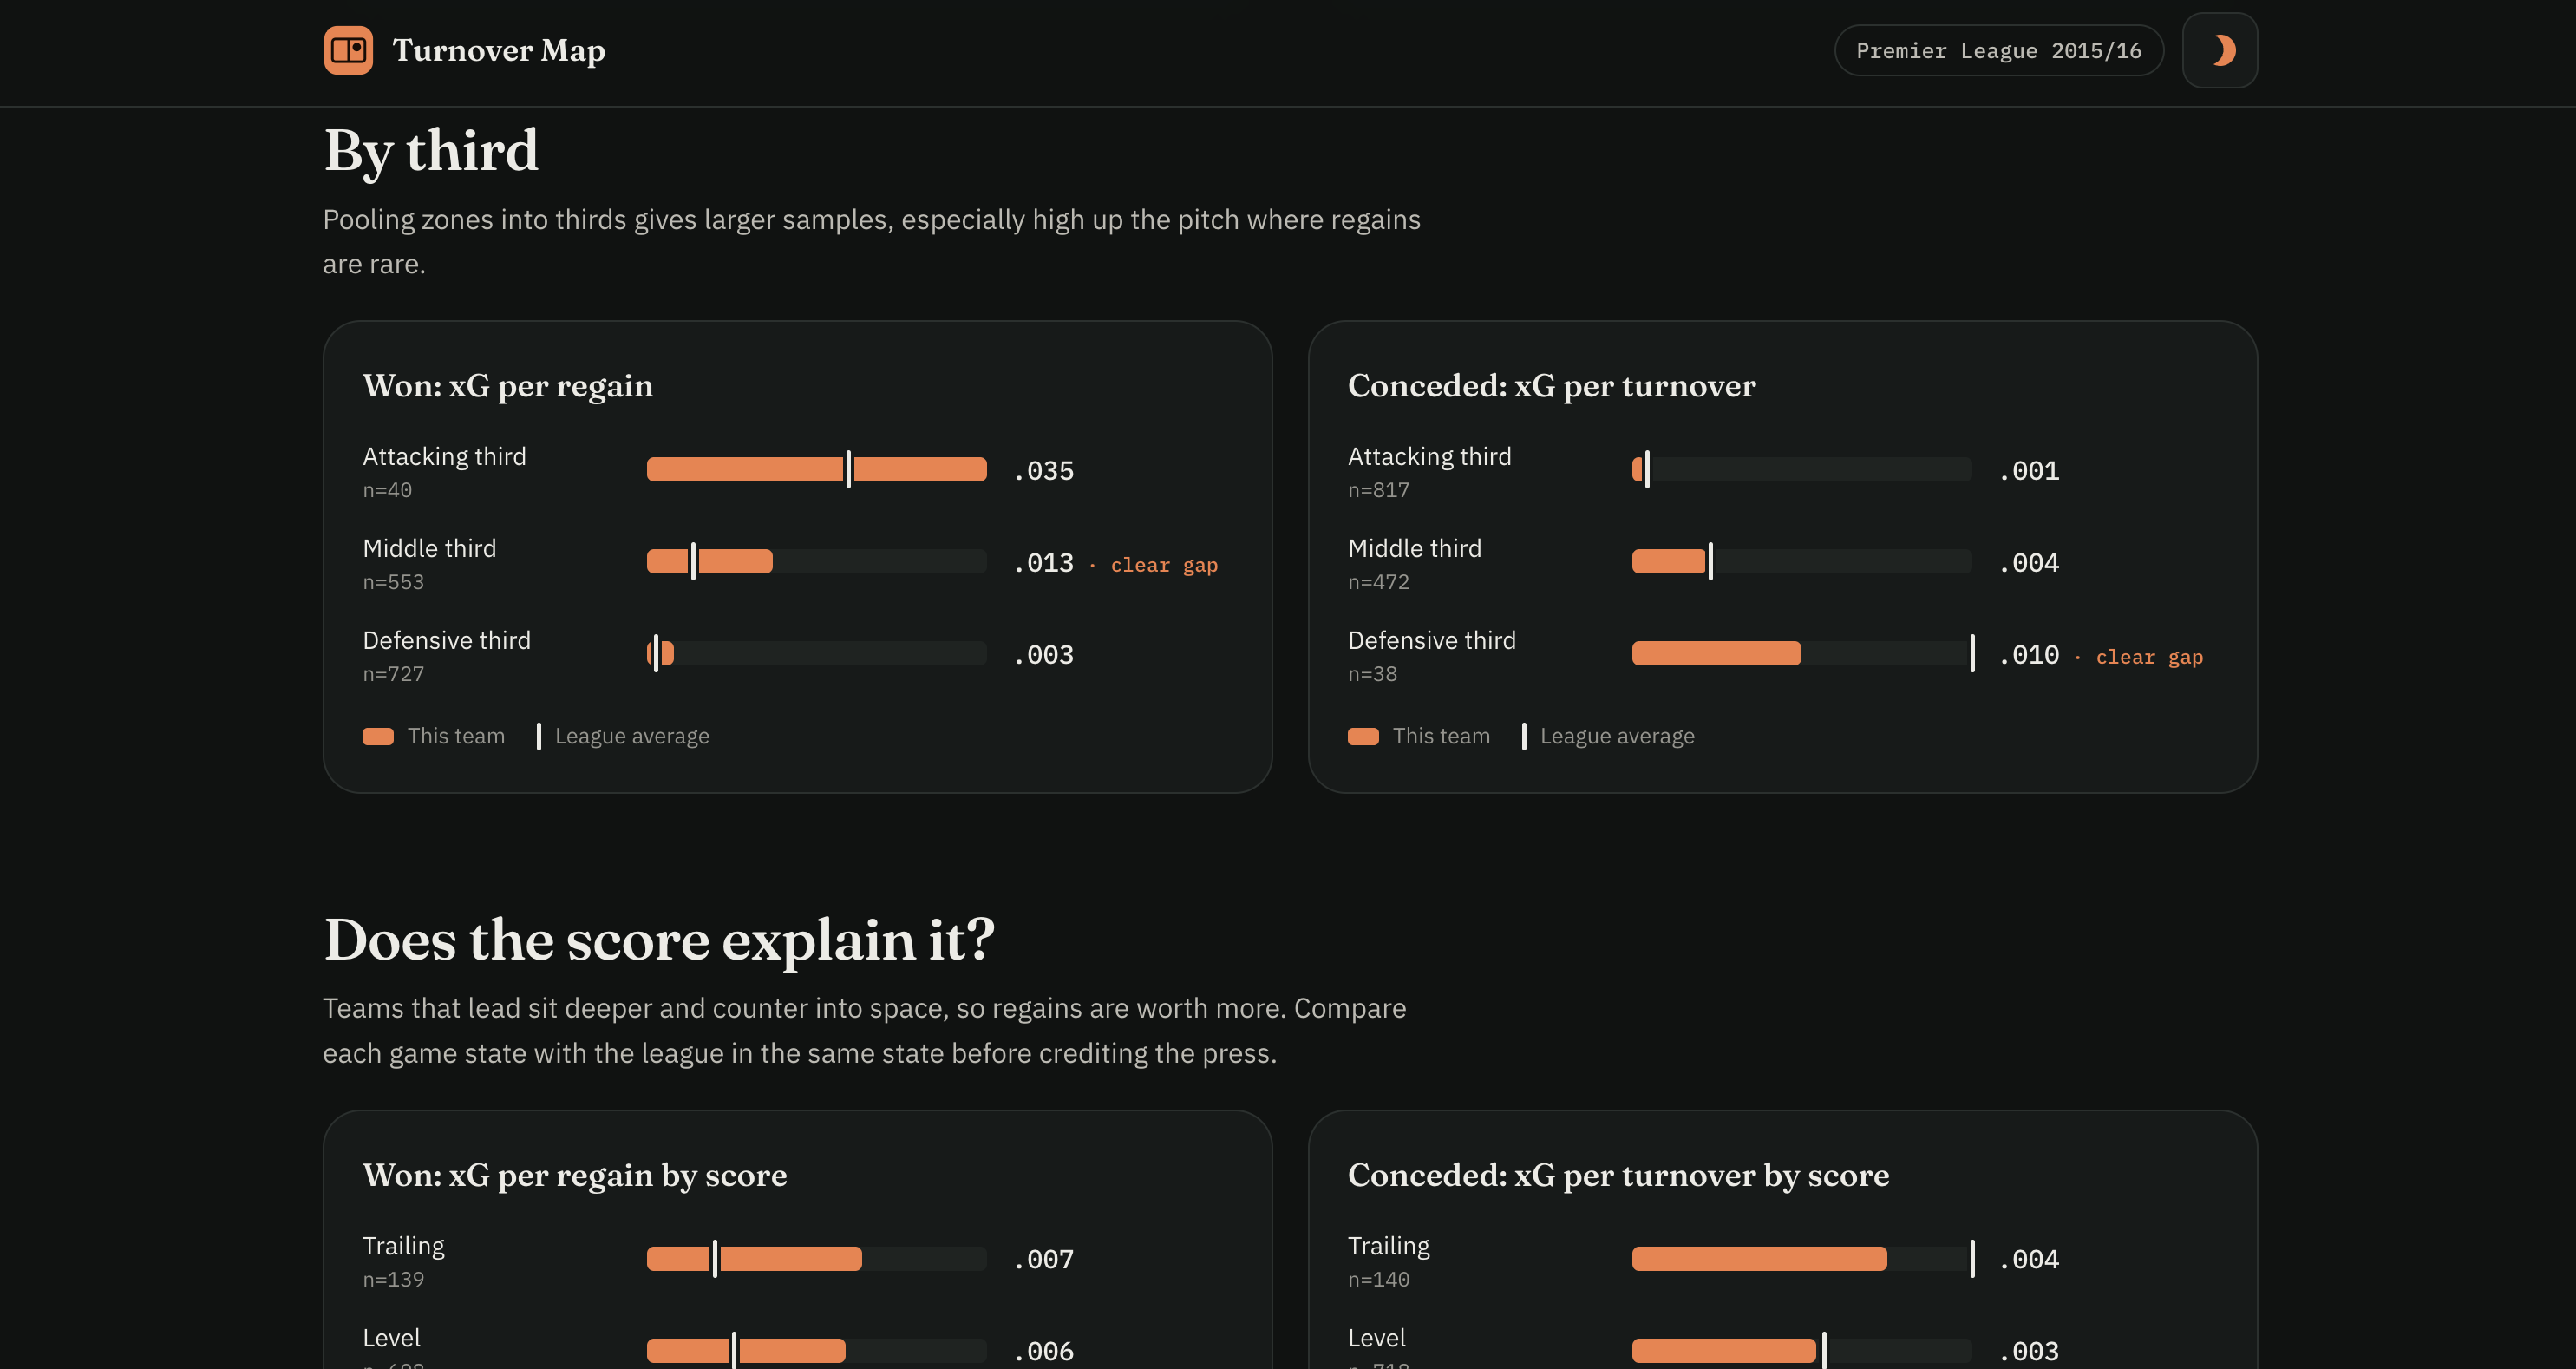
- Zones with fewer than 30 turnovers are hatched on the map, flagged in the table, and never used in the notes.
- A gap to the league is only called "clear" when it exceeds about two standard errors. Otherwise the notes say it's within normal variation.
- These are associations, not causes. The game-state view shows why: Leicester's regains were worth 2.2× the league rate while leading, because teams chasing a game leave space.
Challenges
- StatsBomb often logs the tackle or interception that wins the ball inside the opponent's possession, a moment before the new one starts. I had to look back a few seconds to get the true regain point and type.
- The final-third zones rarely reach 30 turnovers for a single team in a season, so I added a by-thirds rollup to answer the high-press question with a usable sample.
- Writing generated notes that are honest about uncertainty but still useful to a coach.
What I learned
Checking the output against football people already know builds trust in the findings they don't. Leicester lead the league in xG from regains, N'Golo Kanté is their top ball-winner, and the top regain-to-goal chains include Vardy's real counter-attacking goals at Sunderland, against Crystal Palace and at Southampton.
What's next
360 freeze-frame data to measure how many players commit to each press, multi-season views to separate pressing identity from noise, and shrinkage estimates so small zones borrow strength from the league.

Log in or sign up for Devpost to join the conversation.