Inspiration
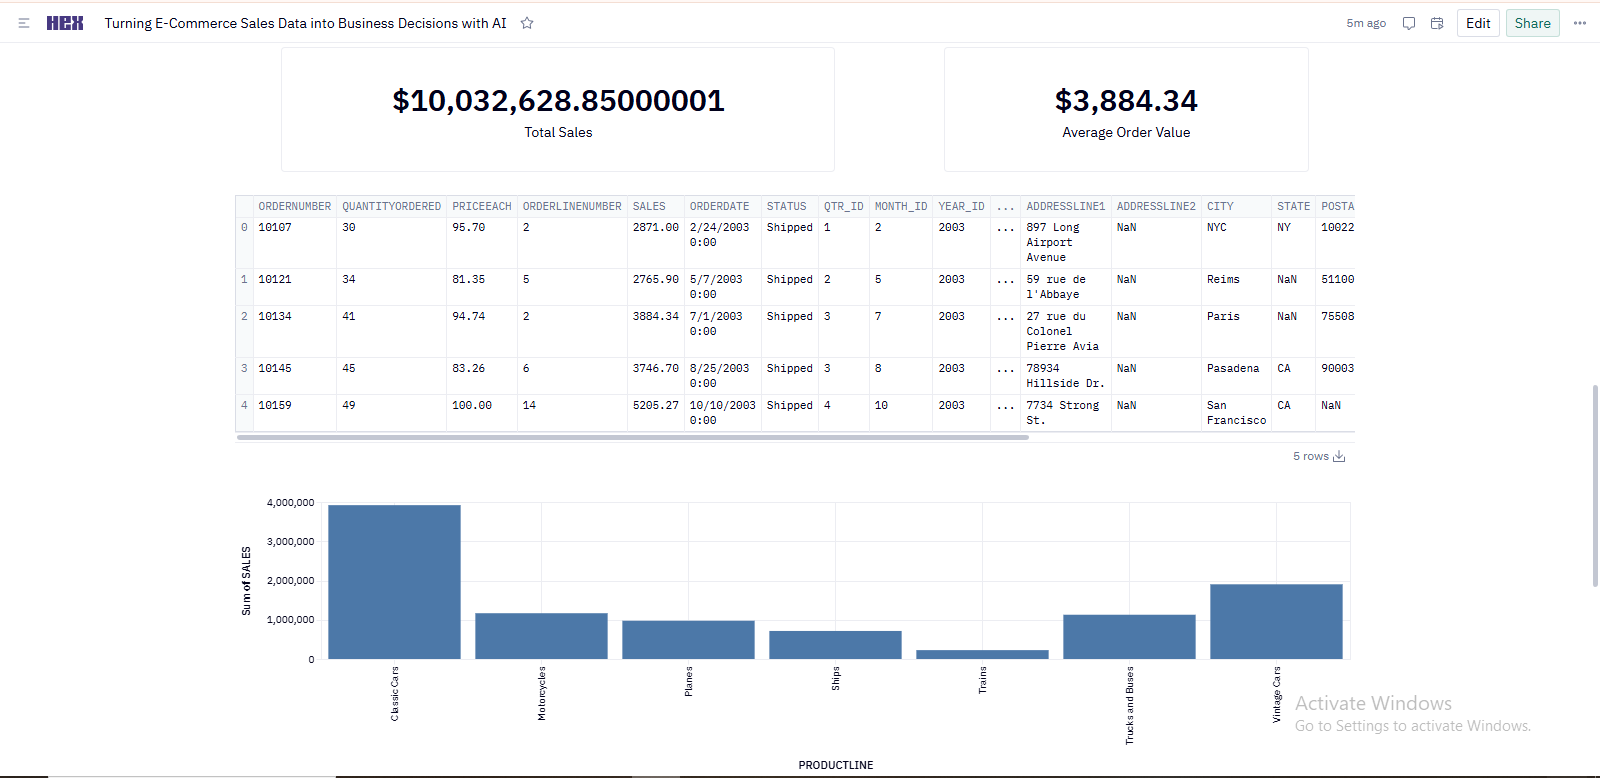
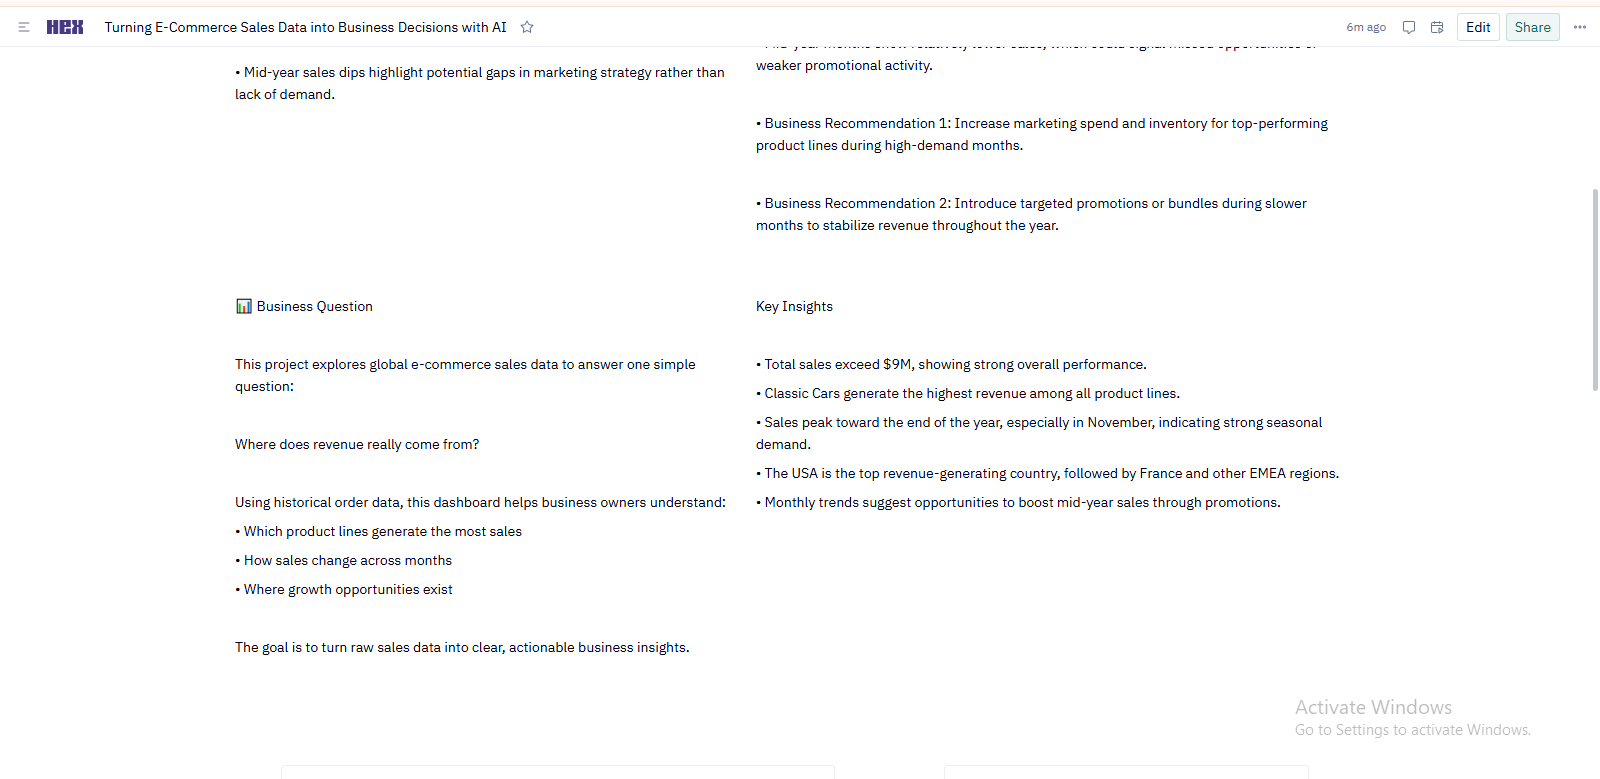
What it doesThis project analyzes global e-commerce sales data to uncover revenue drivers, seasonal patterns, and top-performing markets.
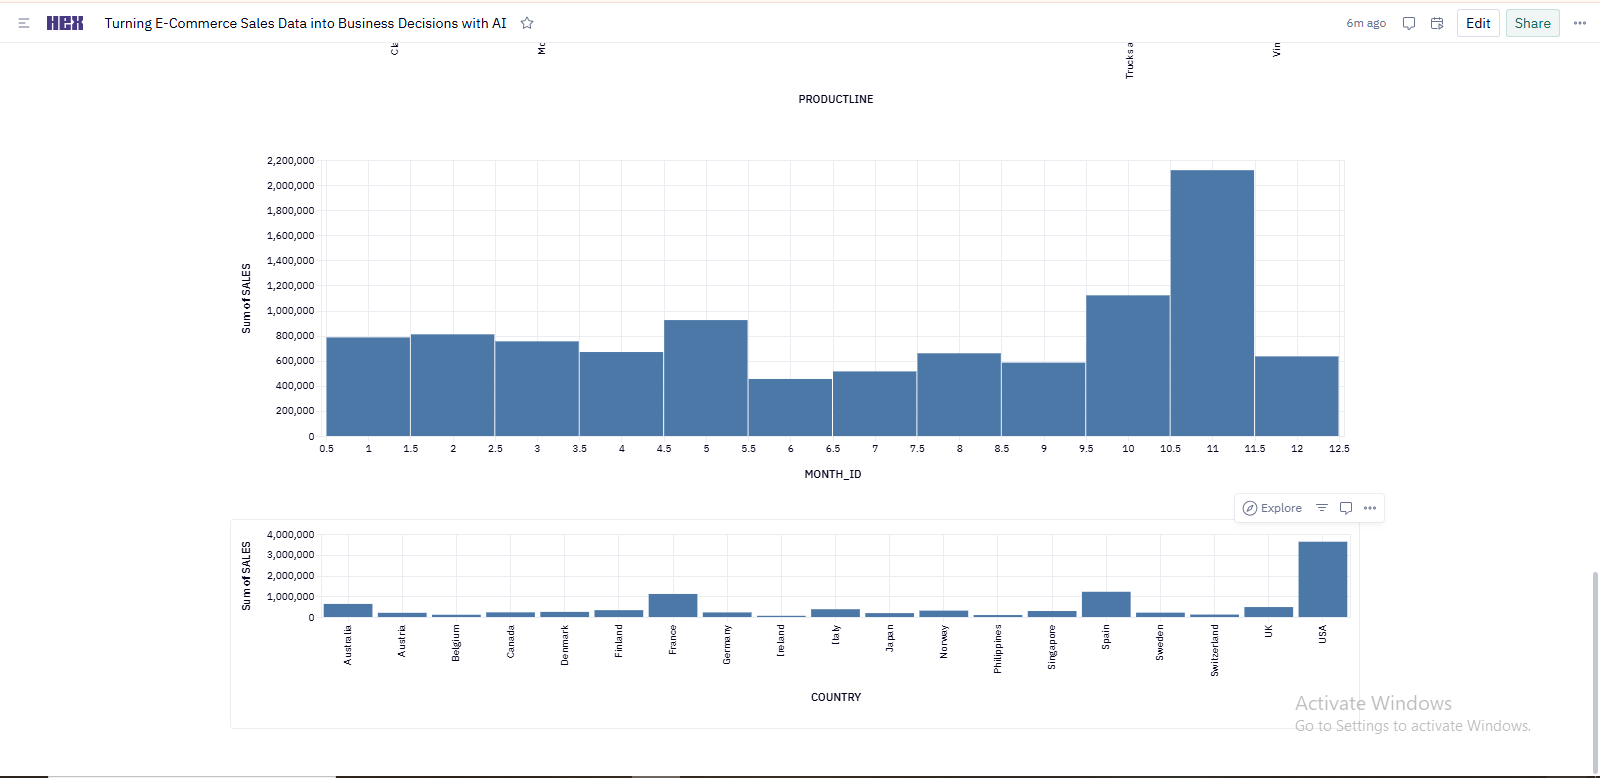
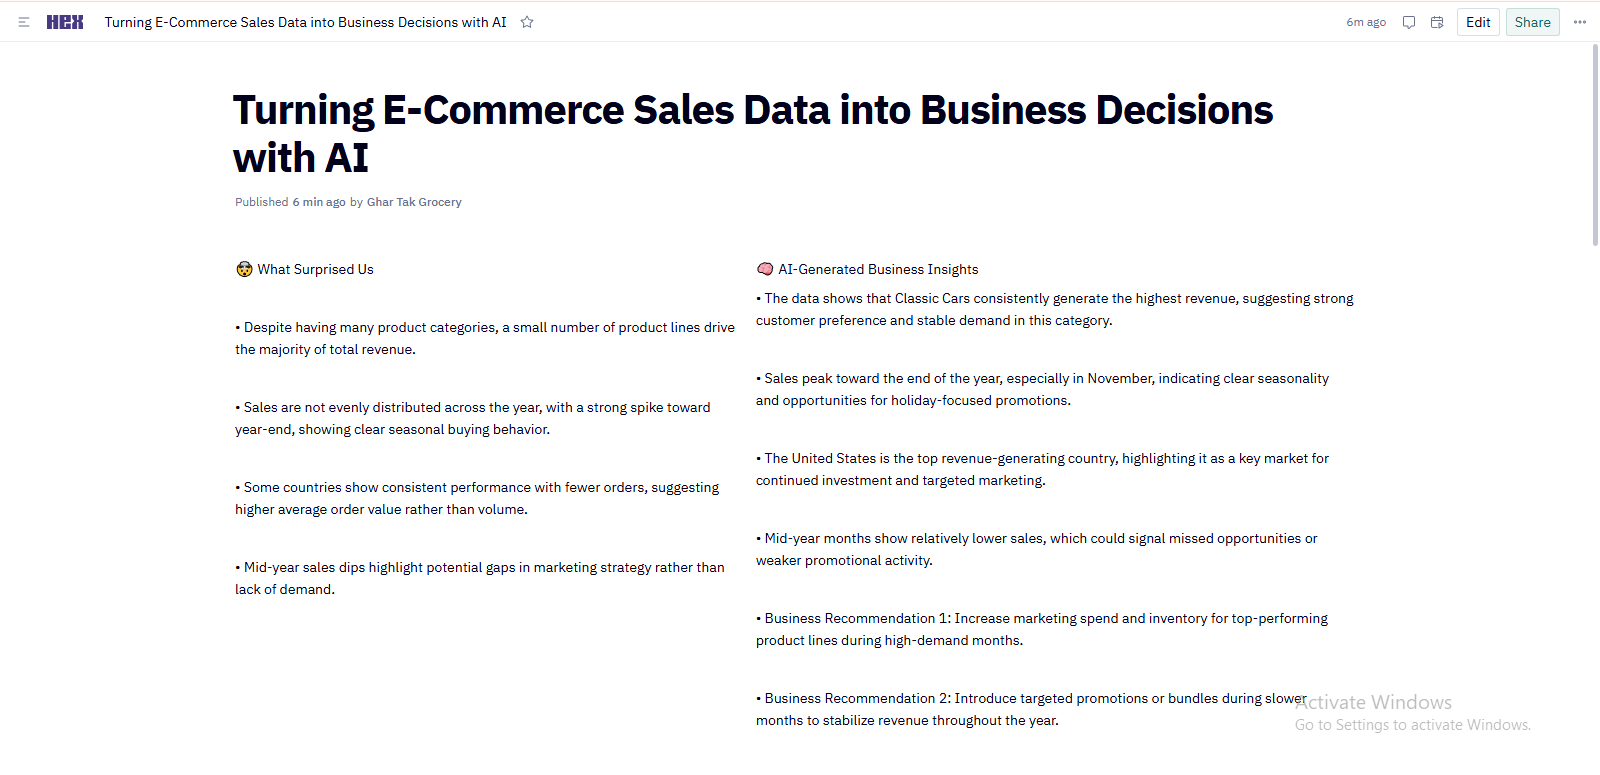
Built entirely in Hex, the dashboard combines interactive visual analytics with AI-generated insights to move beyond static charts and deliver a clear business narrative. Key findings include strong year-end seasonality, Classic Cars as the highest-revenue product line, and the United States as the leading market.
AI-assisted insights transform trends into actionable recommendations, such as inventory planning for peak months and targeted promotions during slower periods.
The result is a shareable, decision-focused analytics experience that demonstrates how Hex blends data, storytelling, and AI into a single powerful workflow.

Log in or sign up for Devpost to join the conversation.