Inspiration
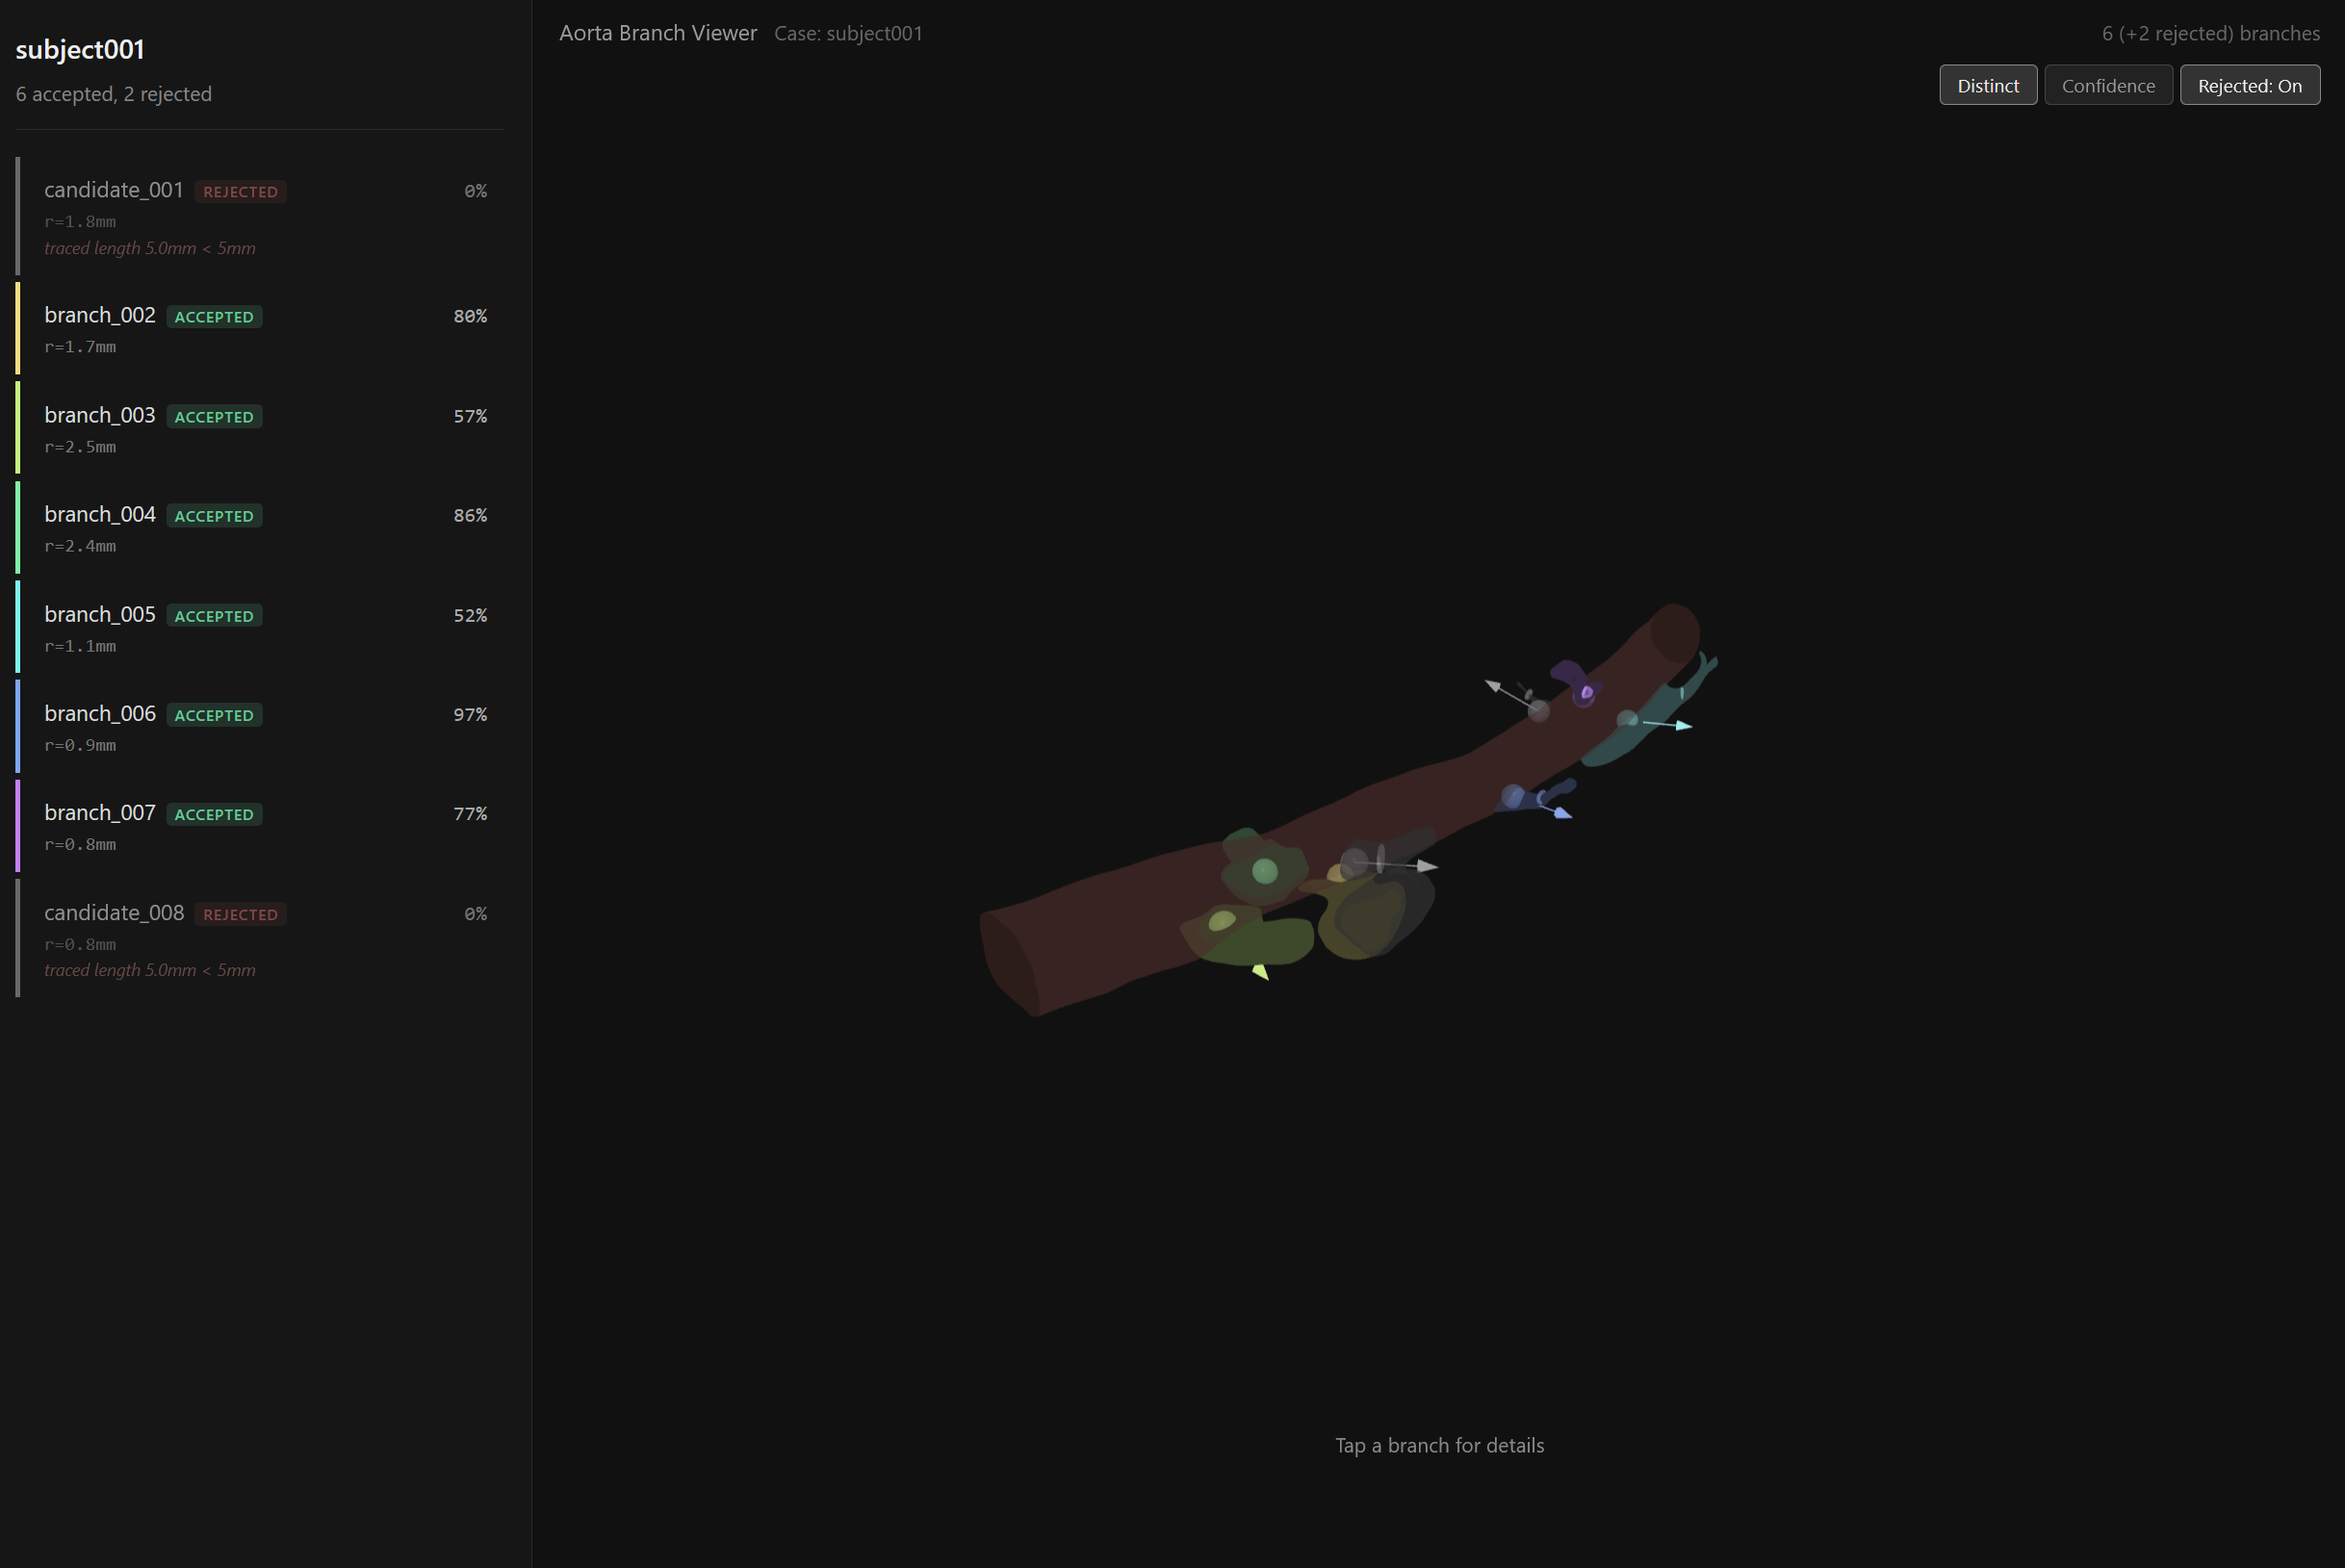
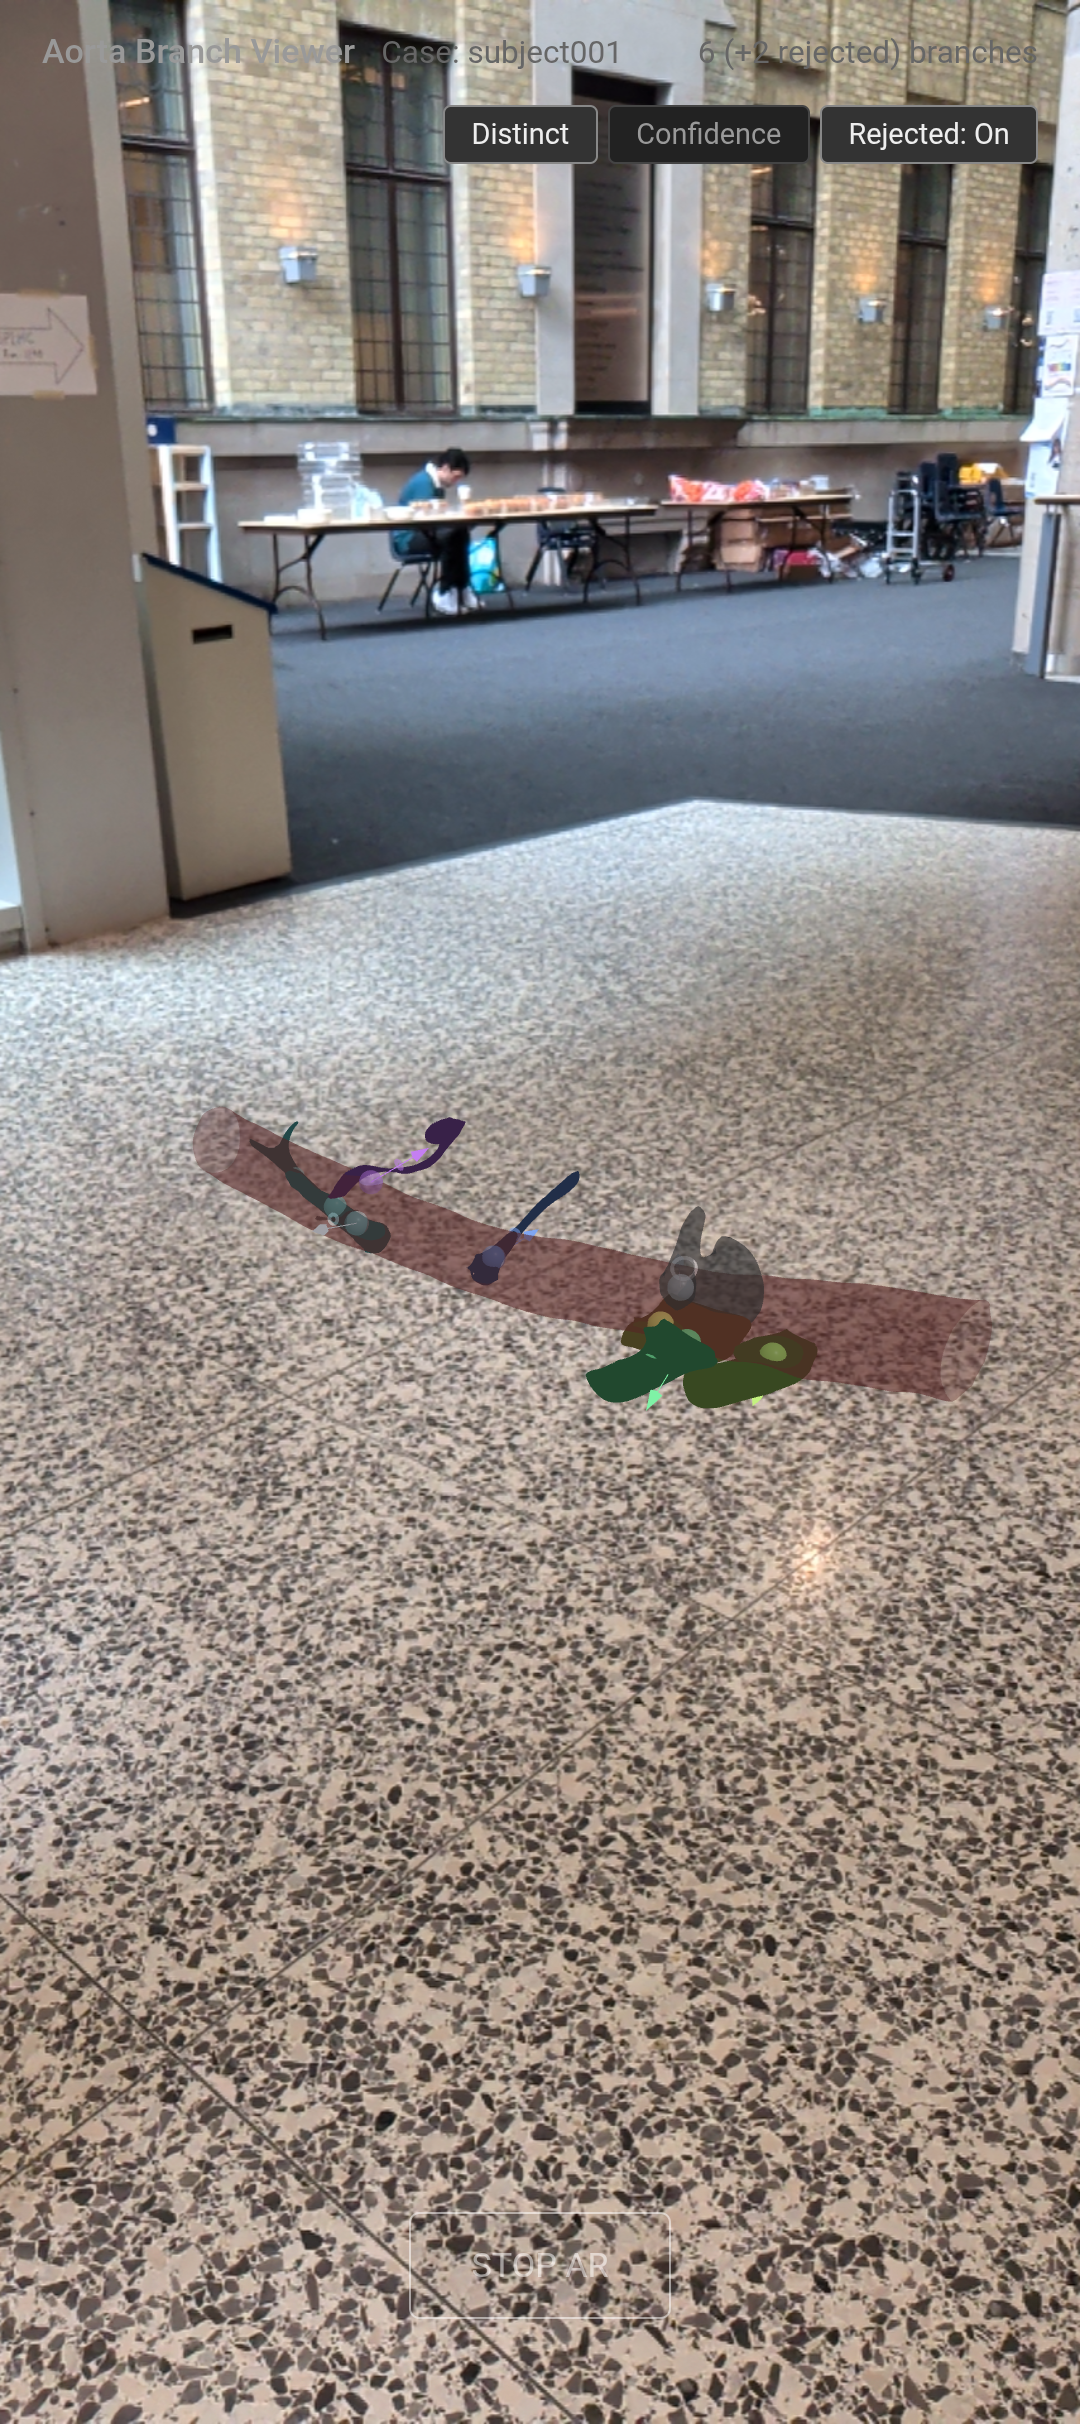
We saw the TORALIS Challenge and thought it was a cool problem. Only 5 labeled cases, no GPU, has to run on a laptop. We also wanted to build something visual on top of the detection, so we made a WebXR viewer that meshes the patient's actual aorta and lets you interact with it on your phone.
What it does
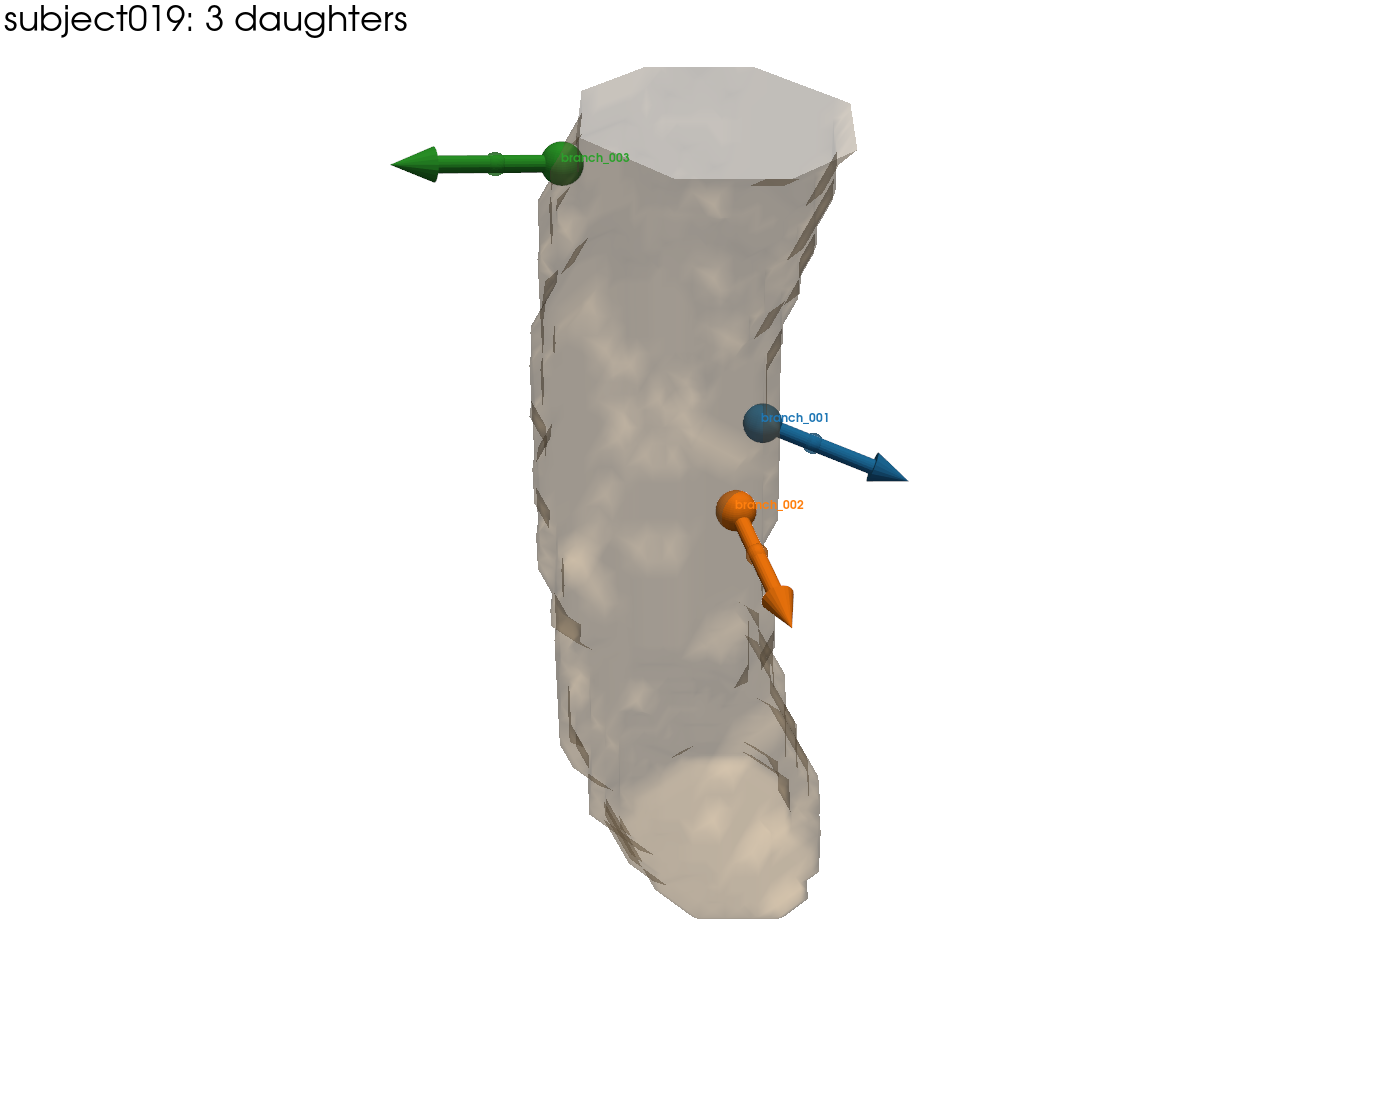
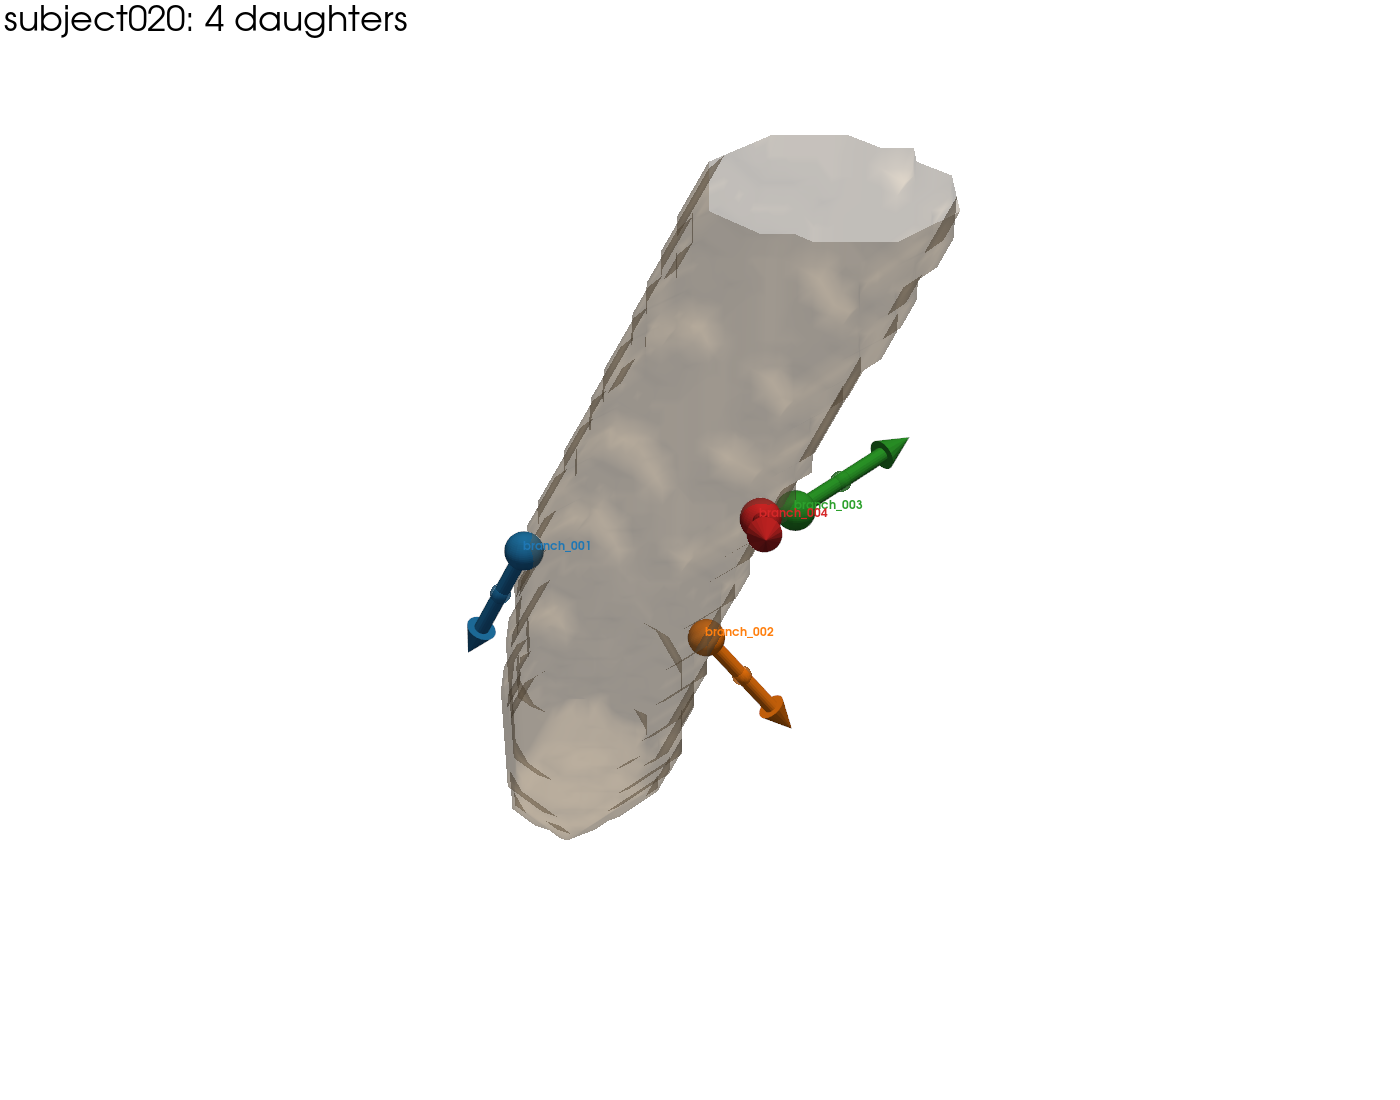
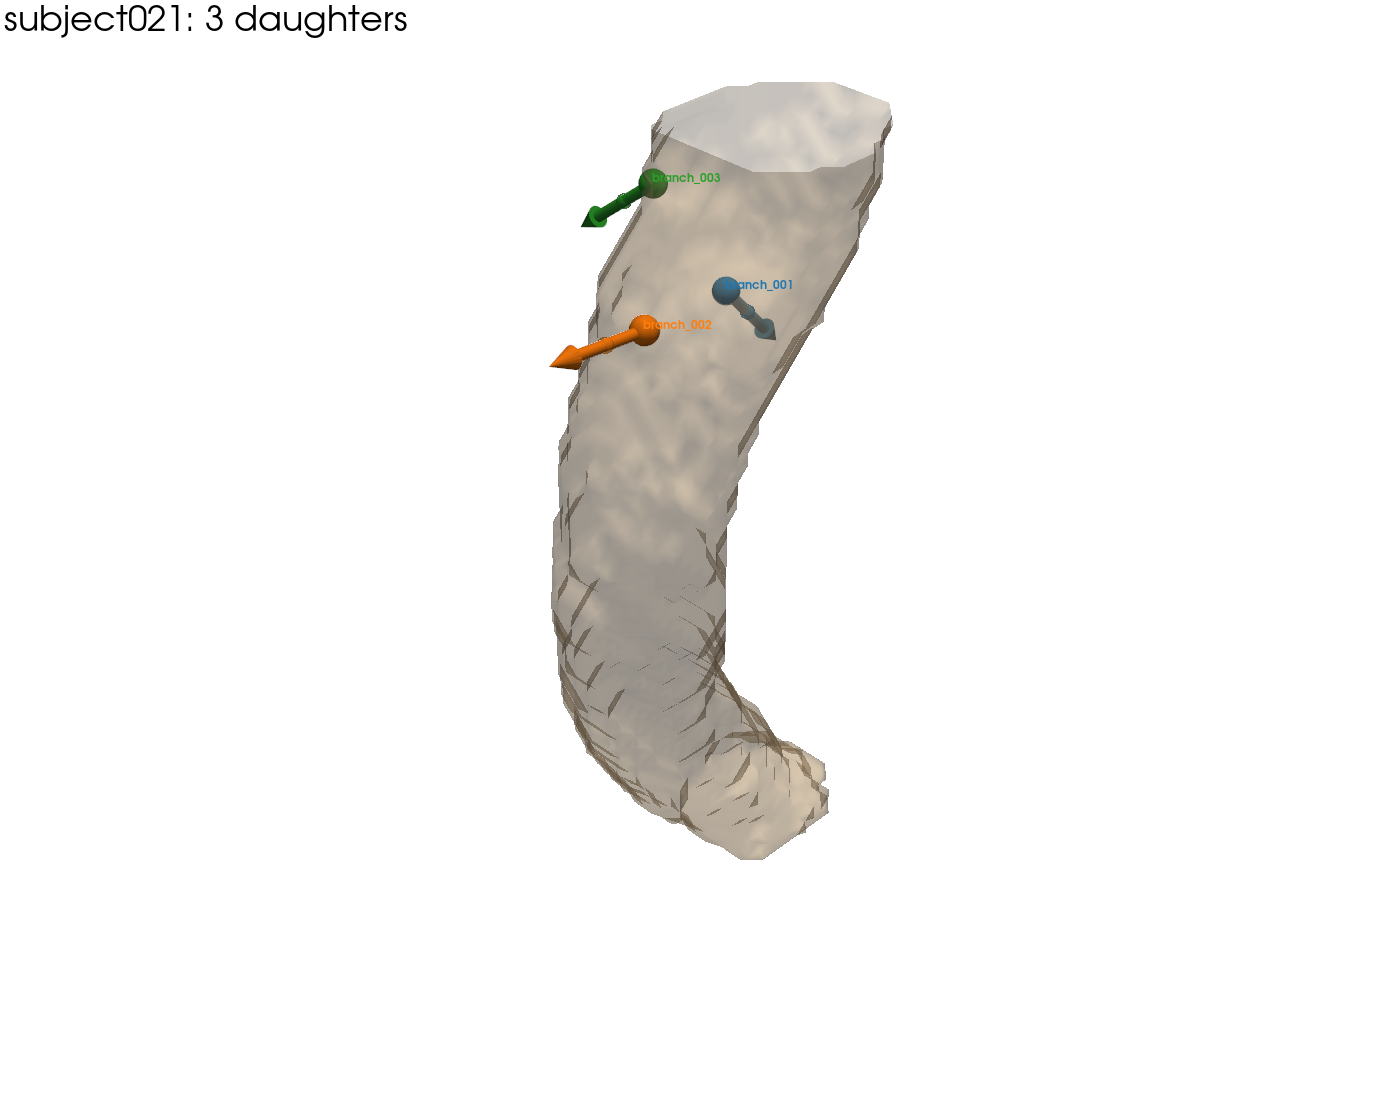
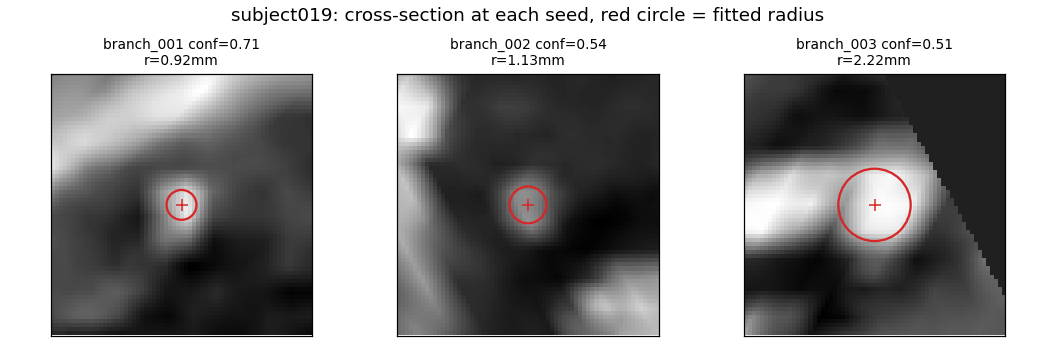
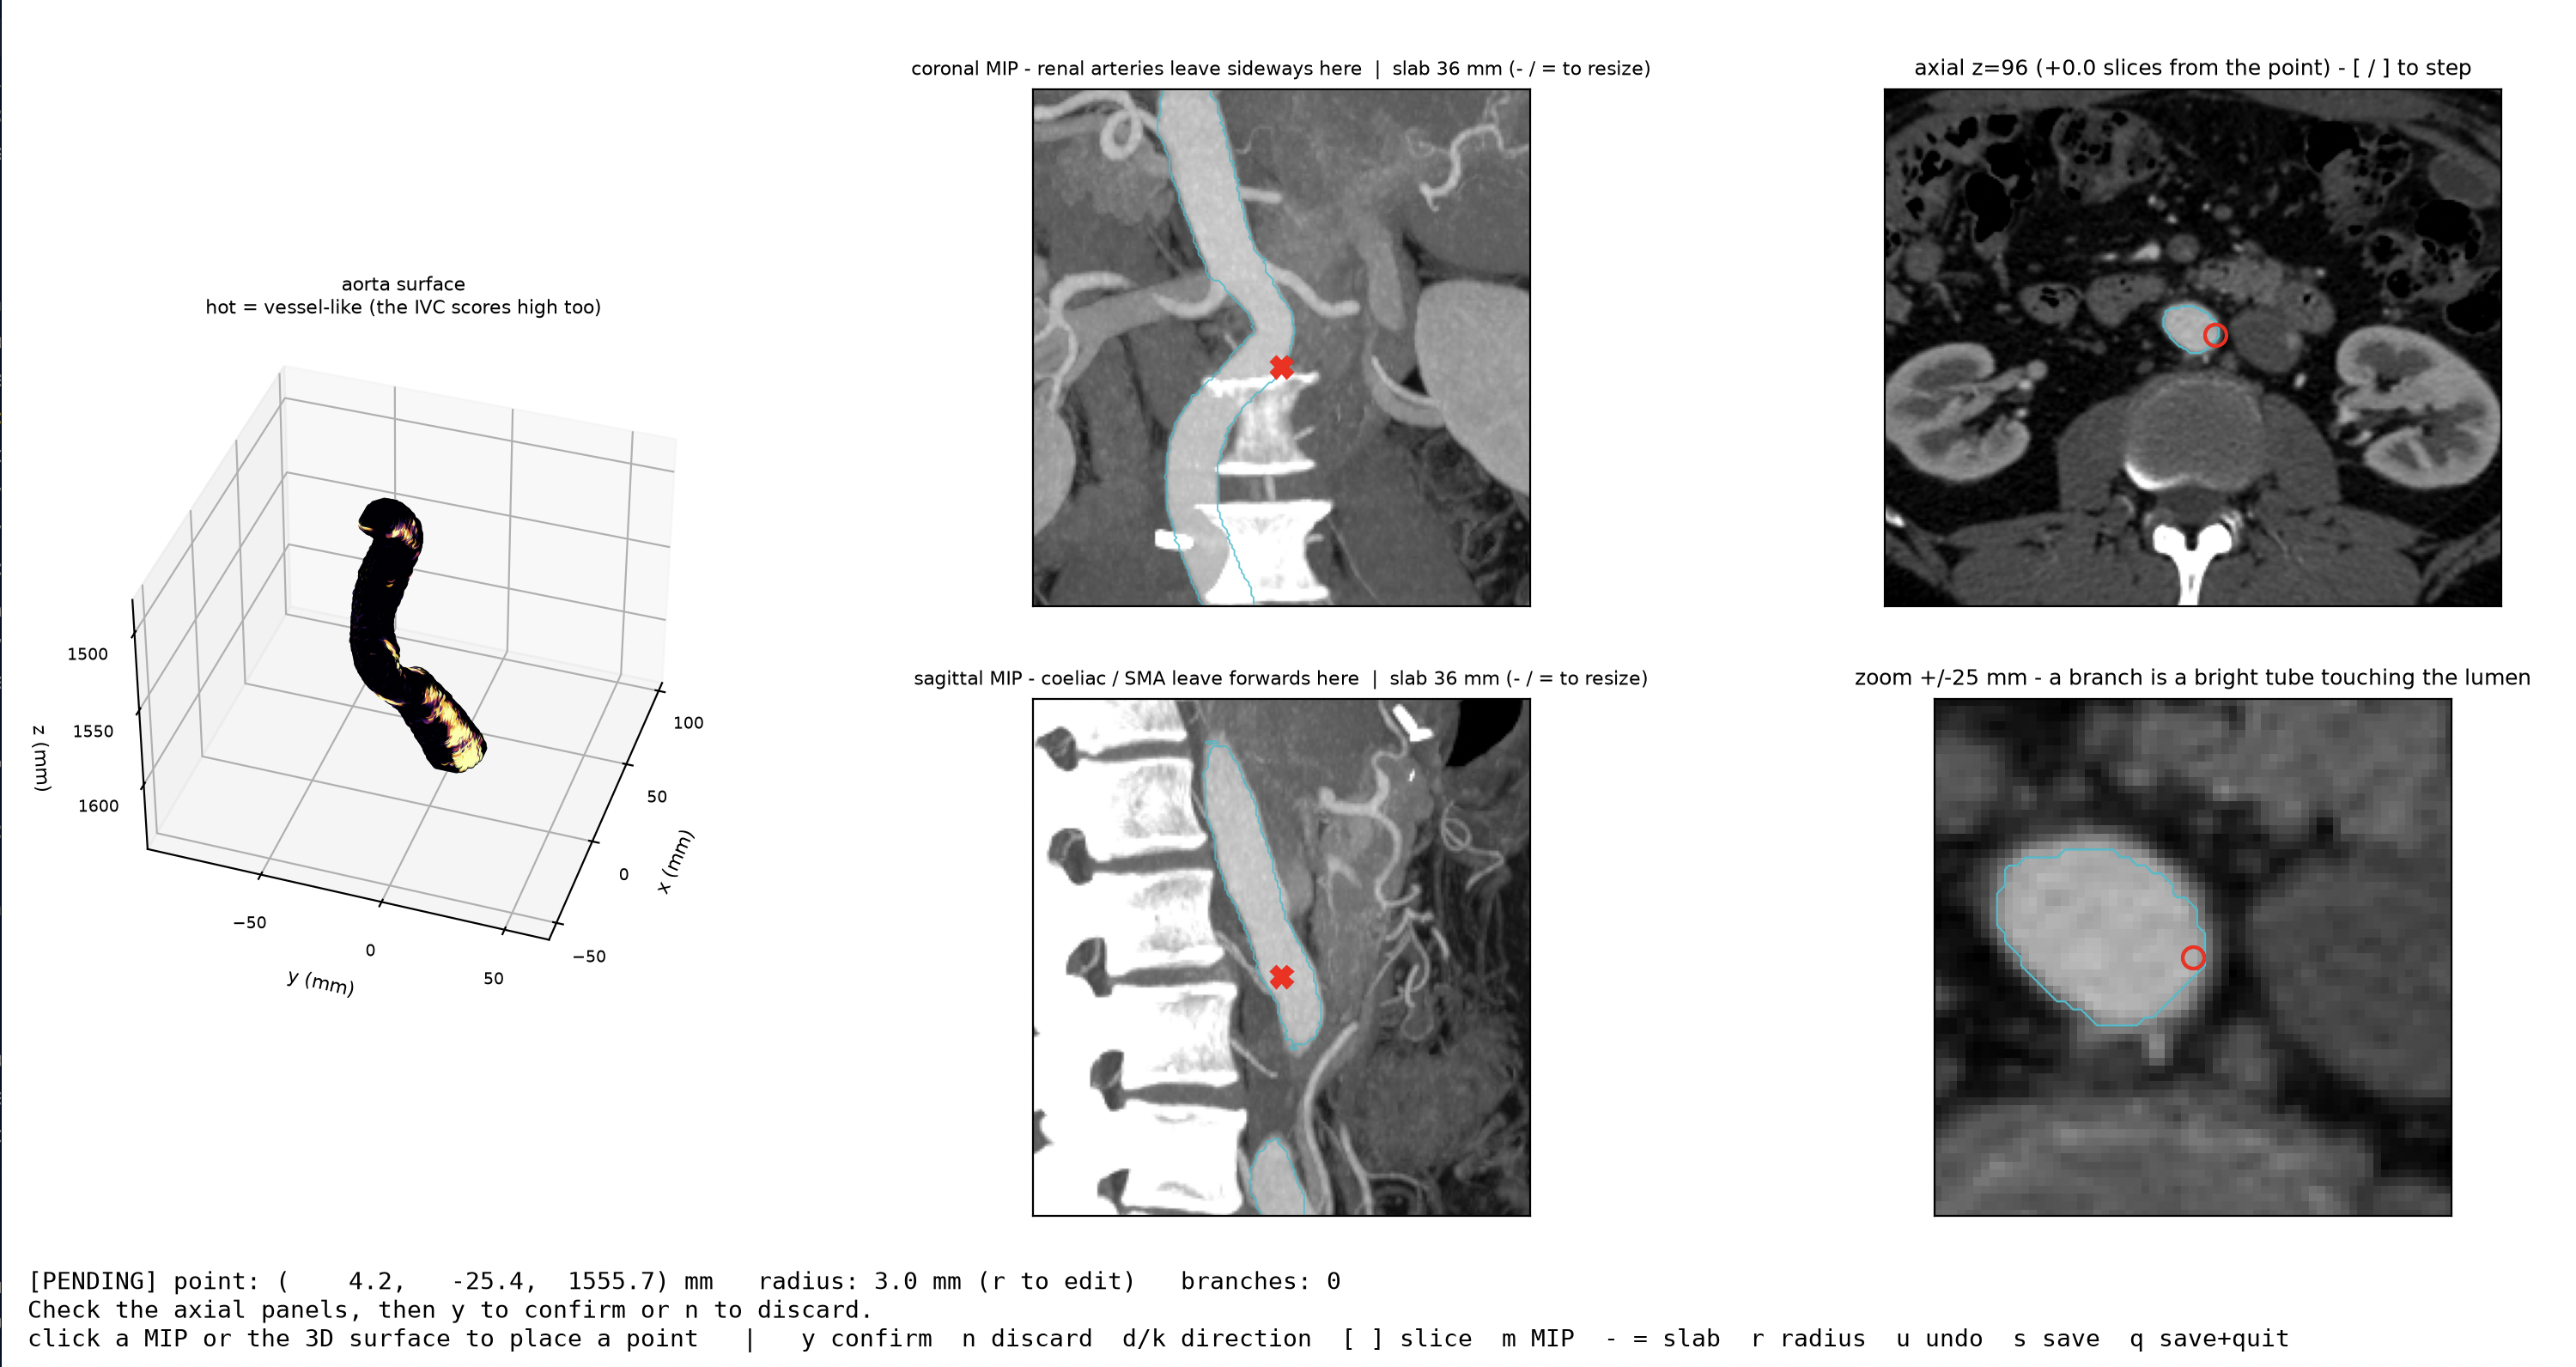
You give it a CT scan and an aorta mask, and it finds every branch artery and outputs a JSON with the ostium location, seed point, direction, and radius for each one. It averages about 2.5 seconds per case, and we ran all 20 development cases without changing anything between them. There's also a 3D viewer that meshes the aorta directly from the patient's mask and shows the detected branches with direction arrows, along with cross-section images that overlay the fitted radius on the raw CT for quality checking.
How we built it
The pipeline floods outward from the aorta, basically asking where contrast-enhanced blood goes when it leaves the mask, with a capped distance so it doesn't blow through thin walls. Connected components get filtered by length, anything near the crop boundaries gets thrown out, and components containing multiple branches get watershed-split. Each surviving instance gets traced outward from the aorta wall, where we fit the ostium from the contact patch, place a seed 5mm out, and measure the radius. A rule-based scorer decides what to keep and what to toss, and for every detection you can see exactly why it was accepted or rejected.
Challenges we ran into
- Only 5 labeled cases. Every threshold had to be validated by eyeballing cross-sections and 3D plots rather than tuning against a large dataset.
- nibabel vs SimpleITK. These two libraries disagree on coordinate signs, and we used nibabel early on, which silently mirrored the anatomy. All our tests passed but left and right were swapped in the output, and it was hard to catch because the numbers still look reasonable when everything is flipped.
- Flood fill leaking through thin walls. If the threshold is too aggressive, the flood punches through thin spots in the aorta wall and produces hundreds of junk components. We had to add distance budgets and fraction gating to keep it under control.
- Crop boundaries registering as branches. The flat top and bottom of the mask are just where the scan ended, but geometrically they resemble a vessel leaving the aorta, so we built a dedicated end-cap detector to handle those.
Accomplishments that we're proud of
The pipeline runs at 2.5 seconds per case, which is 25x under the time limit, and it didn't crash on any of the 20 development cases. Every detection carries a plain-English reason for why it was kept or dropped, and the QC images overlay the fitted radius directly on the CT data so you can visually confirm whether a detection is actually sitting on a vessel.
What we learned
Only having 5 labeled cases forced us to actually understand what a branch looks like geometrically instead of just throwing data at the problem. Distance transforms give you radius for free, surface normals tell you where the wall is, and a well-tuned flood fill gets you further than you'd expect. The other big lesson was about coordinate systems, since different medical imaging libraries handle physical coordinates differently, and it's the kind of bug where everything looks plausible until you overlay it on the actual anatomy.
What's next for Tung tung saharteries
- More labeled data. With more ground truth we could properly benchmark precision, recall, and F1 using the Hungarian-matching scorer we already built, and tune the confidence cutoff with real numbers instead of eyeballing.
- Branch labeling. Right now detections are just branch_001, branch_002, etc. We want to automatically identify which is the celiac trunk, SMA, renals, and so on based on position along the aorta.


Log in or sign up for Devpost to join the conversation.