-
-
Home
-
History
-
Menu Recommendation
-
Admin
Inspiration
Stunting is still one of Indonesia's biggest child-health problems: roughly one in five children under five is affected. Many families in villages and low-income areas only get their child measured at monthly posyandu visits, so slow growth is often noticed too late. Even when it is noticed, parents are told to "eat more nutritious food" without knowing what that means on a tight budget. I'm from Indonesia, and I wanted to build something simple that a parent can use on a basic phone.
What it does
TumbuhKu ("My Child Grows") lets parents measure and track their own child's growth.
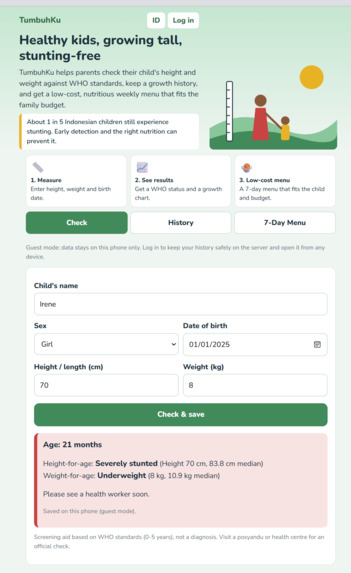
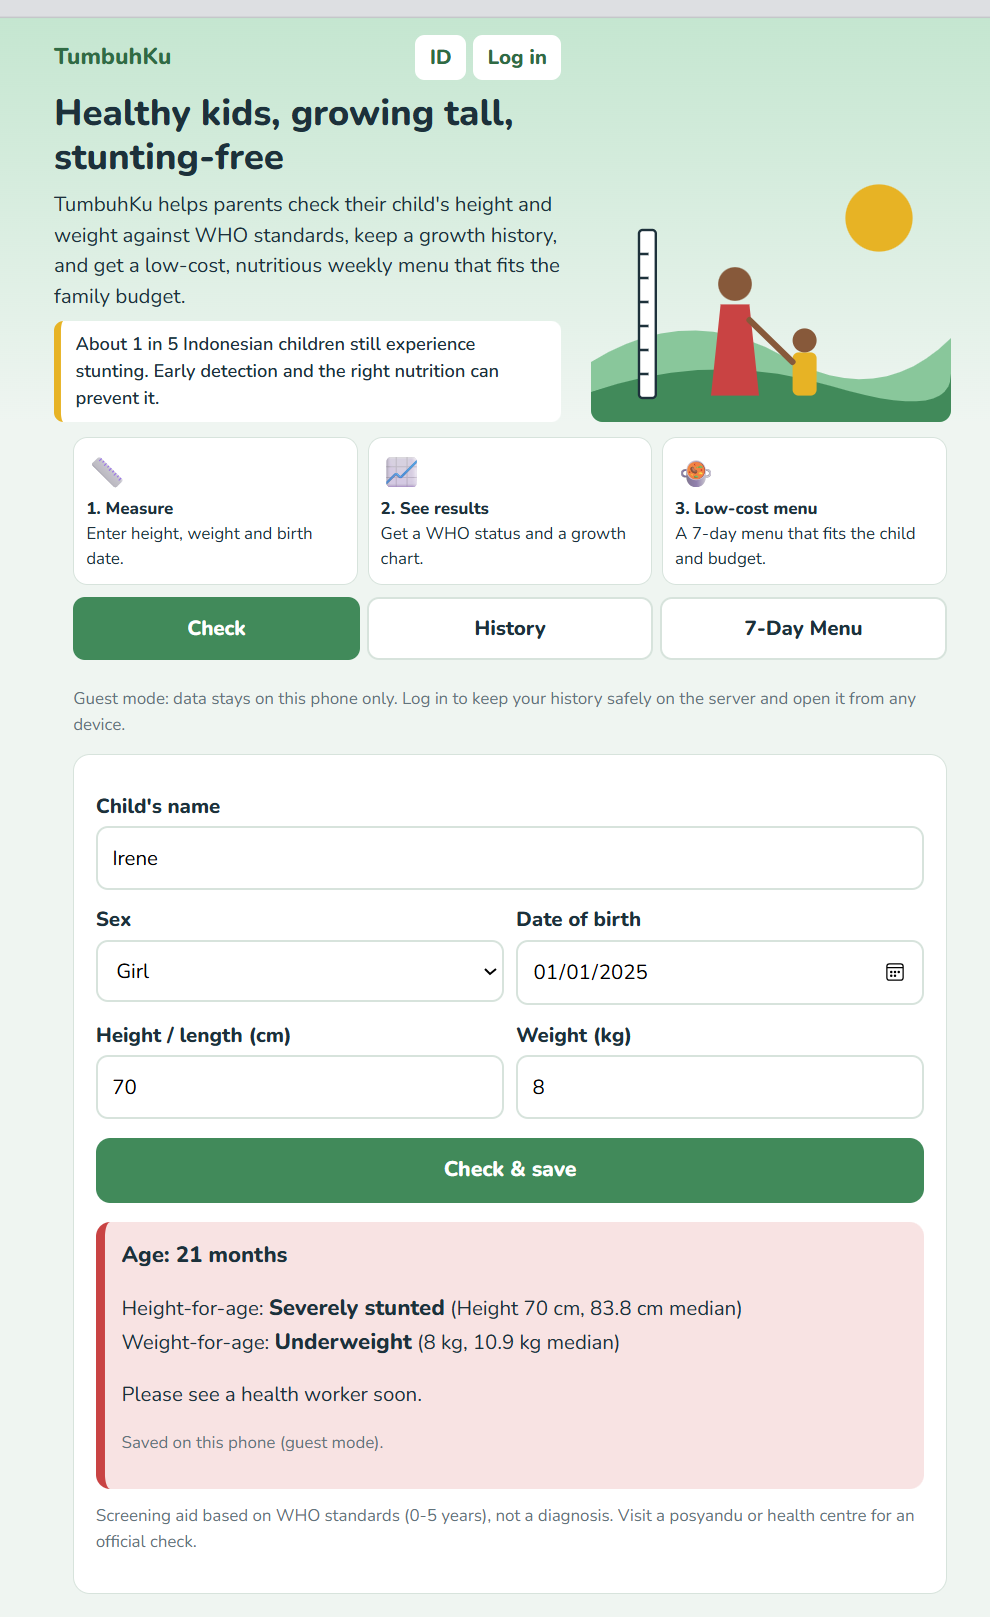
- Growth checker: The parent enters date of birth, height and weight. The app compares them with WHO child growth standards (ages 0-5) and shows a clear result for height-for-age and weight-for-age: normal, stunted, underweight or overweight.
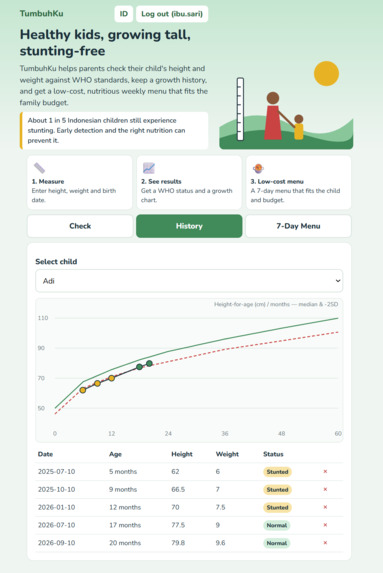
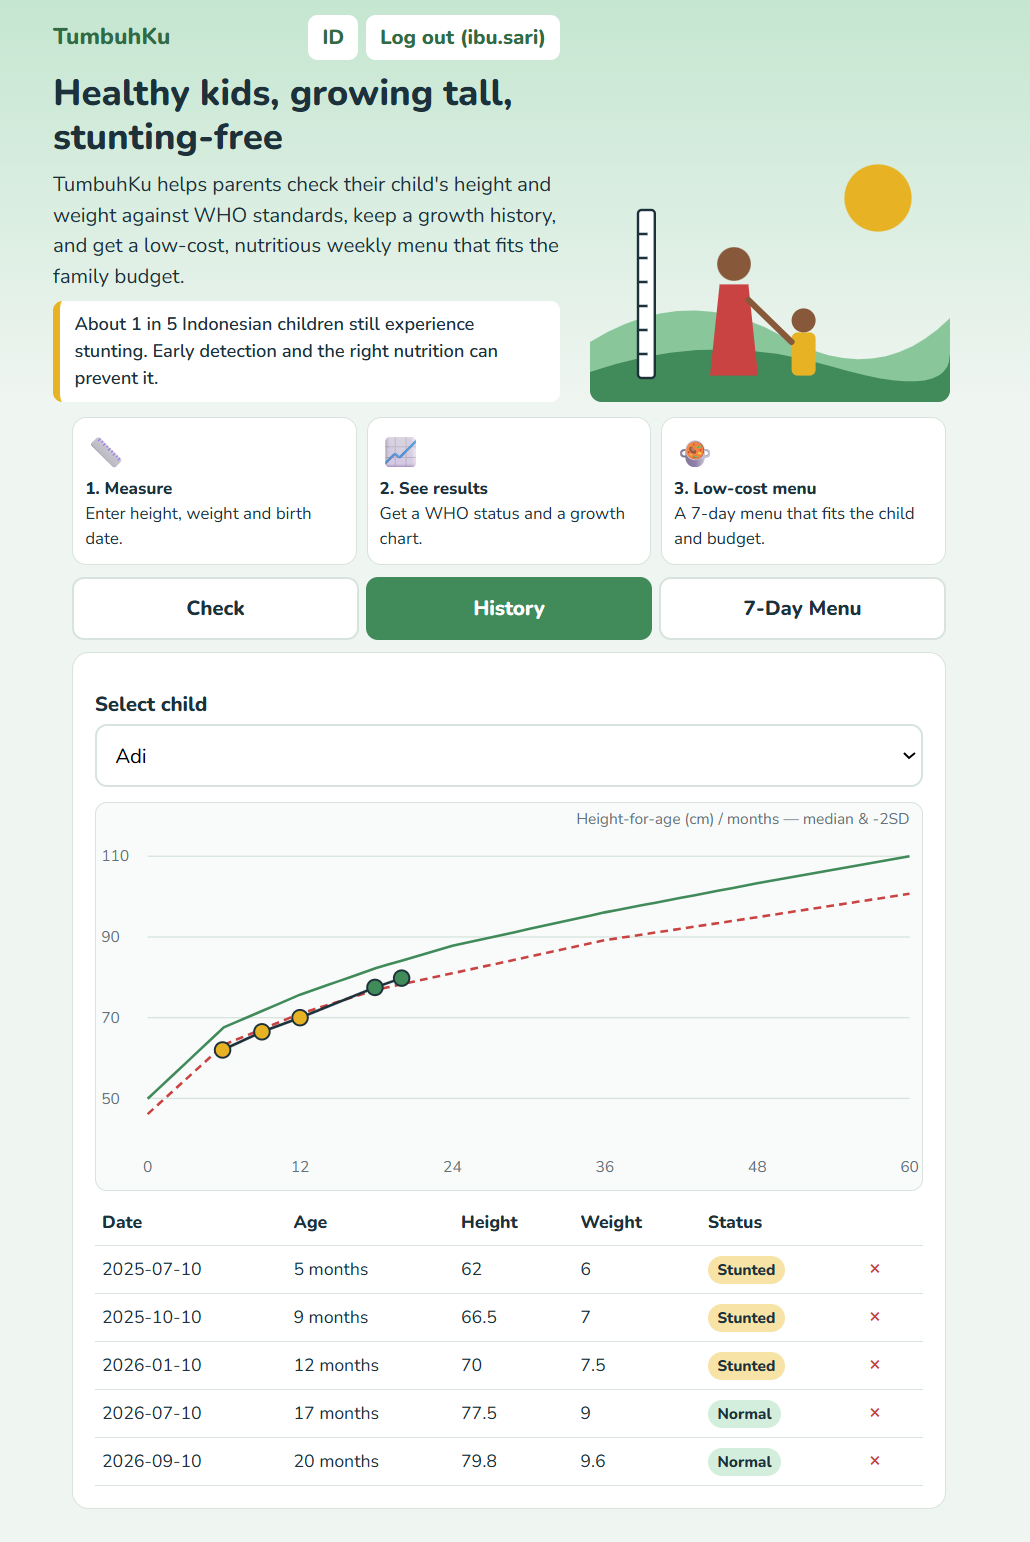
- Growth history: Every check is saved to the parent's account, with a table and a growth chart against the WHO median and -2SD lines, so parents can see the trend over time.
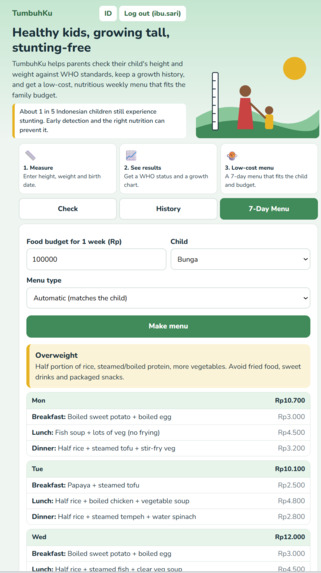
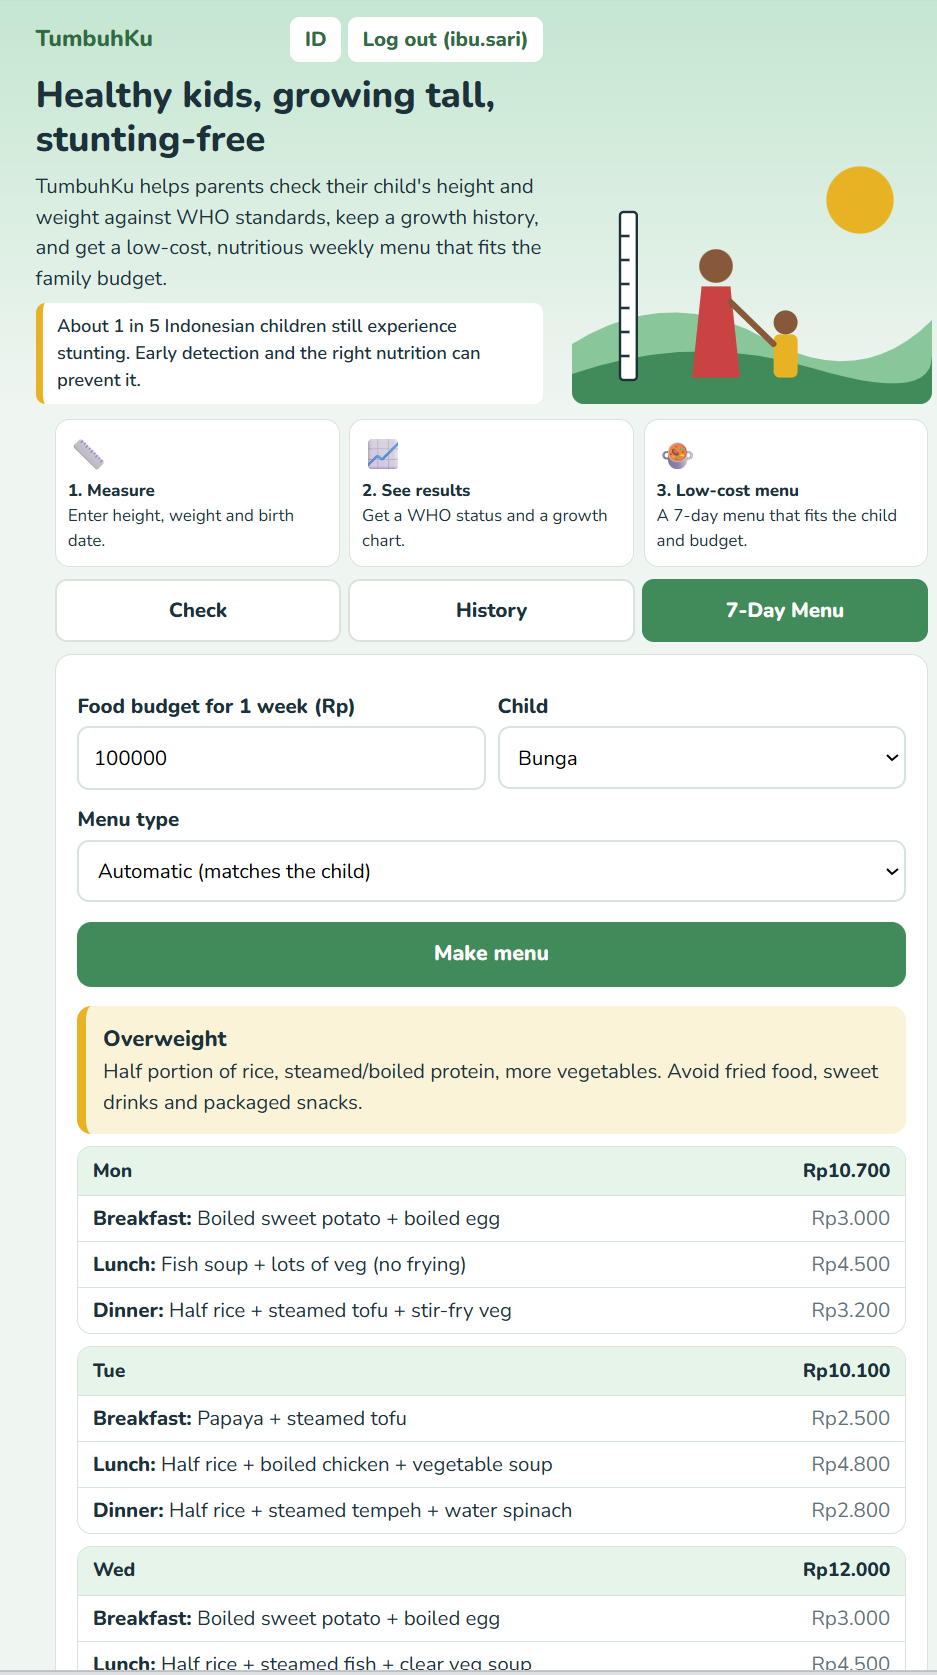
- Budget-based menu planner: The parent types their weekly food budget and gets a 7-day menu with 3 meals a day, built from cheap local foods like tempe, tofu, eggs, anchovies, catfish and chicken liver. There are three menu types: stunting/undernourished (animal protein at every meal), normal, and overweight (half rice portions, steamed food, more vegetables). The type is chosen automatically from the child's latest check, and the app shows the estimated cost and money left.
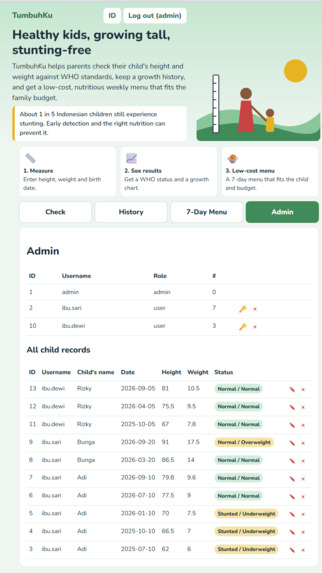
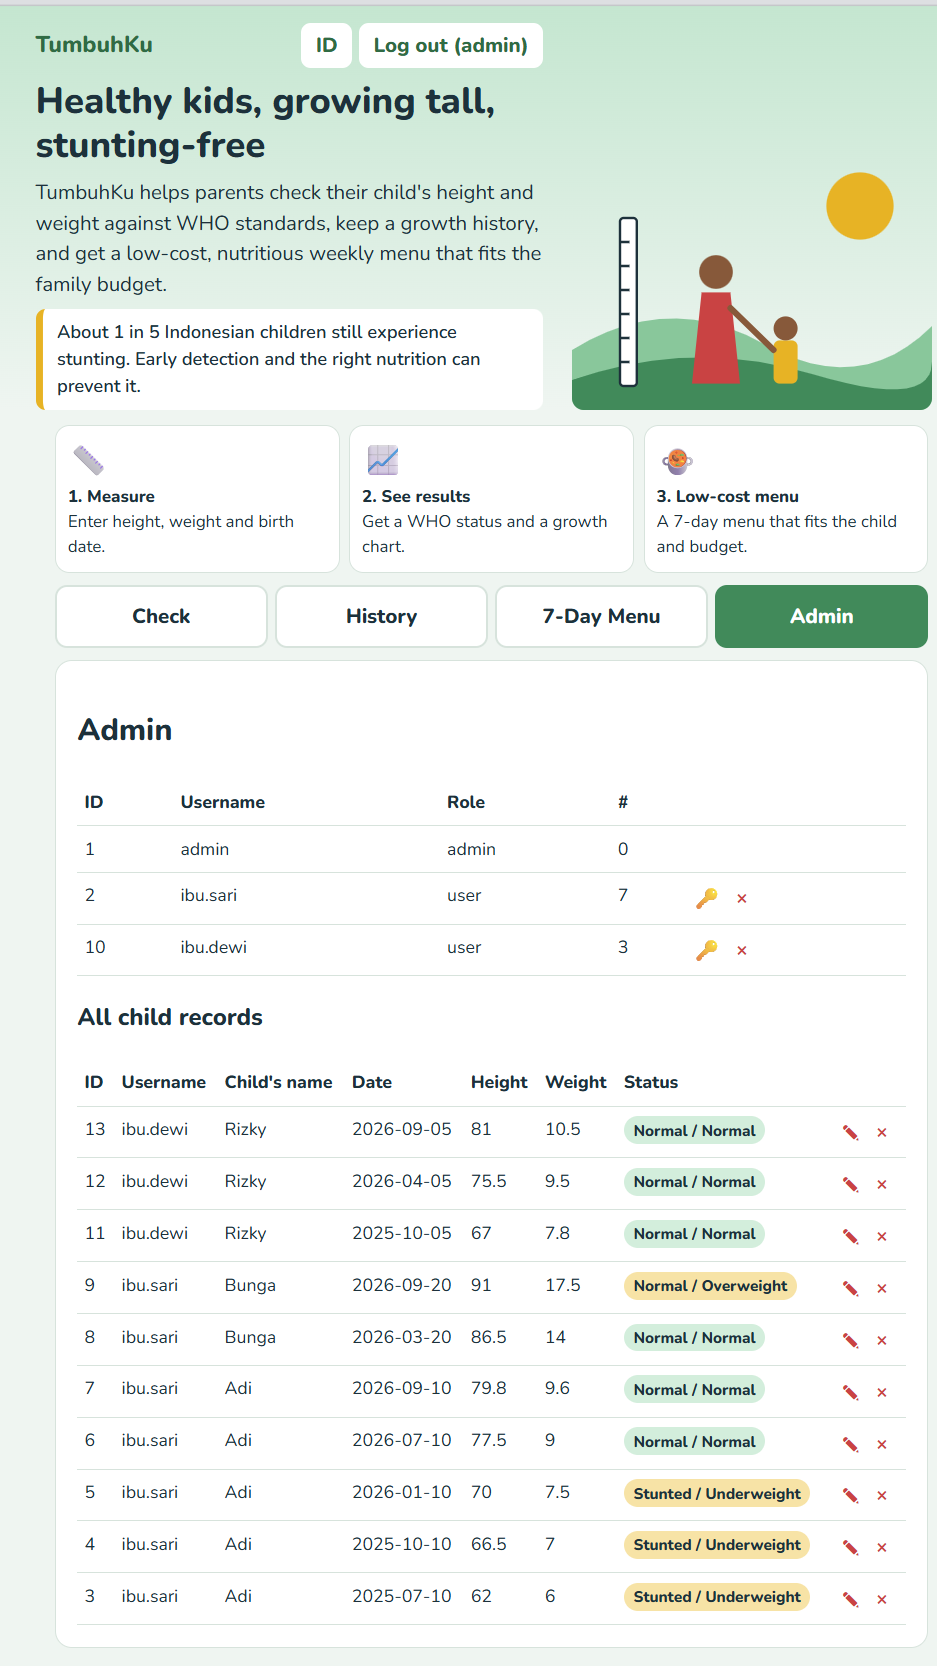
- Accounts and admin: Parents register and log in to keep history safely and open it from any phone. An admin login lets a health worker or organiser view and correct records.
- Bilingual: The interface works in Bahasa Indonesia and English.
How I built it
A single-page web app (HTML, CSS and JavaScript) with a small Node.js server that uses no external packages. Data is stored in a JSON-file database, with scripts to create, seed and display it. Passwords are hashed with scrypt, sessions use random tokens, and the server validates every record. The growth chart is drawn in SVG. Growth status uses WHO reference values (median, -2SD, -3SD, +2SD) at key ages, with values in between interpolated.
Challenges I ran into
- Installing a native database module failed on my computer, so I rebuilt the backend with only built-in Node modules, which also makes the project easy for anyone to run.
- A browser quirk (an input named "name" clashes with
window.name) silently broke the save button, and I had to track it down. - Designing a menu that is nutritious, cheap and different every day within a small budget.
What I learned
Good health tools for underserved families must be simple, in the local language, and practical, with advice that fits their budget.
What's next
- Use the full WHO monthly tables for more precise classification.
- Add a health-worker view to follow many families.
- Add more regional languages and region-specific food prices.
- Move to a cloud database and add reminders for monthly measurements.
Disclaimer: TumbuhKu is a screening aid, not a medical diagnosis. Parents should visit a posyandu or puskesmas for an official check.
Built With
- css3
- html5
- javascript
- json
- node.js
- rest-api
- svg
- who-child-growth-standards

Log in or sign up for Devpost to join the conversation.