Inspiration
The inspiration for our project was the shock all our members have had learning about the cost of higher education in the United States. Two members are distressed and shocked knowing they must pay their own tuition while many of their peer's education is subsidized by their parents. The other two members as foreign exchange students shocked and disturbed by the sticker price as neither of their tuitions break $10,000 a year. From this, our goal was to create a novel way to highlight the cost of higher education across the United States and its unequal access.
What it does
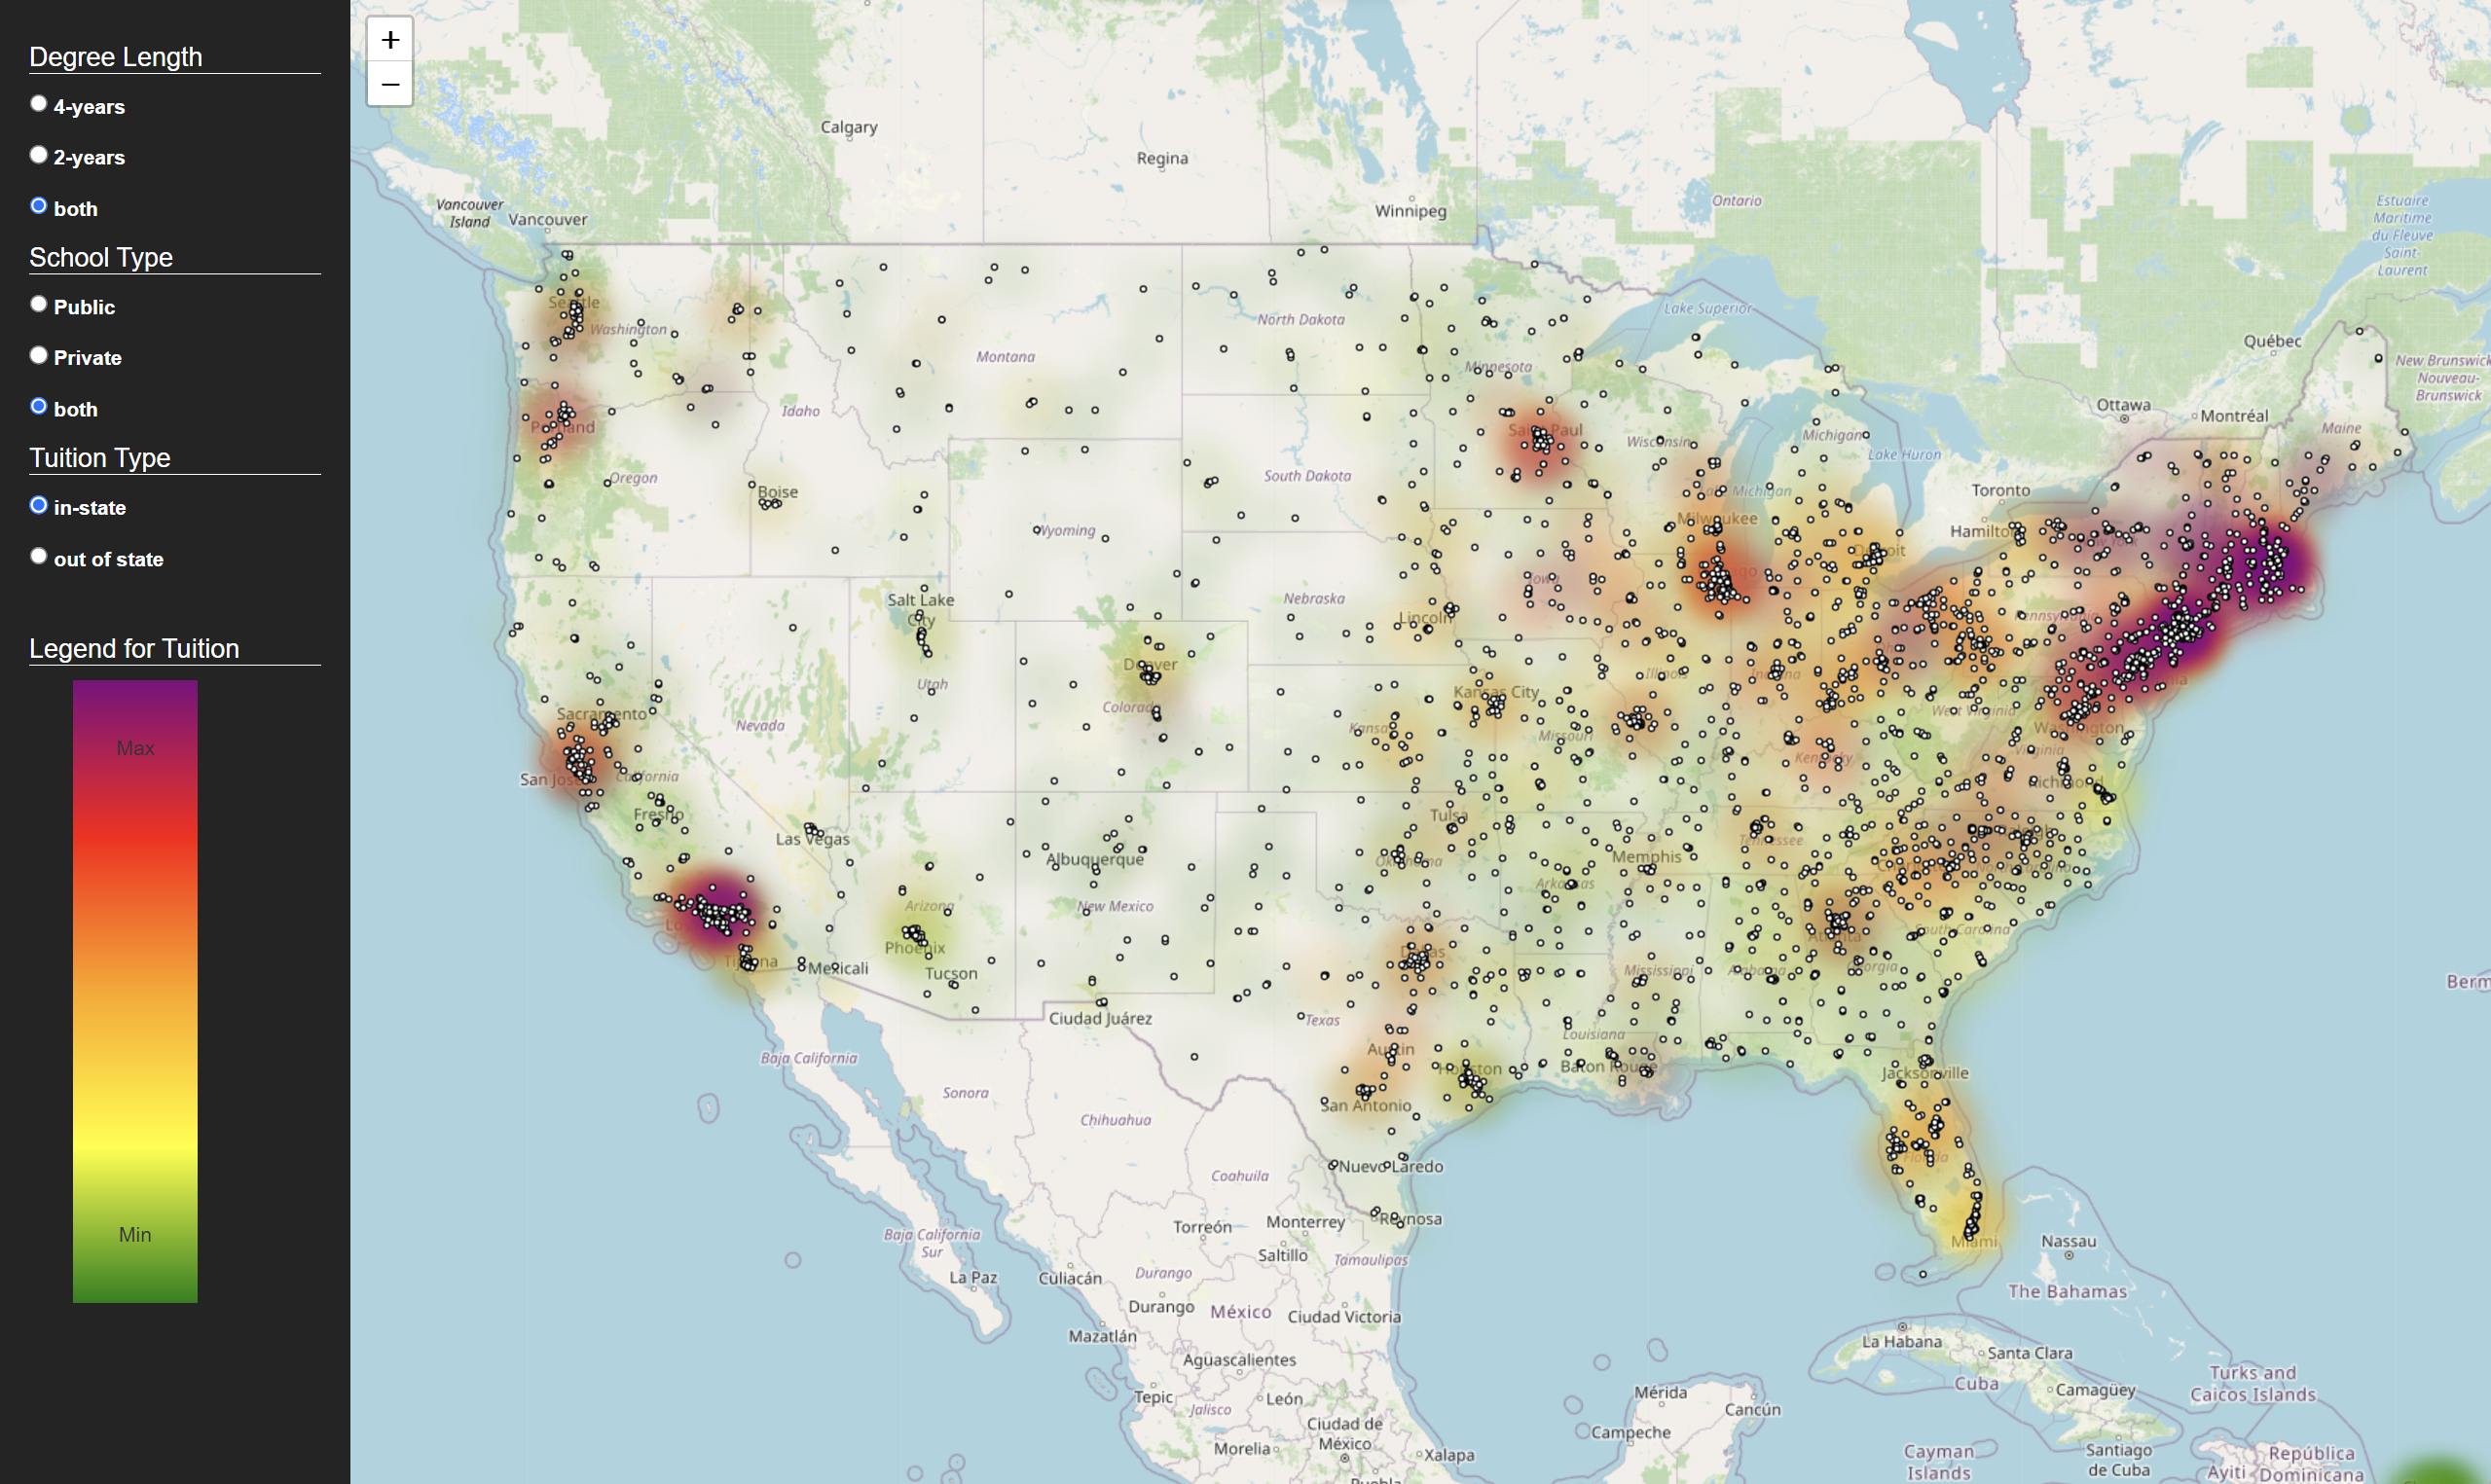
Our hack, Tuition Shock, is a web service to view a heatmap for the tuition of community colleges and universities in the United States.
Our goal was to show the disparity between a 2-year education and a 4-year education while also highlighting the privilege of access to higher education in more expensive cities and states. We also added the following filtering options to our heatmap to help highlight differences:
Degree length
- 4-year
- 2-year
- Both
School type
- Private
- Public
- Both
Tuition type
- In-state
- Out-of-state
Disclaimer
The dataset we used was provided by the U.S. government college scorecard online tool (linked below). As is the nature of a heatmap, schools without a definite address or failure to report their cost of attendance to the U.S. government are NOT included on the map.
If the Tuition Shock is not working for you make sure at the beginning of the link you are using http:// NOT https://
link: collegescorecard.ed.gov
How we built it
We used Python to implement our server side code to fetch college data from our databse, then pass the data to the frontend side to visualize on the US map. MongoDB Atlas was used to manage over 3.5k of the college data with each entry containing 9 associated values. Python library Folium was used to generate the heatmap as a HTML, which we used as a backbone code to attach additional JavaScript code to implement additional features. With sidebar, now users can choose degree length, school type, and tuition type to see the desired data on the heatmap.
To deploy our service, we used GoDaddy to reserve the tuitionshock.us URL. Next, to make the non-static website with provided URL, we made a masked URL redirect to render.com and render our interactive python heatmap so that anyone can access our service with any device.
Challenges we ran into
Our first major challenge was figuring out how to use Open Data Maker HTTP API for getting data from the U.S.D.E College Scorecard database. The documentation in College Scorecard API Guide is not very clear, so we had to spend a few hours to get the results we wanted so we could grab the data for our database. Luckily, Dallas was a wizard with HTTP API URL generation and made all the breakthroughs there. Entering data in the database was also expedient with Eunice's expertise in MongoDB.
The next challenge we faced was filtering useful data. With over 6,000 higher education institutions in our database, we had to remove entries that lacked their tuition costs and add location data to colleges missing it. This was fixed with Eunice's MongoDB experience and Keith's Python scripting skills.
Afterward, we ran into bugs generating the heatmap and connecting it to an HTML website. Airi made quick work of this with her previous experience with Flask in conjunction with HTML. She also then went on to solve how we could load the rendered heatmap using the URL.
Accomplishments that we're proud of
We are very proud of our teamwork and optimism towards a challenge. Throughout the hackathon, we all had a task at any given moment and would help each other at any chance we got. We made time to take breaks together, discuss our progress, next goals, and celebrate small victories. One major accomplishment we all smiled with glee and felt awe at was our working buttons. Seeing the heatmap change so dramatically when showing only private vs state institutions was very fascinating as you see private institutions almost disappear as you look further into the center of the United States.
What we learned
We learned about the difficulties of building a web app that is accessible to the populace. We found out how to make a public webpage running on PorkBun with GoDaddy. Also struggled getting more than just our sidebar buttons actually on the website and the actual rendered heatmap. All of us have had experience in HTML, python, and databases in the past, but not with all of these components interconnected to such a degree. In general, We gained an immense amount of experience in building a web app as a team playing to our advantage together.
What's Next for Tuition Shock
Next, we would like to add more data to our database as many colleges had to be removed simply due to a lack of time to find another method of collecting tuition costs. We would also like to improve the filtering options like showing colleges in a certain state or letting users set limits for a college's cost to be shown on the heatmap.


Log in or sign up for Devpost to join the conversation.