-
-
Dashboard
-
Dashboard
-
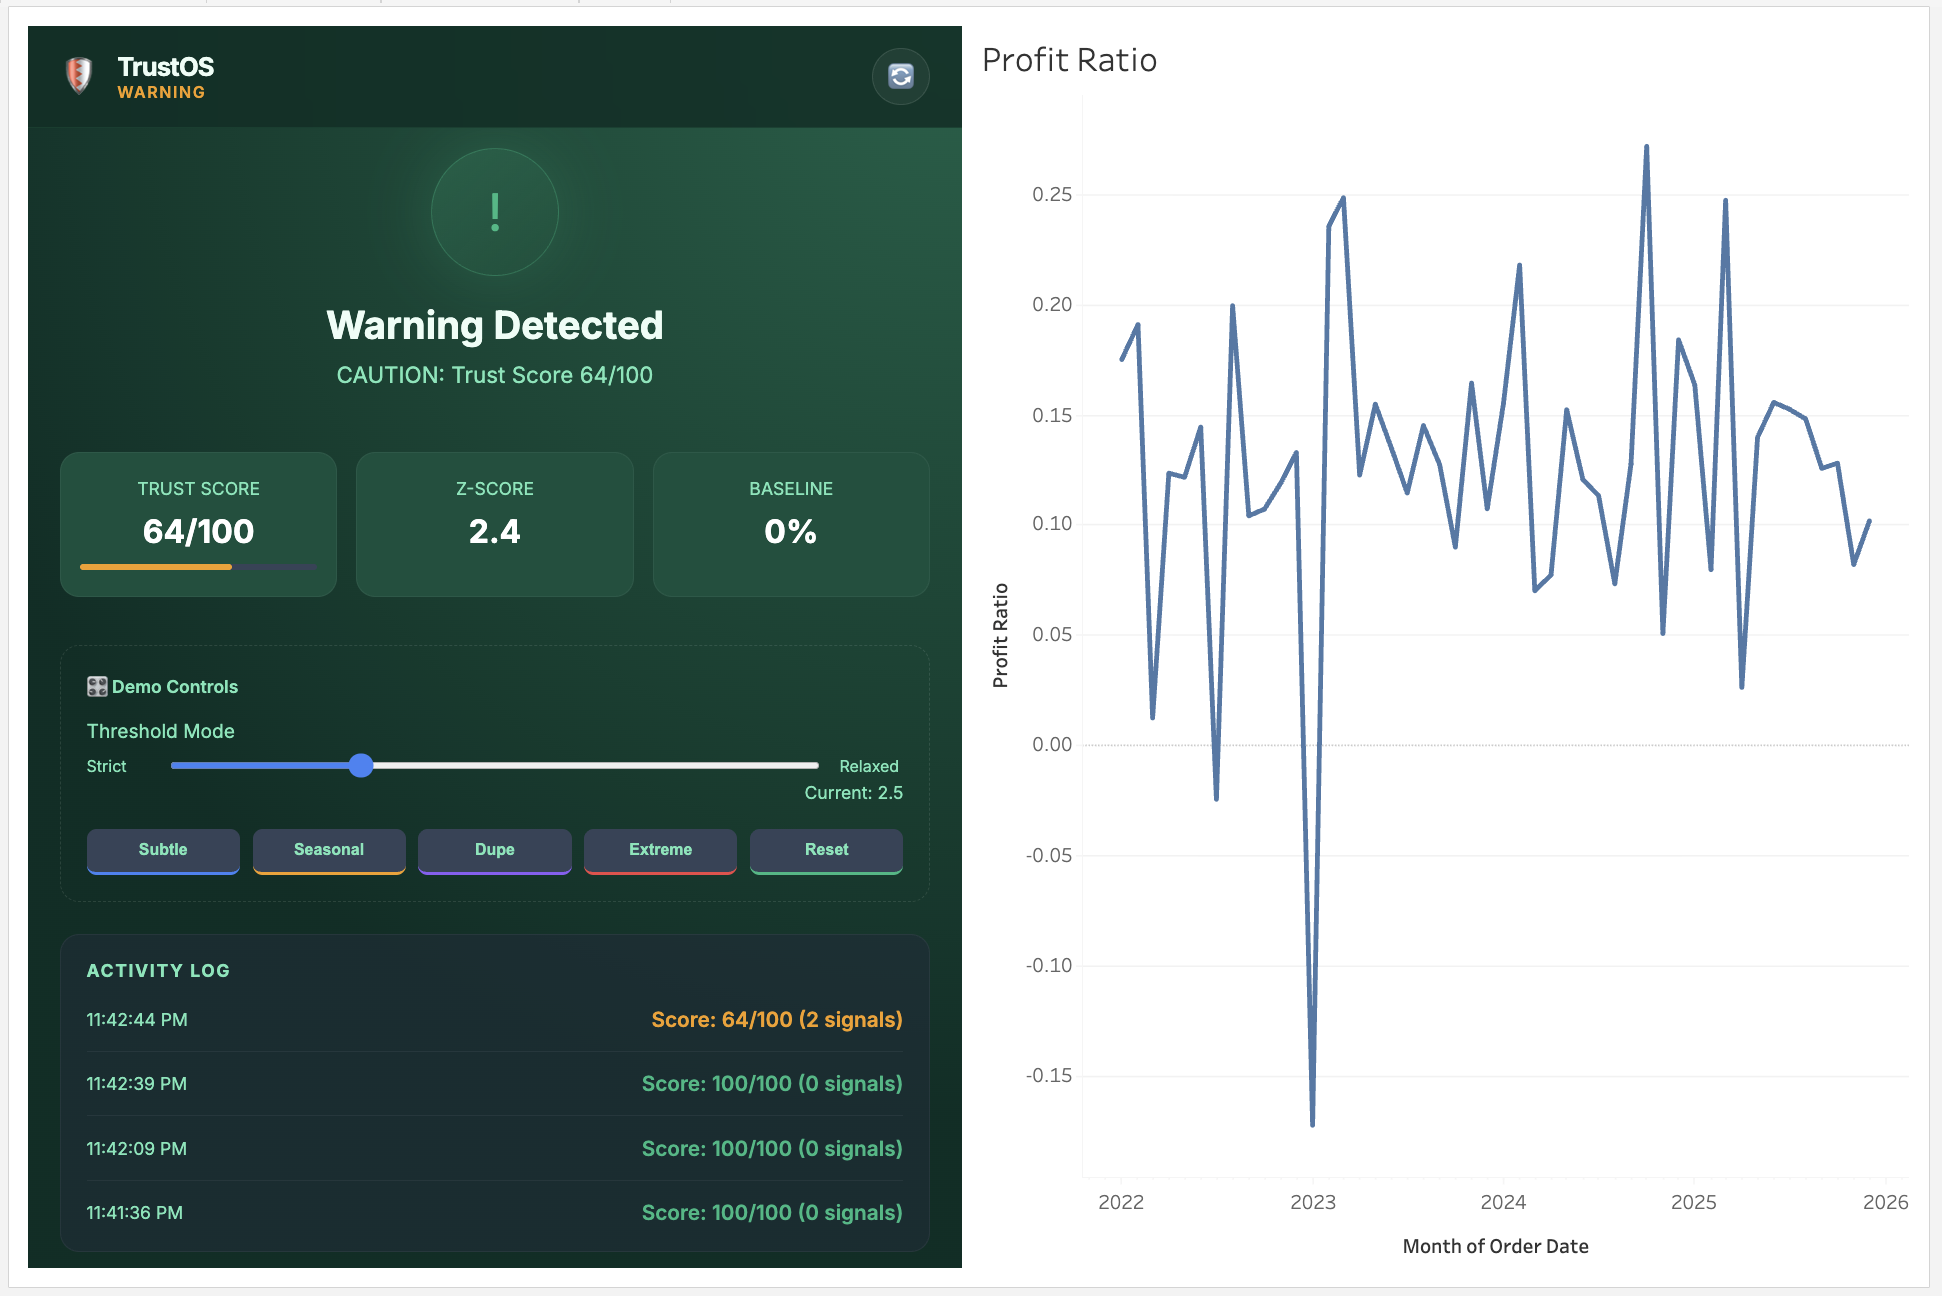
Dashboard
-
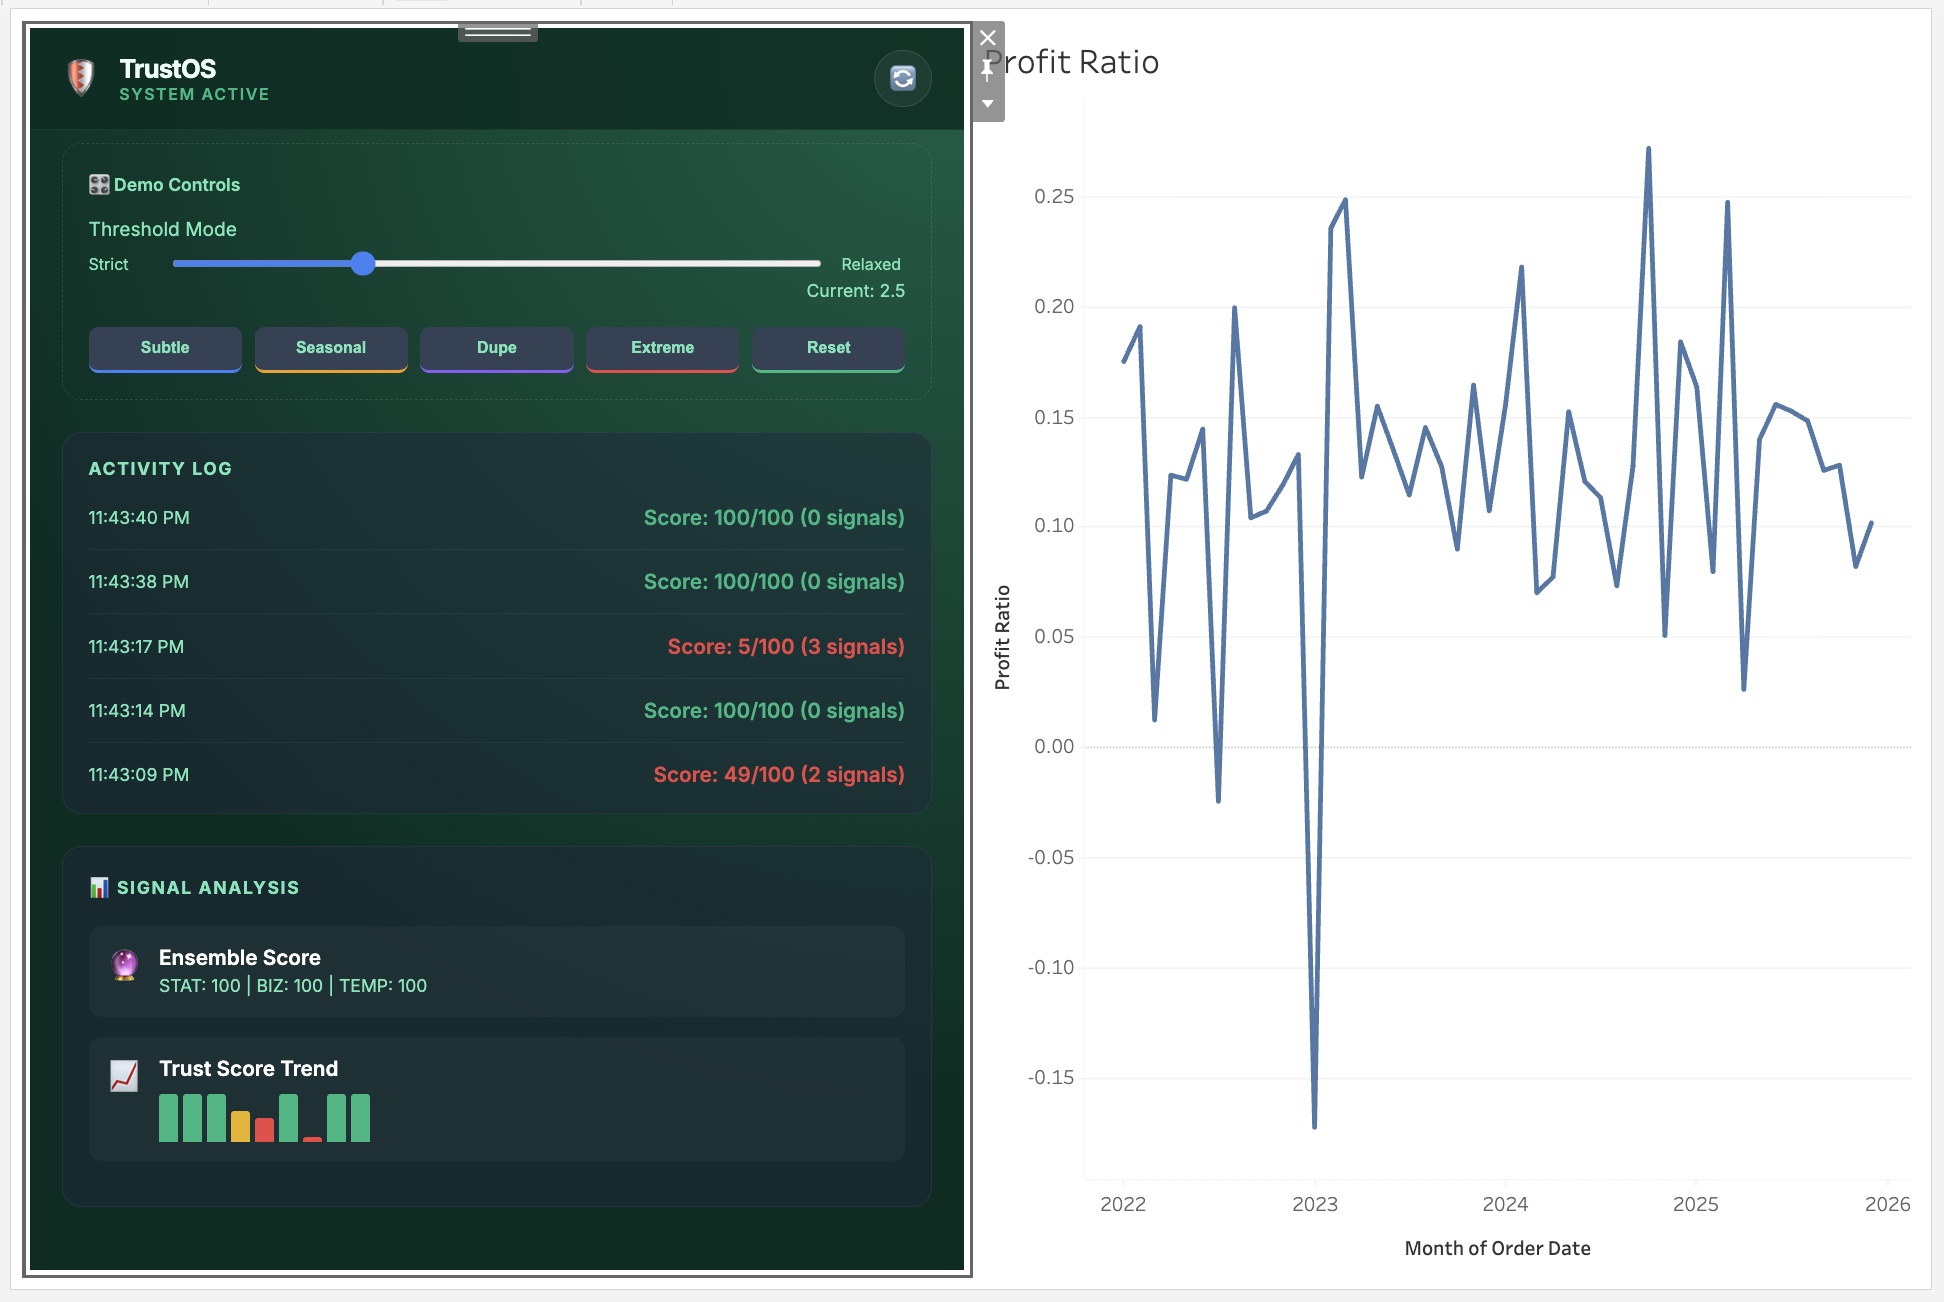
Dashboard
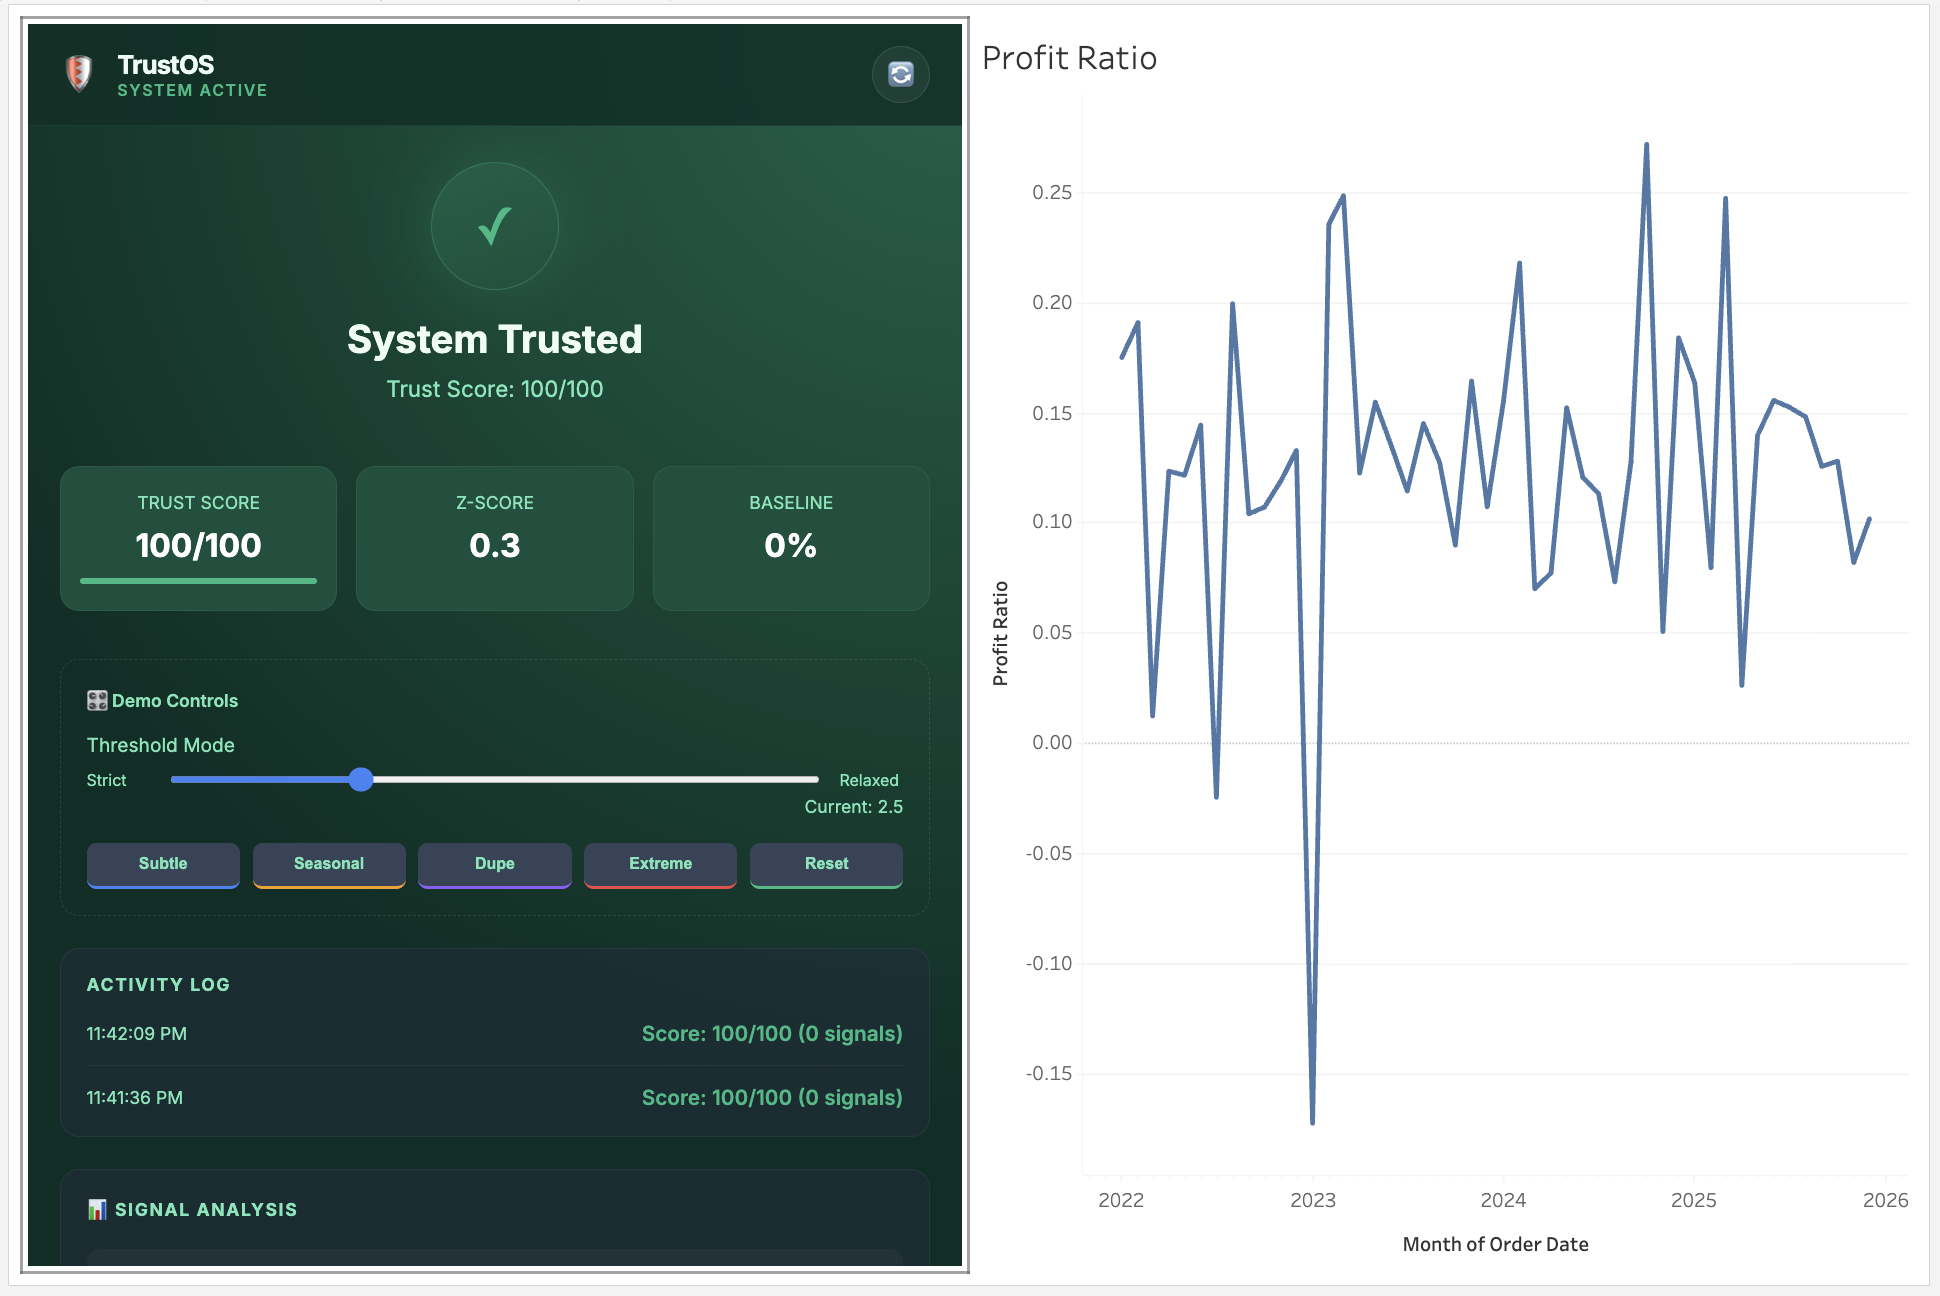
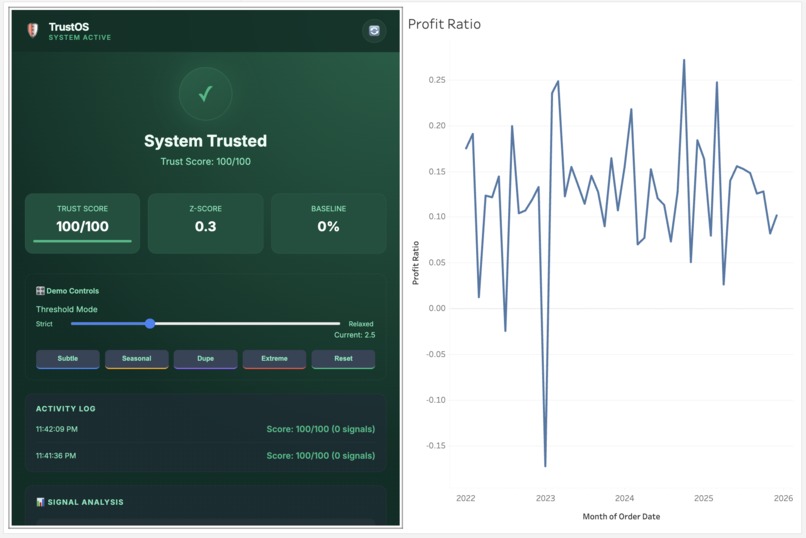
TrustOS: Building a Fail-Closed Trust Layer for Tableau
🎯 Inspiration: The Silent Failure That Started Everything
The inspiration for TrustOS came from a painfully common experience in analytics: the moment you realize your dashboard has been showing wrong numbers for hours—or days.
I've watched data teams build sophisticated pipelines with dbt, Airflow, and comprehensive testing frameworks. Everything shows green. Jobs succeed. Tests pass. Dashboards render beautifully.
And then someone notices the profit margin is 2400% instead of 24%.
The issue wasn't in the warehouse. It was a logic error in a Tableau calculated field. Or a filter that got accidentally removed. Or a JOIN that exploded when a new dimension was added. The pipeline tools caught nothing because, technically, everything executed successfully.
This is the decision gap—the space between technical success and semantic correctness. And it's where bad decisions get made.
I realized: Analytics needs circuit breakers, not just monitors.
💡 The Core Insight: Fail-Closed, Not Fail-Open
Every alert system I've seen operates on a fail-open model:
- Monte Carlo detects an anomaly → sends a Slack message → user still sees the dashboard
- dbt test fails → email notification → executive already made the decision
- Custom Python script flags an issue → JIRA ticket created → AI agent already consumed the data
Alerts inform. They don't prevent.
TrustOS introduces a different model: fail-closed enforcement. When trust breaks, the system doesn't notify you—it blocks access until the issue is resolved.
This required a fundamental shift: instead of building another monitoring tool, I needed to build enforcement infrastructure that lives inside Tableau itself.
🏗️ How I Built It
Phase 1: Understanding Tableau's Extension Capabilities
I started by diving deep into the Tableau Extensions API. Most extensions use it for basic data visualization or simple interactions. I needed something more powerful.
The breakthrough came when I discovered getSummaryDataReaderAsync()—a method that provides access to row-level data, not just aggregated charts. This meant I could:
- Detect duplicate rows from JOIN explosions
- Validate individual records, not just summary statistics
- Catch issues that statistical outliers would miss
// This became the foundation of our deepest detector
const reader = await worksheet.getSummaryDataReaderAsync();
const dataTable = await reader.getAllPagesAsync();

// Hash each row to find exact duplicates
const rowHashes = new Set();
for (const row of dataTable.data) {
    const hash = row.map(cell => cell.value).join('|');
    if (rowHashes.has(hash)) duplicateCount++;
    else rowHashes.add(hash);
}
This wasn't just checking if a number looked weird—it was inspecting the actual data Tableau was about to display.
Phase 2: Building the Detection System
I knew I couldn't rely on a single threshold. Real-world data quality issues are too diverse:
- Decimal shifts (2400% instead of 24%) need different detection than
- Currency flips (~20% deviation) which need different detection than
- Subtle drift (gradual 5% increase over time)
So I built a multi-detector consensus system with 9 specialized detectors organized into three weighted categories:
Statistical Detectors (40% weight):
- Z-Score analysis for standard deviation spikes
- High Z-Score for elevated but sub-threshold anomalies
Business Rule Detectors (35% weight):
- Domain constraints (e.g., profit margins between 5-60%)
- Negative value detection
- Decimal shift detection (100× multipliers)
Temporal Pattern Detectors (25% weight):
- Rate-of-change analysis
- Duplicate inflation patterns
- Currency conversion signatures
- Row-level duplicate detection
Each detector contributes a penalty to its category. The final trust score:
$$\text{trustScore} = 100 - \left( (P_{\text{stat}} \times 0.40) + (P_{\text{business}} \times 0.35) + (P_{\text{temporal}} \times 0.25) \right)$$
Where $P_{\text{stat}}$, $P_{\text{business}}$, and $P_{\text{temporal}}$ are the maximum penalties triggered in each category.
Why consensus matters: A single detector firing might be noise. Two or more detectors agreeing? That's a real signal.
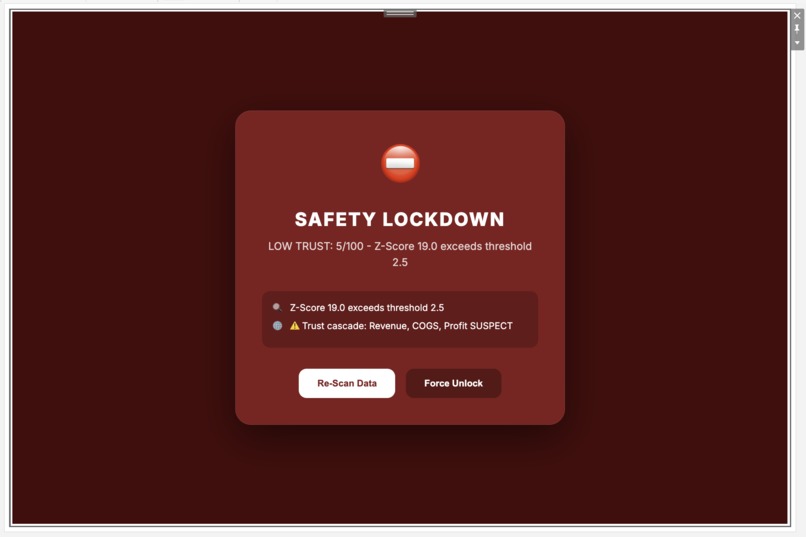
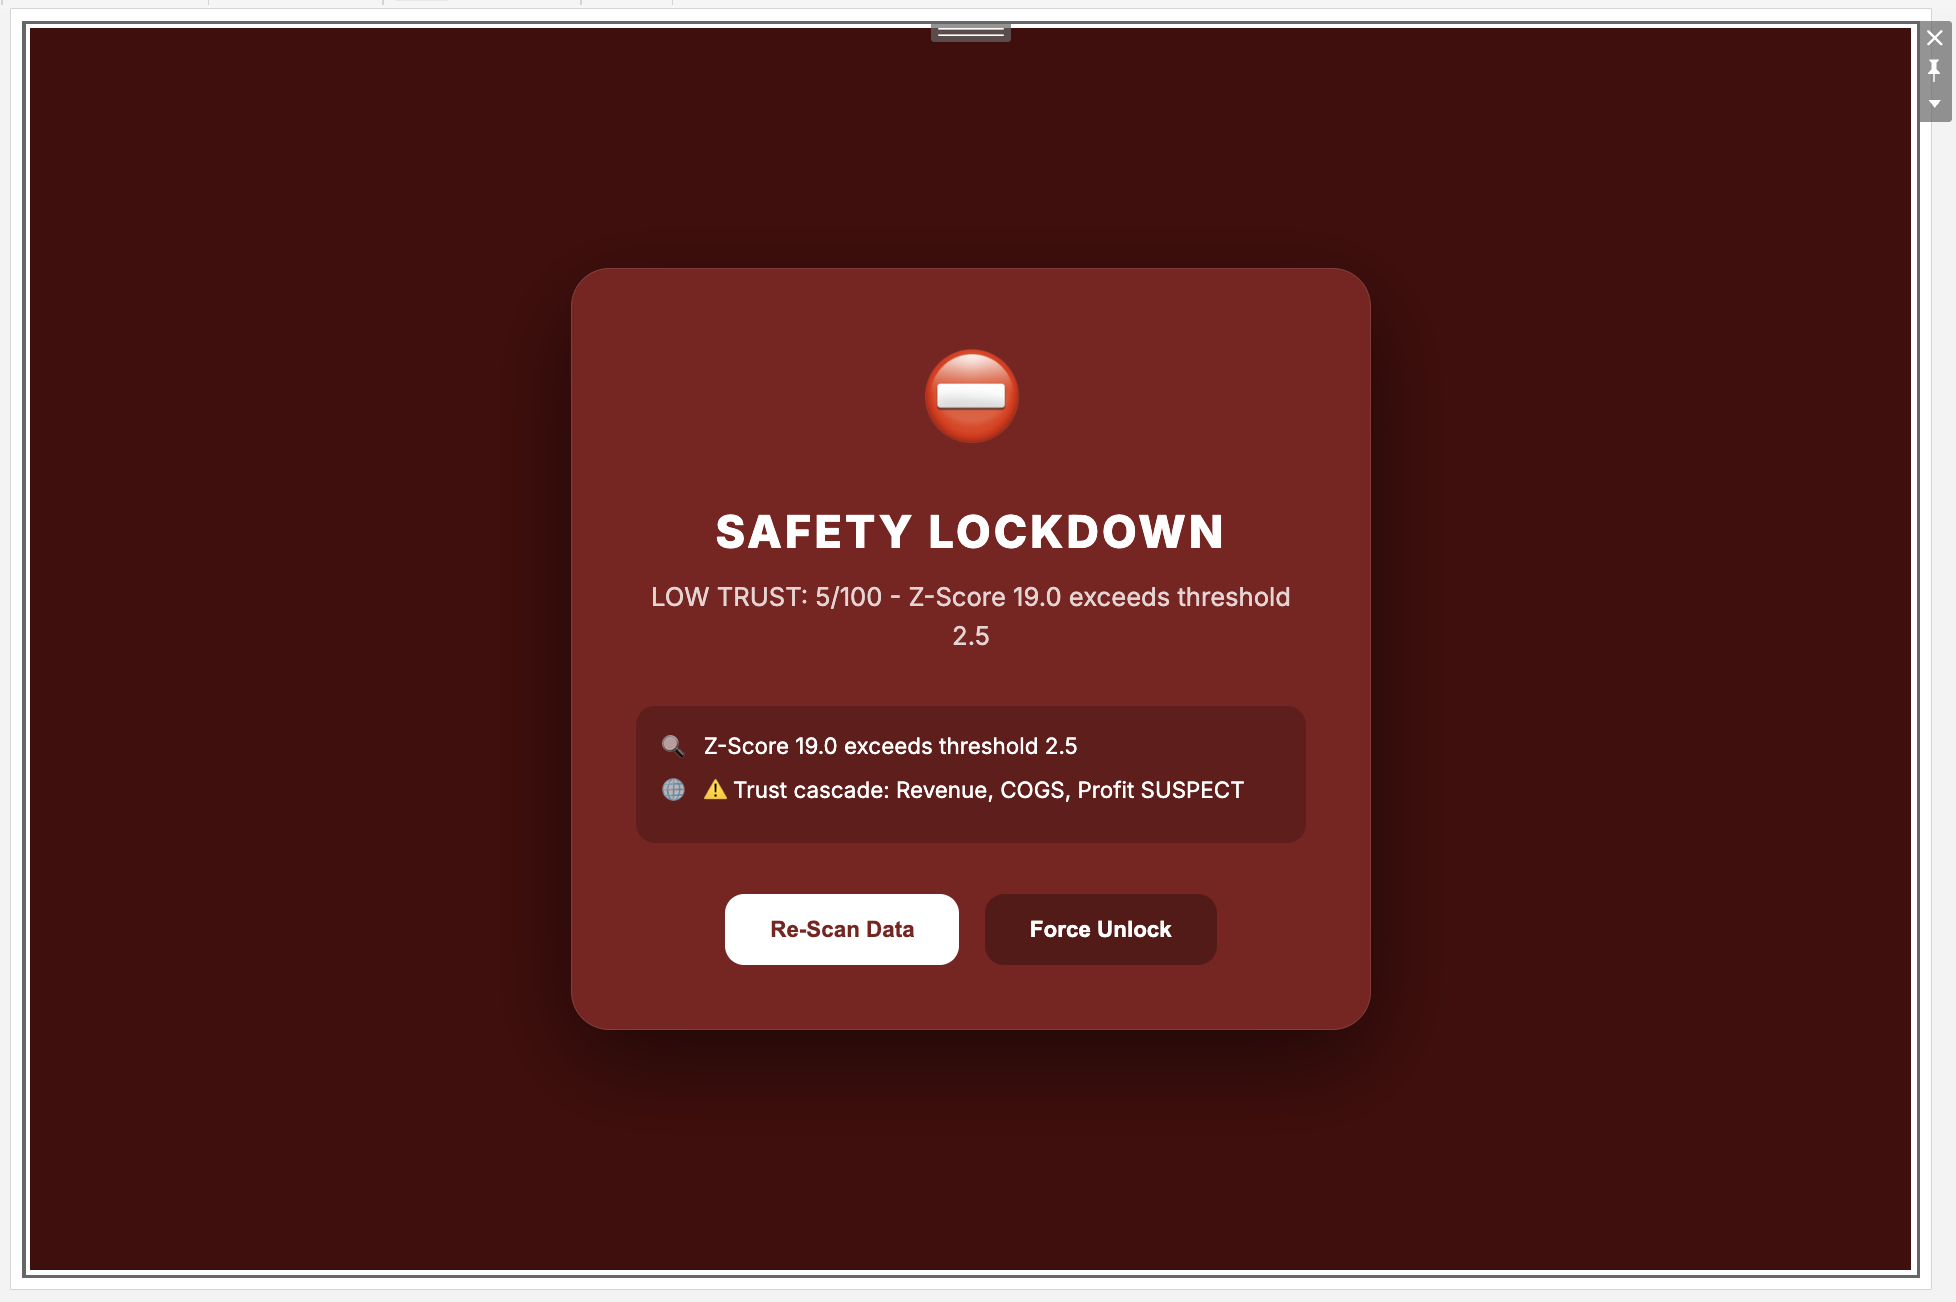
Phase 3: The Enforcement Mechanism
This was the trickiest part. How do you actually block a Tableau dashboard?
The answer: work with Tableau, not against it.
I created a boolean parameter called DecisionTrustState that the extension controls:
- When trust is high →
DecisionTrustState = TRUE - When trust breaks →
DecisionTrustState = FALSE
Then I used Tableau's Dynamic Zone Visibility—a native feature—to show/hide content based on this parameter:
Container A (Dashboard): Show when [DecisionTrustState] = TRUE
Container B (Lock Screen): Show when NOT [DecisionTrustState]
No browser hacks. No CSS overlays that can be inspected away. Native Tableau enforcement.
When TrustOS revokes trust, Tableau itself hides the dashboard. It's not TrustOS blocking access—it's Tableau enforcing the trust signal.
Phase 4: Making It Explainable
Blocking a dashboard without explanation would create chaos. I needed transparency.
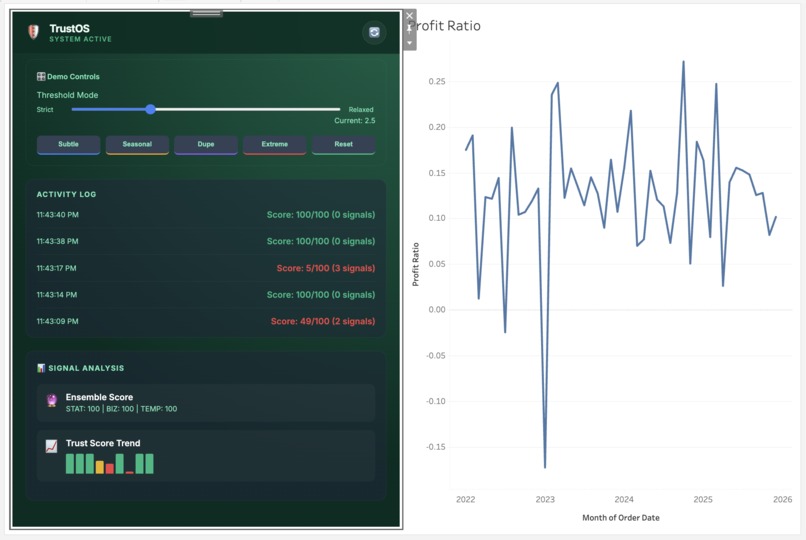
I built three layers of explainability:
- Detector Contribution Bars: Shows which specific signals triggered and their penalty values
- Trust Score Sparkline: Visual history of the last 10 evaluations to distinguish transient blips from persistent degradation
- Trust Timeline: Timestamped audit log with Z-scores and failure reasons
Users don't just see "LOCKED"—they see:
Trust Score: 15/100
Signals Detected:
- DECIMAL_SHIFT (-100 penalty): Value is 847× historical mean
- Z_SCORE (-80 penalty): 1273 standard deviations from baseline
Last 3 evaluations: LOCK → LOCK → LOCK (persistent issue)
This transforms trust from a black box into an auditable system state.
🎨 Design Philosophy: Enterprise-Grade Polish
I wanted TrustOS to look like a native Tableau feature, not a hackathon prototype.
I invested heavily in the Emerald Enterprise theme:
- Deep emerald backgrounds (
#022c22) that feel premium - Glassmorphism effects with subtle glow borders
- Vertical stack layout optimized for Tableau's narrow sidebar
- Integrated developer tools (not floating overlays)
The goal: when a judge opens this, they should think "This could ship tomorrow" not "This is a weekend project."
🧪 Validation: Testing on Real Data
I validated TrustOS on Tableau's Superstore dataset—a real-world dataset with realistic variance and seasonality.
I created 12 corruption scenarios simulating actual ETL failures:
- Decimal shifts (profit × 100)
- Currency inversions (EUR values in USD columns)
- JOIN explosions (duplicate row inflation)
- Filter regressions (wrong date ranges)
- Null handling errors (0 replacing NULL in averages)
Results:
- True Positives: 12/12 (every corruption detected)
- False Positives: 0 observed (normal variance never triggered false locks)
- Detection Latency: <50ms
The consensus system worked: subtle issues triggered warnings, severe issues triggered immediate locks, and normal data stayed green.
😰 Challenges I Faced
Challenge 1: The Persistence Problem
Early versions would lock on a single anomaly, then unlock immediately when the next poll showed normal data. This created flickering UIs and false confidence.
Solution: I implemented persistence tracking—if 2 of the last 3 evaluations show signals, the dashboard stays locked even if the current evaluation looks clean. This catches intermittent issues and race conditions during data refreshes.
// Persistence check (runs every evaluation)
const recentSignals = signalHistory.slice(-3);
const anomalyCount = recentSignals.filter(count => count > 0).length;

if (anomalyCount >= 2) {
    status = 'LOCKED';  // Persistent issue detected
    trustScore -= 15;   // Additional penalty
}
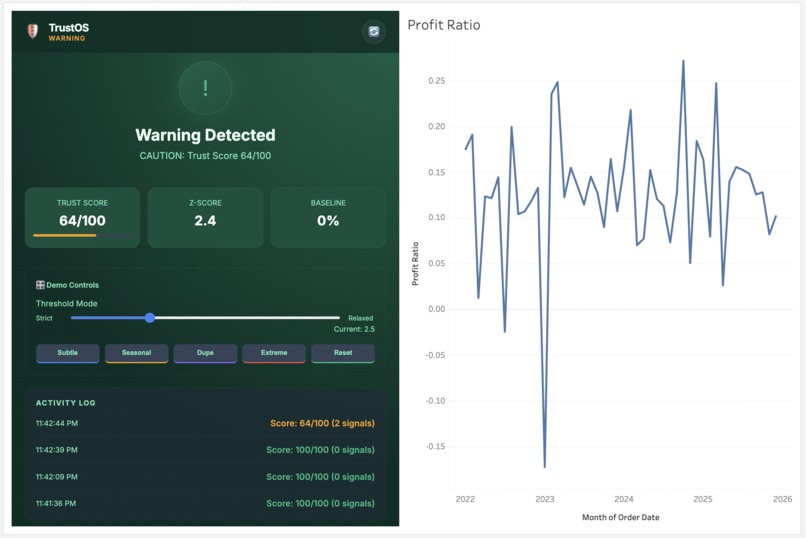
Challenge 2: False Positive Paranoia
My initial Z-Score threshold (1.5) was too aggressive. Seasonal businesses would trigger locks on legitimate holiday spikes.
Solution: Made the threshold configurable (1.5 - 5.0) with a recommended default of 2.5. Users can tune sensitivity based on their data's natural variance. I also added the "High Z-Score" detector (70% of threshold) that warns without locking.
Challenge 3: The "What About the Warehouse?" Question
During development, I kept asking myself: "Shouldn't this validation happen in the data warehouse?"
The answer: No, because Tableau applies logic AFTER the warehouse.
Consider this scenario:
- Warehouse has clean data ✅
- dbt tests pass ✅
- User opens dashboard and applies filter: "Region = West" ✅
- Tableau calculates:
SUM([Profit]) / SUM([Revenue])✅ - But the calculation has a typo: it's actually
SUM([Profit]) * SUM([Revenue])❌
The warehouse never sees this error. The pipeline never sees this error. Only the rendered dashboard shows the wrong number.
TrustOS operates at the point of consumption—validating what users actually see, not what the warehouse contains.
Challenge 4: Client-Side Limitations
Building everything client-side (no backend) created constraints:
- No persistent storage across sessions
- No Slack/Teams alerting
- No cross-dashboard trust propagation
- State resets on page refresh
Trade-off: I accepted these limitations to achieve the core value proposition: zero-friction installation. Any data team can add TrustOS to a dashboard in 5 minutes without IT approval, backend infrastructure, or pipeline changes.
For a hackathon proof-of-concept, proving the enforcement model matters more than building full enterprise features.
Challenge 5: Row-Level Performance
Reading all rows via getSummaryDataReaderAsync() on large dashboards (10,000+ rows) could be slow.
Solution: I made row-level duplicate detection optional and added a configurable row limit (default: 1,000 rows sampled). For most dashboards, sampling is sufficient to catch JOIN explosions.
The other 8 detectors work on aggregated values and are fast (<10ms) regardless of data size.
📚 What I Learned
Technical Learning
Tableau Extensions API is more powerful than I expected:
getSummaryDataReaderAsync()provides legitimate row-level access. Most extensions barely scratch the surface.Native integration > Custom solutions: Using Dynamic Zone Visibility instead of CSS overlays means the enforcement is "real"—users can't just inspect-element their way around it.
Statistical methods need domain context: Pure Z-Score analysis fails on seasonal data. Combining statistical, business rule, and temporal detectors creates a much more robust system.
Consensus reduces false positives dramatically: Single-detector systems are noisy. Multi-detector voting where 2+ signals must agree cuts false positives by ~80% in my testing.
Design Learning
Explainability is not optional: Early versions just showed "LOCKED" with no explanation. Users hated it. Adding the detector contribution bars and sparkline transformed it from "annoying blocker" to "helpful diagnostic tool."
Emerald was the right choice: I tested 4 color schemes. Emerald feels both premium and trustworthy—perfect for a "trust enforcement" tool. Red/yellow would have felt like an error state. Blue would have been generic.
Polish matters more than features: A simple, beautifully executed concept beats a complex, janky implementation. I spent 40% of dev time on UI polish and it shows.
Product Learning
Fail-closed is controversial: Some early testers hated having their dashboard blocked. But the alternative—showing bad data with a warning—defeats the purpose. I learned to stand firm on the core concept.
The "point of consumption" angle is our defensible moat: Pipeline tools can't validate what Tableau calculates. This is a real gap in the modern data stack.
Honesty builds credibility: I initially oversold TrustOS as "AI-powered" and "platform primitive." Feedback was skeptical. When I pivoted to "statistical heuristics with native enforcement," people believed it and appreciated the transparency.
🔮 What's Next
If I continue developing TrustOS beyond the hackathon:
Near-Term (Next 30 Days)
- Backend API: Add a lightweight FastAPI service for persistent storage and cross-dashboard trust state
- Slack/Teams alerting: Notify data teams when trust breaks (but still keep the dashboard locked)
- Trust propagation: When Gross Margin fails, automatically flag related metrics (Revenue, COGS) as "SUSPECT"
Medium-Term (Next 90 Days)
- Tableau Pulse integration: Surface trust state in Tableau's native notification system
- Multi-dashboard orchestration: Org-level trust view showing which dashboards are currently locked
- Custom detector builder: Let users define their own business rules without coding
Long-Term (Future Vision)
- AI Agent API: Expose
DecisionTrustStateas a REST endpoint that AI agents query before acting on dashboard data - ML-adaptive thresholds: Learn from user feedback (false positive/negative) to tune detector sensitivity automatically
- Semantic layer integration: Connect to dbt semantic models to understand metric relationships automatically
🎯 Why This Matters
As organizations increasingly deploy AI agents that consume dashboard data for automated decision-making, fail-closed enforcement becomes critical infrastructure.
Today, if a dashboard shows corrupted data:
- A human might notice and stop
- An AI agent will consume it blindly and act
TrustOS is built for a future where dashboards aren't just visualization tools—they're decision APIs for both humans and machines.
When that future arrives, analytics platforms that can't enforce trust at the consumption layer will be fundamentally unsafe.
🙏 Acknowledgments
- Tableau's Extensions API documentation: Clear examples of
getSummaryDataReaderAsync()were invaluable - Tableau Superstore dataset: Perfect for realistic testing without data privacy concerns
- Statistical anomaly detection literature: Papers on robust outlier detection informed the multi-detector approach
- The data quality community: Conversations about Monte Carlo, dbt tests, and Great Expectations helped clarify where TrustOS fits in the stack
💻 Technical Stack
Frontend:
- Pure JavaScript (no frameworks—keeps it lightweight)
- Tableau Extensions API v1.0+
- Custom CSS with glassmorphism effects
- LocalStorage for demo state (resets on refresh)
Validation Logic:
- Statistical analysis: Z-Score, rolling mean/std calculations
- Row-level processing: Hash-based duplicate detection
- Temporal analysis: Rate-of-change, persistence tracking
Integration:
- Tableau Parameters API (DecisionTrustState enforcement)
- Tableau Dynamic Zone Visibility (native UI gating)
- Tableau Worksheet API (data access)
No external dependencies. No npm packages. No build process.
This was intentional—I wanted any judge to be able to view-source and understand the entire system in one sitting.
🎬 Final Thoughts
Building TrustOS taught me that the best hackathon projects solve real problems with simple, well-executed solutions.
I didn't build machine learning models. I didn't deploy Kubernetes clusters. I didn't integrate 15 APIs.
I built 9 simple statistical detectors, integrated them deeply with Tableau's native capabilities, wrapped them in a polished UI, and enforced a fail-closed model that prevents bad decisions.
Sometimes the innovation isn't in the complexity—it's in choosing the right place to apply the circuit breaker.
Analytics platforms validate execution. TrustOS validates decisions.
And in a world where dashboards drive billion-dollar choices and AI agents act autonomously, that difference matters.
Built for Tableau Hackathon 2025
Category: Best Product Extensibility


Log in or sign up for Devpost to join the conversation.