-
-
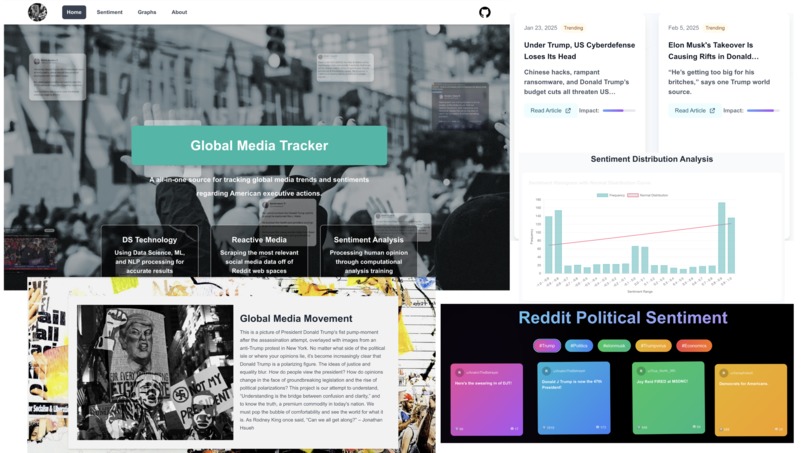
GlobalMedia Gallery
-
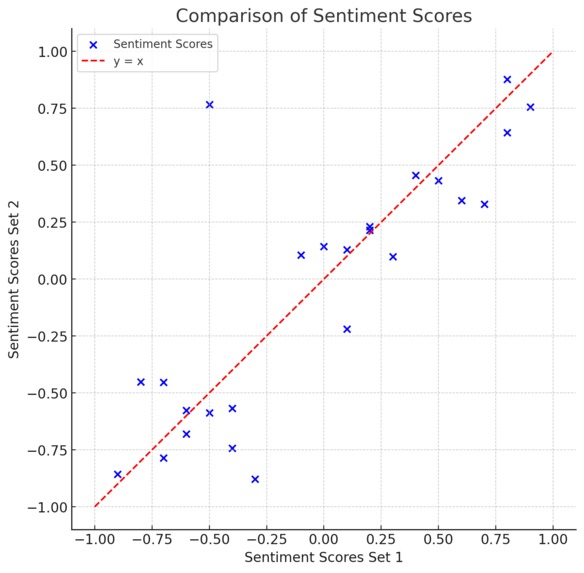
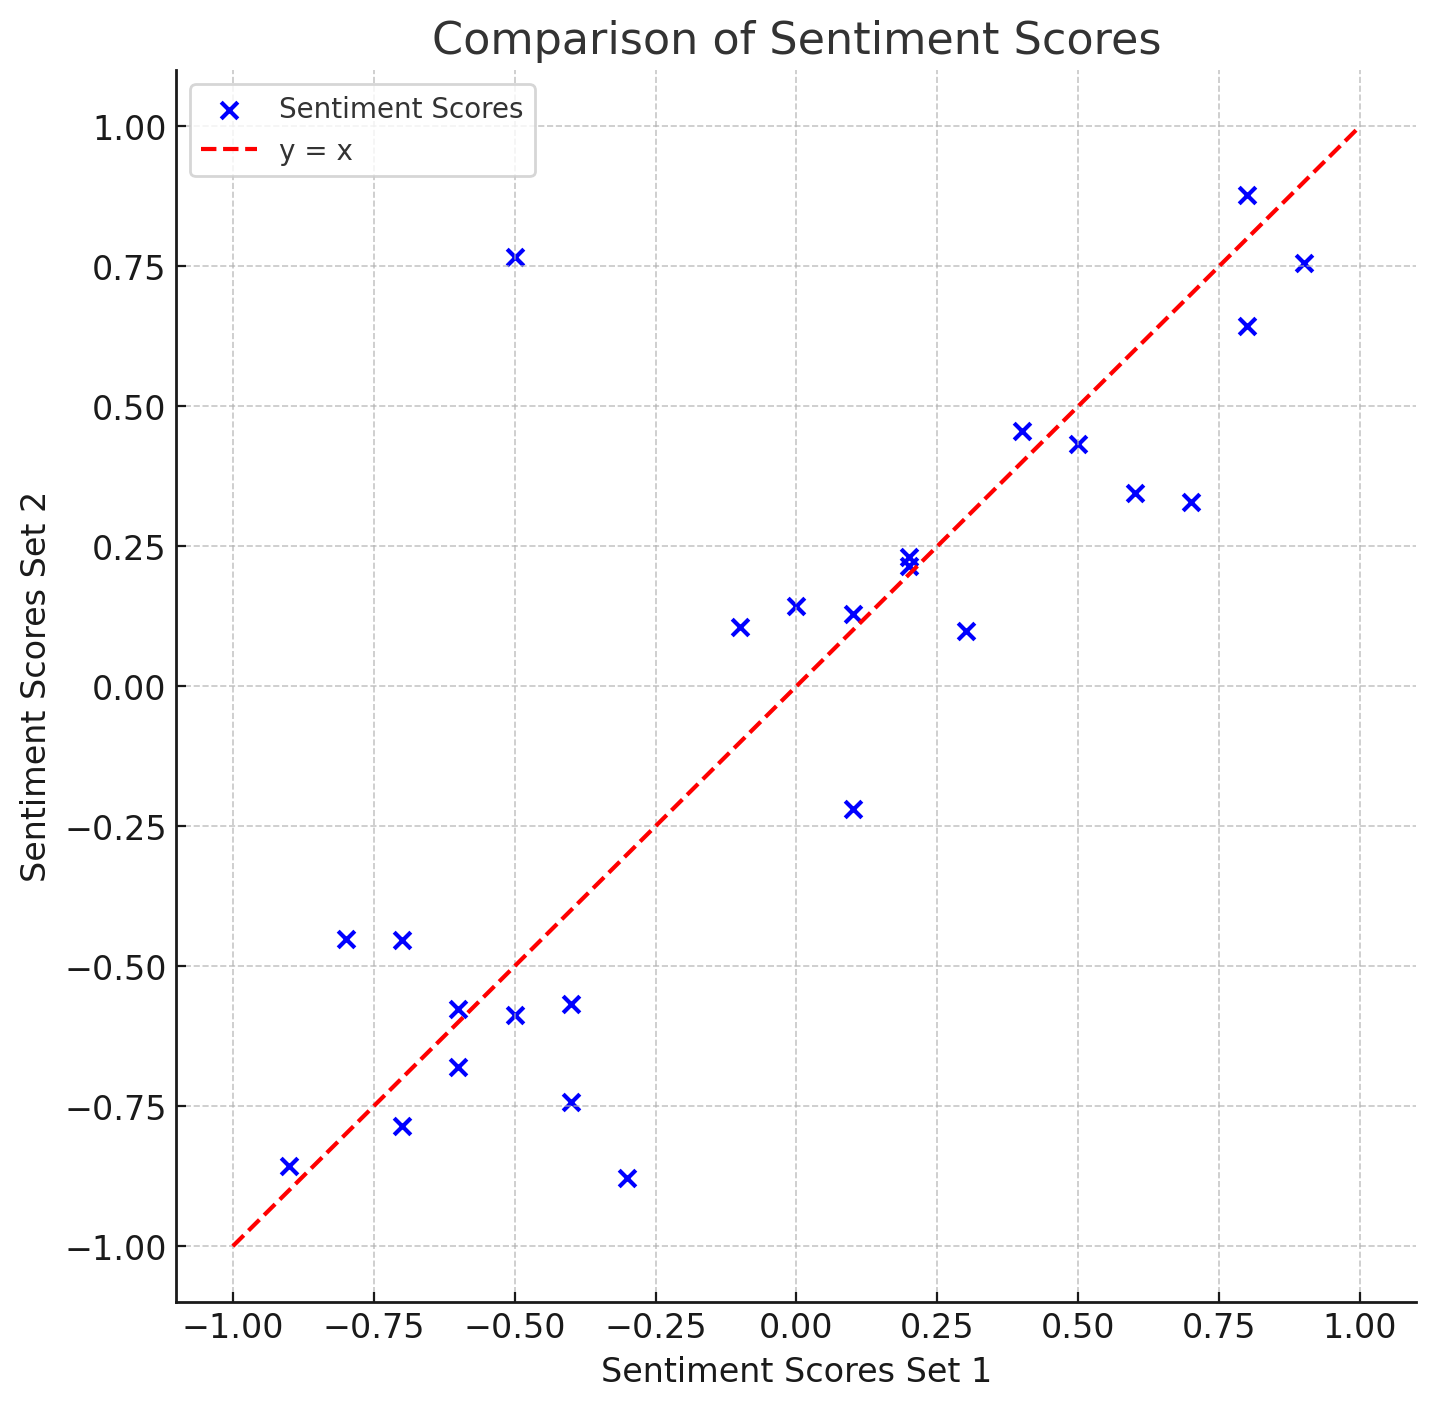
groq vs chatgpt sentiment analysis

Inspiration
Our inspiration was the amount of binary polling that takes place throughout America.
What it does
Our website takes in public sentiment from Reddit and displays it in interactive, dynamic graphs/charts.
How we built it
We scraped data off Reddit using their API and Python and put the data through a NLP, using Groq, and implemented it within our website.
What we learned
Through our website we can see how public sentiment has changed over time, specifically how the media reacted to important presidential decisions since he was elected in office.
What's next for Trump Sentiment Tracker (Reddit)
We plan to add more graphs and charts, real-time data, and more social media sentiment.


Log in or sign up for Devpost to join the conversation.