-
-
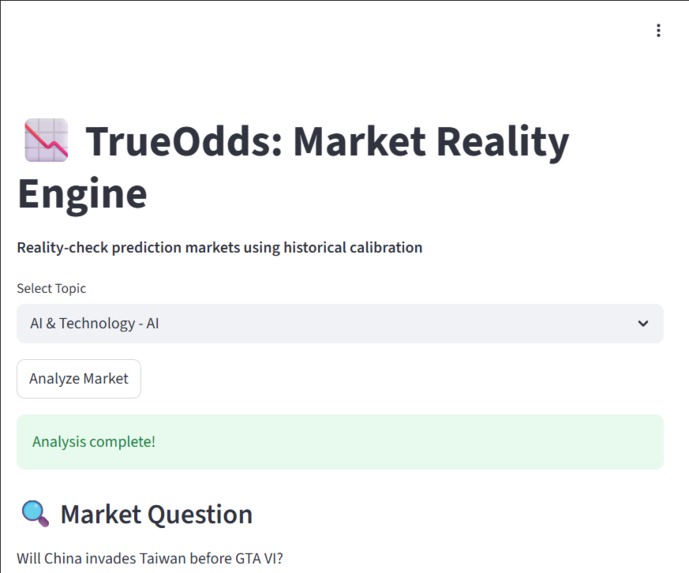
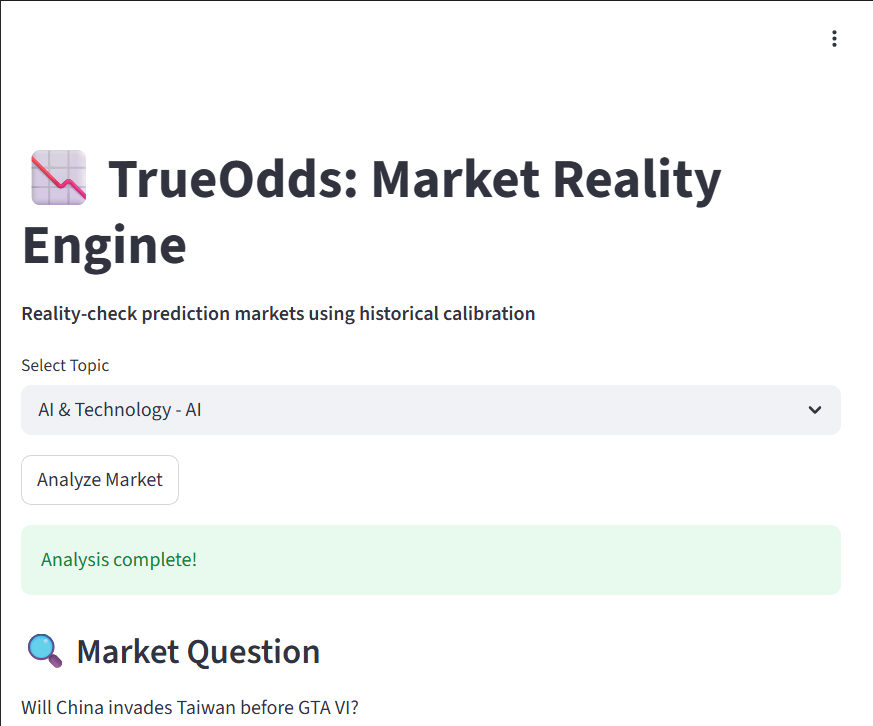
Interactive interface for analyzing prediction markets using calibrated probabilities instead of raw market sentiment.
-
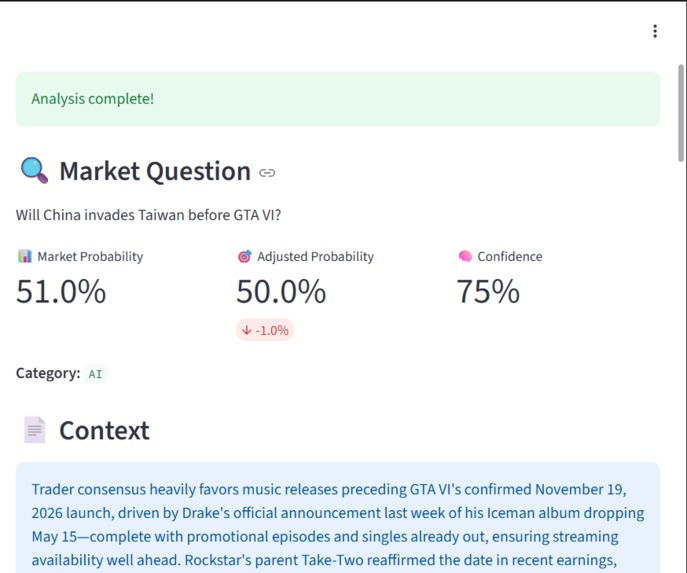
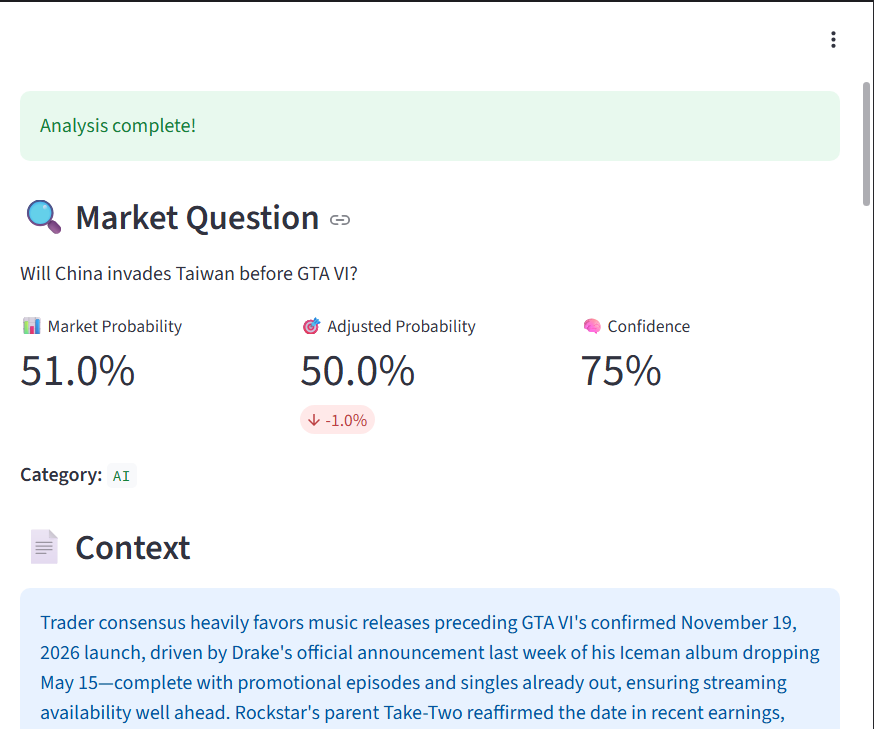
Example of a market prediction with adjusted probability, confidence score, and contextual explanation.
-
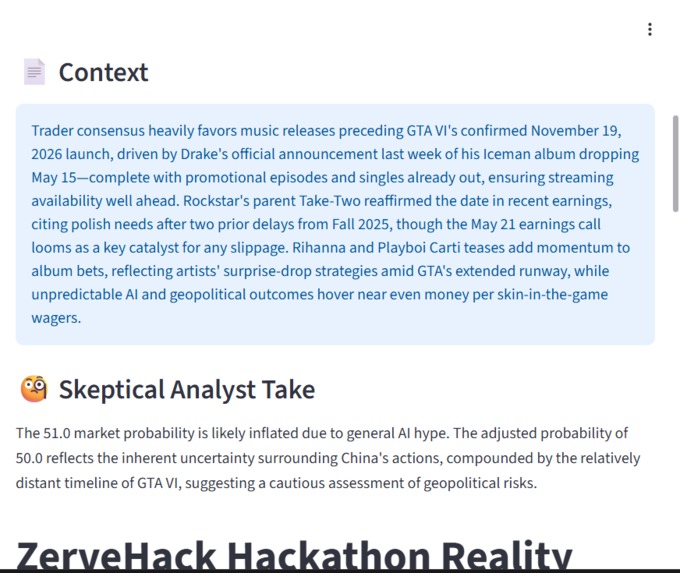
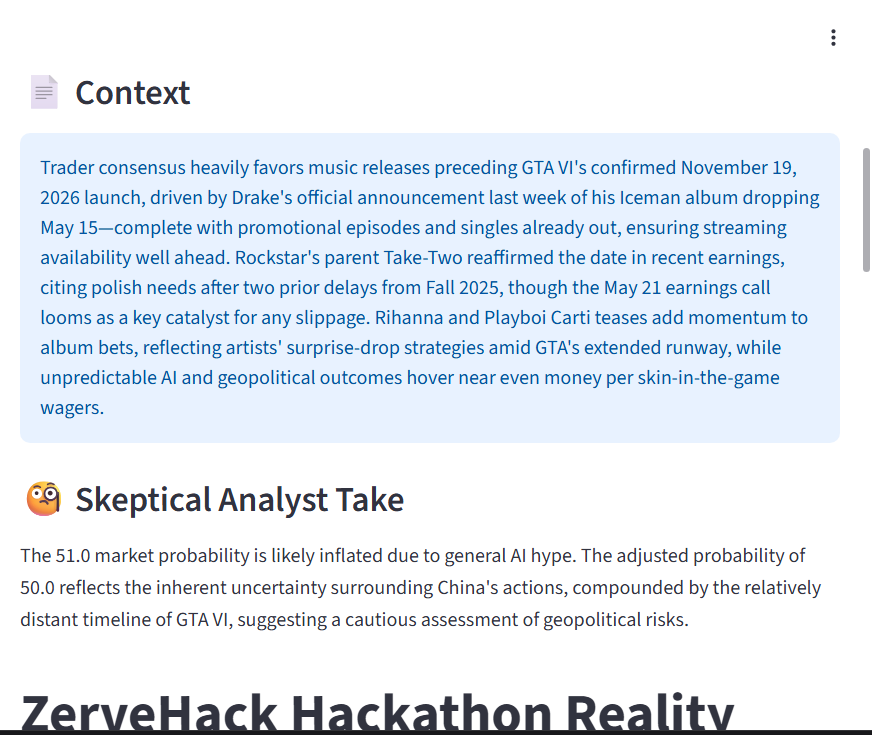
AI-generated explanation highlighting potential bias in market predictions and providing a more grounded interpretation.
-
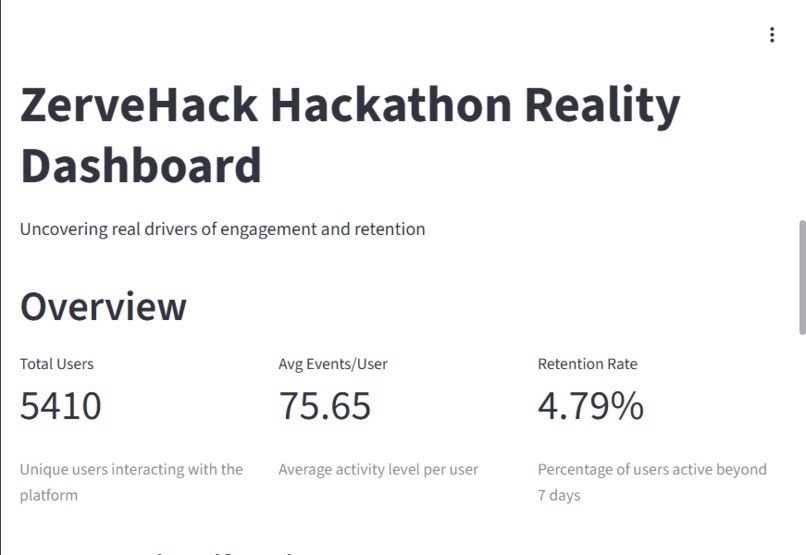
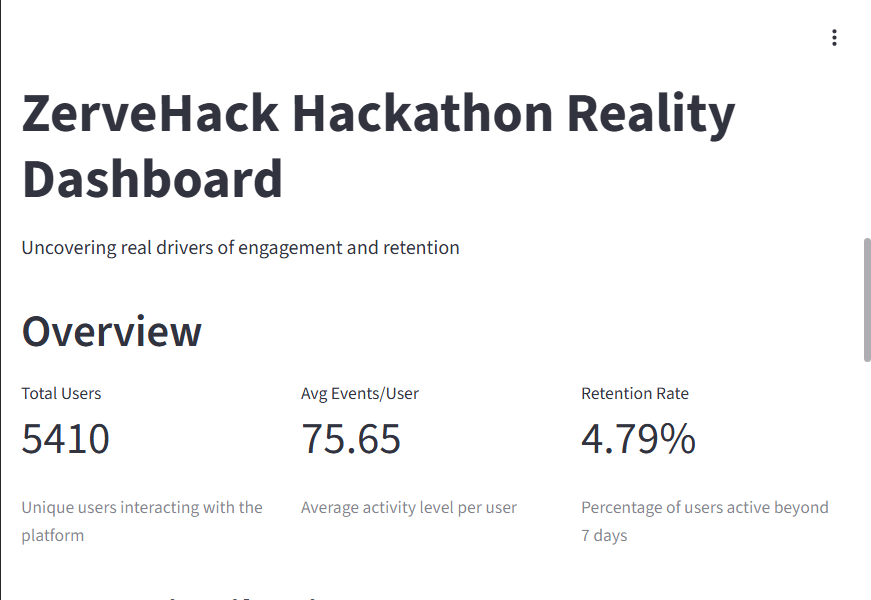
ZerveHack User Retention Analysis - Overview of engagement, activity, and retention metrics
-
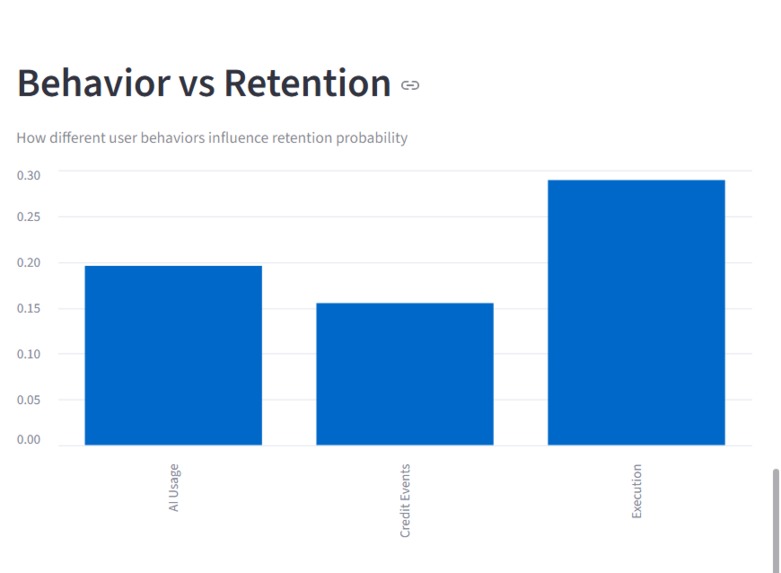
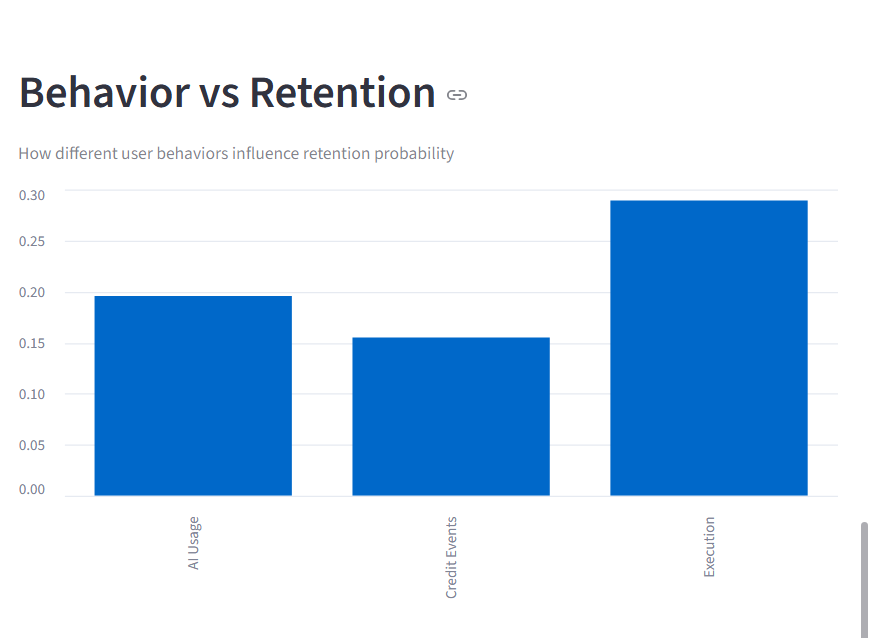
Zerve User Retention Analysis - Execution drives stronger retention than AI usage
-
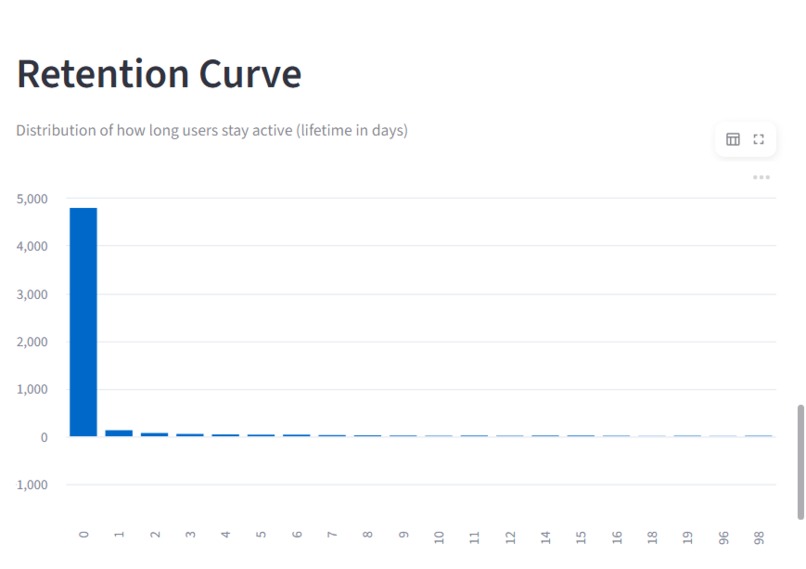
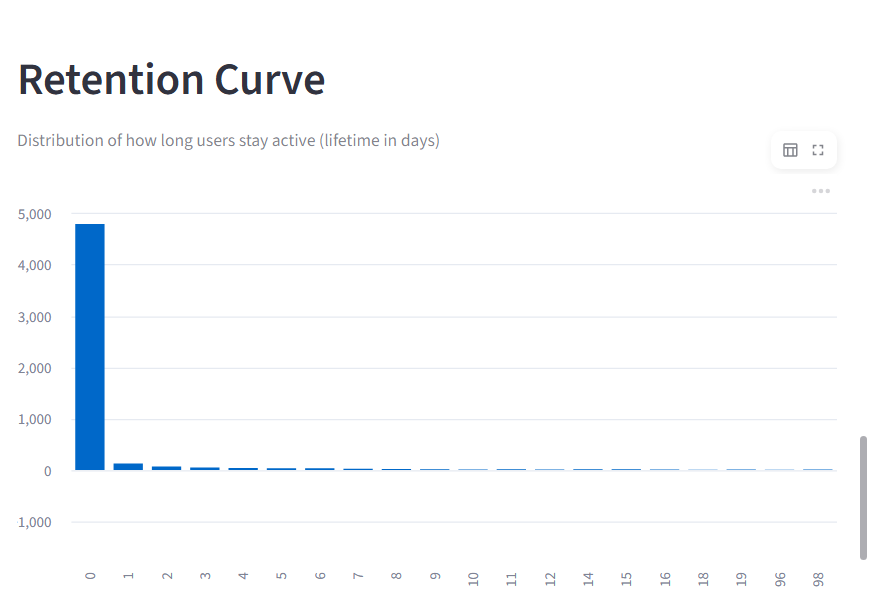
Zerve Hack User Retention Analysis - User lifetime distribution shows many users drop off early in their journey
-
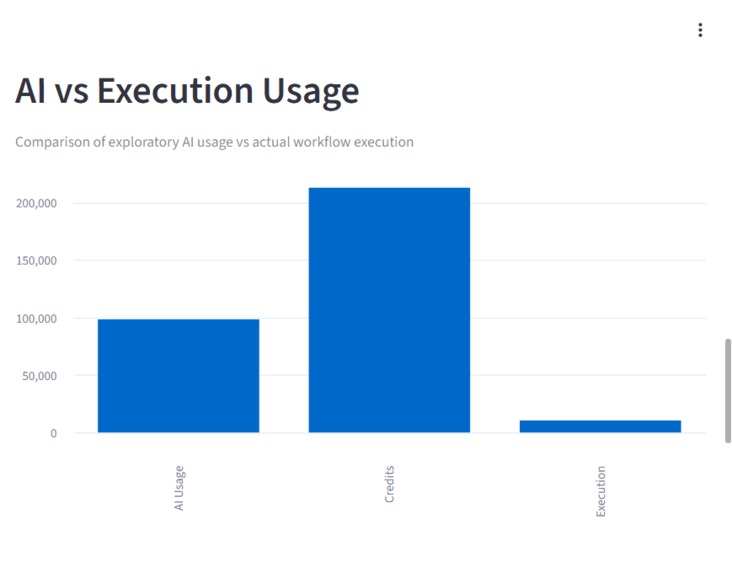
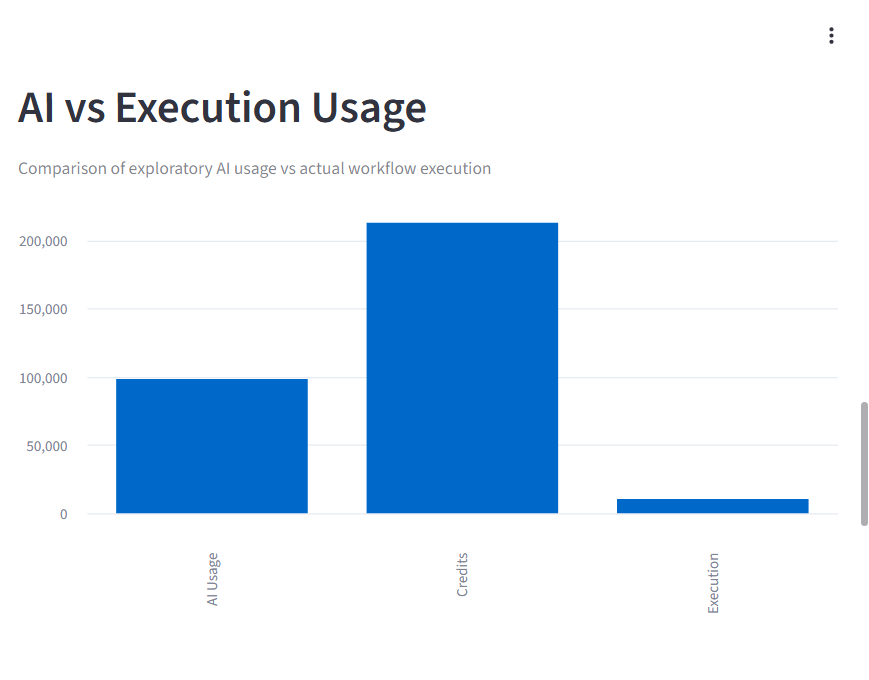
Comparison between exploratory AI usage and actual workflow execution, revealing a gap between interaction and meaningful usage.
-
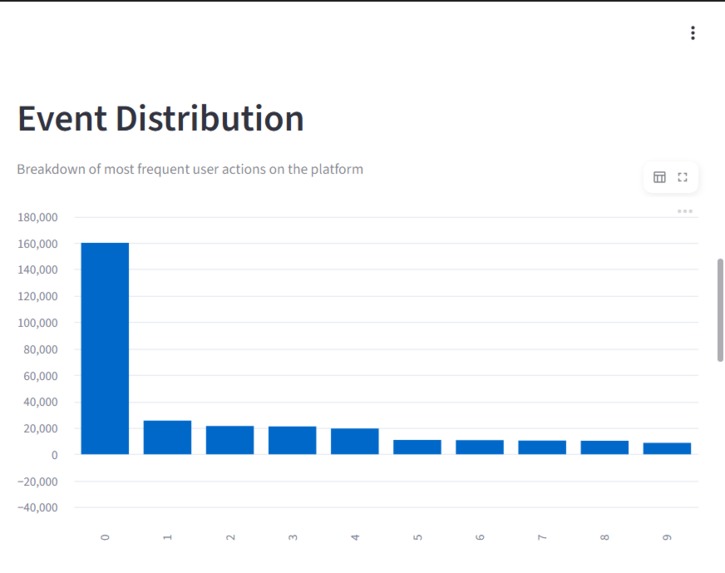
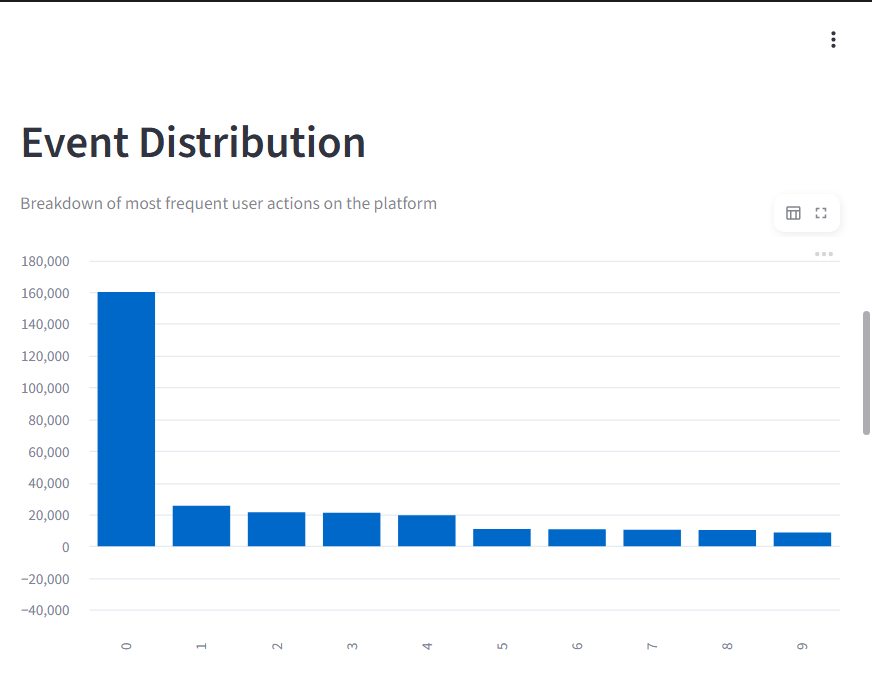
Breakdown of the most frequent user actions, highlighting dominant behaviors such as AI interactions and credit usage.
-
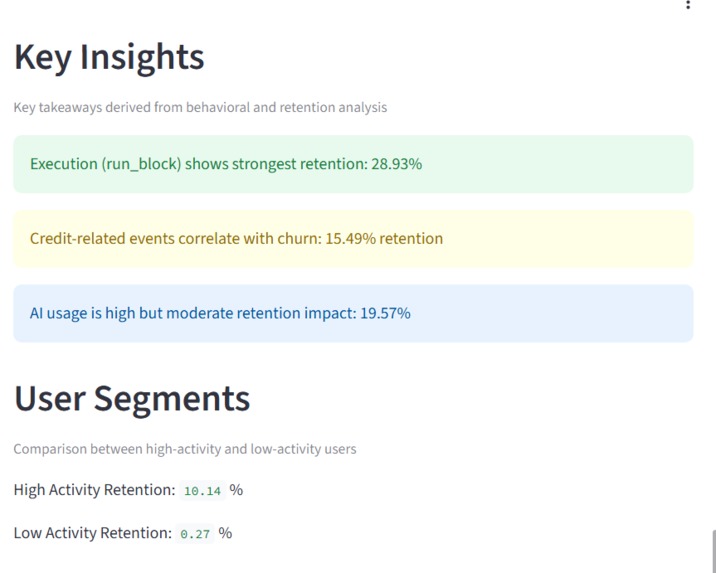
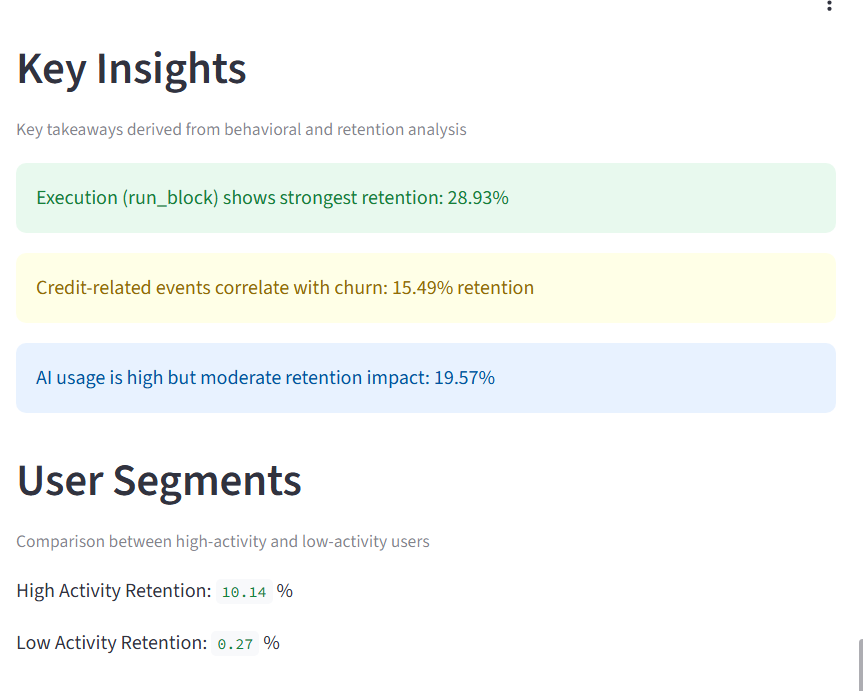
Key insights from analysis reveal that workflow execution is the strongest driver of retention,High AI usage but only moderate contribution
Inspiration
Whether it is the prediction markets or product analytics, we noticed the same core problem: decisions are often driven by perception rather than reality. This leads to the users being misled by hype-driven probabilities. Markets reflect hype, narratives, and crowd sentiment, while product teams often rely on surface level engagement metrics that do not necessarily translate to long term value.
We were inspired to build a system that answers a simple but powerful question "What is actually true vs what just looks true?".
This led to the idea of building two complementary "Reality Engines" - one for markets and one for product (Zerve App) behavior - both focused on exposing hidden bias and uncovering real signals. We designed the interface so that even a non-technical user can immediately understand whether a market is overconfident or not.
What it does
TrueOdds consists of two key components:
Market Reality Engine It takes live prediction market data (Polymarket) and adjusts probabilities using historical calibration (Metaculus-style logic), producing a Skepticism-Adjusted Probability. Instead of "Market says 80%", it shows "Realistic probability is closer to 65% based on historical bias". This prevents users from being misled by hype-driven probabilities. Dashboard guides the user like a story:
- What is the event
- What market thinks
- What reality suggests
- Final verdict
- Explanation
AI Product Reality Dashboard Using Zerve User Retention data, our tool analyze:
User behavior (AI usage, execution, credit events)
Retention patterns
Engagement vs actual value
It highlights: What users do vs what actually makes them stay Overvalued vs undervalued behaviors Friction points like credit exhaustion
How we built it
Market Reality Engine
- Data Source
- Polymarket API (live market odds)
- Metaculus-style calibration logic
Backend Logic
- Built a pipeline to fetch and filter market data
- Designed a calibration system to adjust probabilities
- Blocks : Python block "polymarket_hype_fetcher" -> Python block "calibrate_probability_prediction" -> GenAI Block "skeptical_forecast_analysis"
Analysis Layer
- Compared market probabilities vs historically calibrated probabilities
- Identified overconfidence and bias in prediction markets
Frontend
- Displayed market probability vs adjusted probability
- Highlighted mispricing and confidence levels
AI Layer
- Generated concise explanations for market mispricing
- Explained why markets may be overconfident or underconfident
Product Behavior Reality Engine
- Data Sources
- Zerve User Retention dataset (event-level analytics)
- Backend Logic
- Aggregated event-level data into user-level metrics
- Engineered behavioral signals :AI usage, Execution (run_block) & Credit friction (credits events)
- Analysis Layer
- Computed retention rates and behavioral impact
- Compared engagement vs actual retention drivers
- Identified misalignment between usage and value
- Frontend
- Built an interactive Streamlit dashboard
- Visualized:Event distribution, Retention curves & Behavior vs retention
- Added insight-driven summaries for clarity
- AI Layer
- Translated behavioral metrics into human-readable insights
- Highlighted key product insights (e.g., overvalued vs undervalued behaviors)
Challenges we ran into
- Noisy and inconsistent data
- Market data didn’t always align cleanly with topics Event-level data had many nulls and required heavy preprocessing
- Over-filtering issues Initial keyword-based filtering removed valid market signals We had to implement fallback and ranking strategies
- Event-level complexity Raw logs weren’t directly usable Required transformation into meaningful user-level metrics
- AI output formatting Handling inconsistent JSON outputs from the AI layer Needed robust parsing and cleanup
Accomplishments that we're proud of
- Built a unified concept (“Reality Engine”) across two completely different domains
- Identified a non-obvious insight:
- High AI usage does not strongly correlate with retention, but execution does
- Transformed messy event data into actionable product insights
- Created a system that doesn’t just show data, but challenges assumptions
- Delivered a complete end-to-end product: Data → Analysis → Insight → UI → Explanation
What we learned
Key Learnings: Mastering the Zerve Ecosystem
Unified Development-to-Deployment Lifecycle We learned that Zerve effectively bridges the "valley of death" between data exploration and production. By using the Collaborative Canvas, we could prototype our salary analysis in Python and instantly transform those logic blocks into a live Streamlit web app or FastAPI service without refactoring code or managing external servers.
Seamless Multi-Language Interoperability A core takeaway was the power of Zerve's data-sharing architecture. We observed how variables flow naturally between blocks, allowing us to mix Python for data cleaning, SQL for querying, and R for statistical modeling on a single canvas without the friction of manual exports or CSV hand-offs.
AI as a Full-Context Pipeline Architect We discovered that the Zerve AI agent is more than just an autocomplete tool; it is a context-aware collaborator. Because the agent understands our entire project,including data schemas, existing variables, and the logic of previous blocks. It helped us plan and debug the 4-layer pipeline, explaining its reasoning before execution to keep us in control.
Infrastructure-as-a-Service (No More "Works on My Machine") We learned how Zerve eliminates environment-related bugs by managing the underlying infrastructure.
What's next for TrueOdds
- Public API - Allow developers to query “Skepticism-Adjusted Probabilities”
- Stronger AI explanations - Context-aware insights across domains
- Unified Truth Engine extend to: Finance (stocks vs fundamentals), Social trends (hype vs reality) or Product analytics at scale
Built With
- genai
- python

Log in or sign up for Devpost to join the conversation.