Inspiration
Games show their odds in tiny print: "Legendary: 0.6%". Kids my age see that number every day, and it's impossible to feel what it means. Is 0.6% ten dollars? A hundred? Many players only find out after they've spent the money. I wanted a tool that answers that question in money and time, before you pull.
What it does
You type the odds your game publishes: chance per pull, price per pull, an optional guarantee ("pity" after N pulls), how many copies you need, and your weekly allowance.
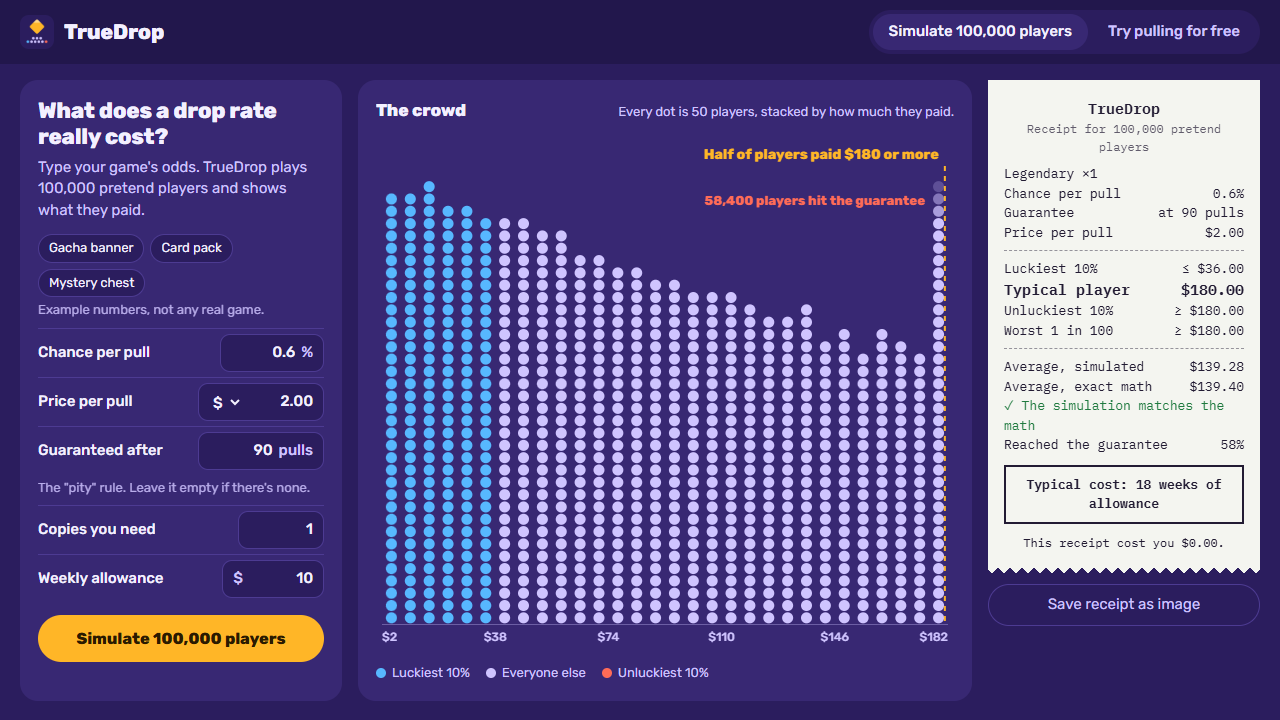
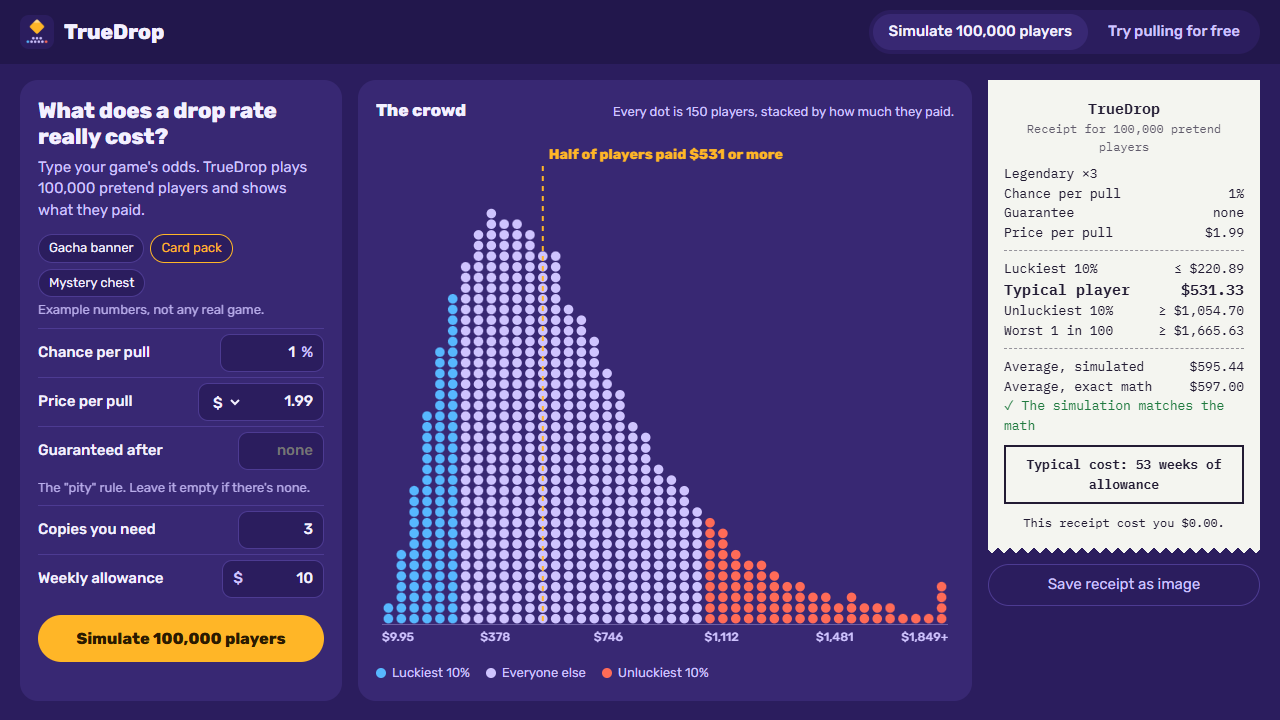
TrueDrop then plays 100,000 pretend players. You watch them stack up into a crowd by how much each one paid: blue for the luckiest 10%, red for the unluckiest 10%, and a gold line at the median. Then a receipt prints with the luckiest 10%, the typical player, the unluckiest 10%, the worst 1 in 100, and the cost in weeks of allowance. The receipt itself costs $0.00.
Some things it showed us:
- With 0.6% odds, $2 a pull and a guarantee at 90 pulls, 58% of players never get lucky and pay the full $180. That's 18 weeks of a $10 allowance.
- With 1% odds and no guarantee, 1 in 10 players pays over $450 for one item.
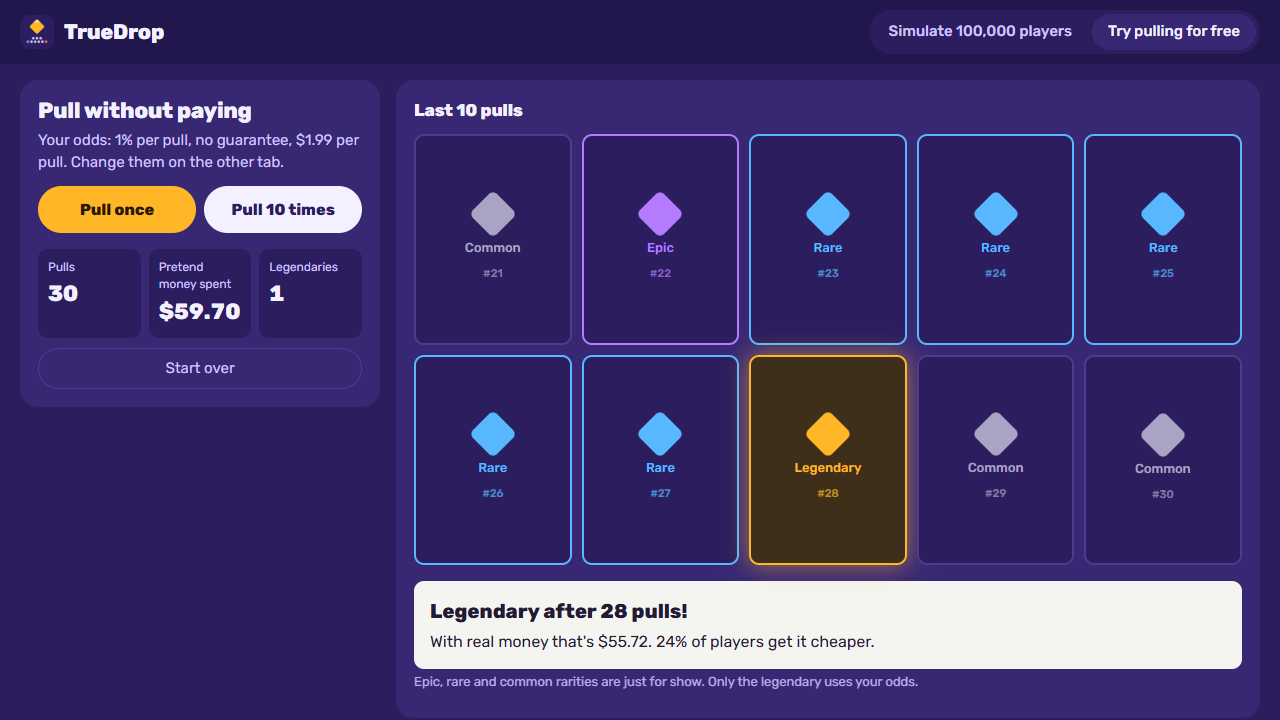
There's also a Try pulling for free mode: you pull with pretend money and feel the grind, and when the legendary drops it tells you what that would have cost and how many players got it cheaper. You can save the receipt as an image and share it, and the odds are saved in the link.
How we built it
- Plain HTML, CSS and JavaScript. No framework, no build step, no API keys, and nothing is sent to a server.
- A Web Worker runs the simulation, so the page never freezes. The number of pulls until a win follows a geometric distribution, so each player's pulls are drawn directly with inverse transform sampling instead of simulating every single pull. That makes 100,000 players take a fraction of a second.
- Exact math as a check. The expected pulls per copy with a guarantee after N pulls are (1 − (1 − p)^N) / p. The receipt shows the exact average next to the simulated one, and they match within a fraction of a percent.
- A canvas draws the crowd dot by dot, chunk by chunk, so you can watch it fill up. If almost everyone hits the guarantee, that column is cut off and labeled, so it doesn't flatten the rest of the chart.
- A seeded random number generator (mulberry32): add
?seed=76to the address and every run repeats the same luck. - Claude, Anthropic's AI assistant, helped a lot: we came up with the idea together, and Claude wrote most of the code, the design and the demo video script. The demo video is a real recording of the app, with an AI voice (Microsoft Edge text-to-speech).
Challenges we ran into
- The guarantee made one giant column that squashed the whole chart flat. We cut it off at the top and labeled how many players are in it.
- Simulating every pull of 100,000 players for rare items was too slow. Switching to the geometric distribution fixed it.
- Saying "the median player paid more than $180" was wrong when the median is the maximum, so the label now says "$180 or more".
Accomplishments that we're proud of
- The simulation and the exact formula agree, so the numbers can be trusted.
- It turns a percentage into something you feel: a crowd, a receipt, and weeks of allowance.
What we learned
- How geometric distributions work, and why "0.6% per pull" doesn't mean "about 167 pulls" for most people.
- How to keep a page smooth with a Web Worker, and how to draw charts on a canvas without a library.
What's next for TrueDrop
- Soft pity (odds that rise before the guarantee) and 50/50 banners.
- A "which offer is better?" comparison for bundles and discounts.
- A version for parents, to talk about in-game spending with their kids.
Built With
- canvas
- claude
- css3
- github
- html5
- javascript
- web-workers

Log in or sign up for Devpost to join the conversation.