TRINIT_Tech-savvy_DEV03
Topic: Data Pipelining and Visualization
In recent times , we have seen the introduction of a new concept called Industry 4.0 in which the emphasis lies on data driven decision making . The data is usually collected from customers or clients who use the services of the firm or various equipment used for production of goods for the firm. The accumulated data is then extracted and processed and visualized with different filters to aid in the decision making process.
Here we designed a website for visualizing data , consisting of a progress bar displaying all the steps user has accomplished right from taking data from the source to displaying it on the website and sending notifications to the user. The user also have the options to apply different filters and provide mechanisms to apply statistical and analytical methods such as regression , so that the end user can derive useful insights from the provided raw data.
Tech Stack:
Front-end:
-> React
->Plotlyjs for graphical simulation

 Backend:
 ->Nodejs
 ->express.js
 ->mongodb
MAIN FEATURES
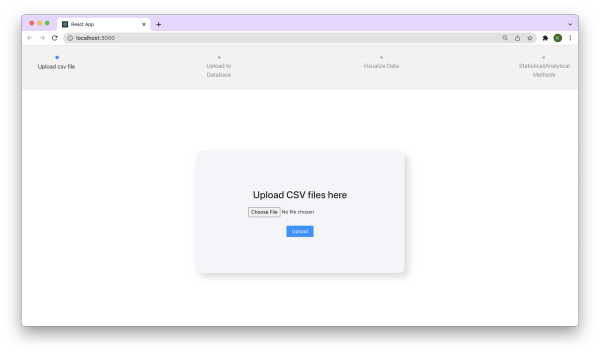
UPLOADING OF FILES (WINDOW 1): The data to be used as input must strictly be in the form of .csv files. The user can click, select and upload the respective files.
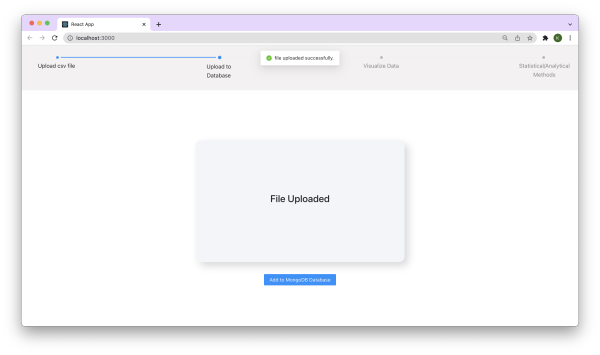
UPLOADING OF FILES TO DATABASE (WINDOW 2) : Sends the uploaded files to MongoDB.The platform sends real-time notifications to the user on successful uploading of files.
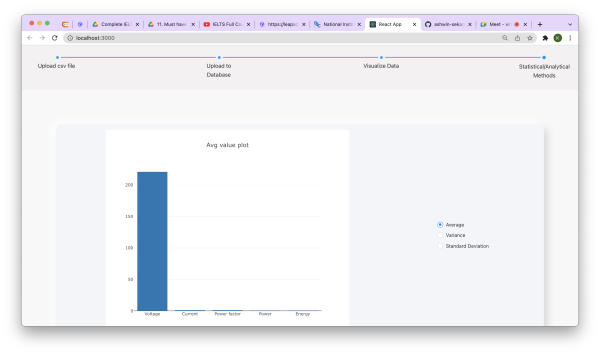
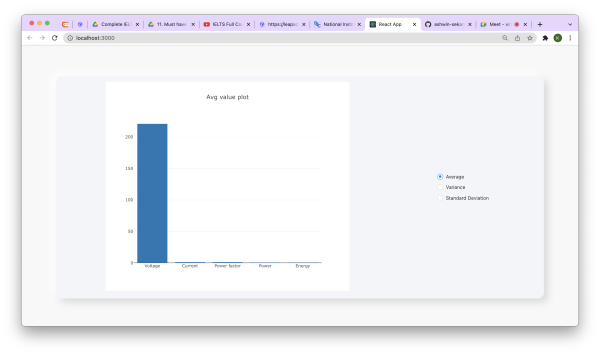
VISUALIZATION OF DATA (WINDOW 3) : The user interface allows the user to plot the features in different graphs as per their own requirements . The platform allows downloading the graphs and charts chosen by the user to the local PC.
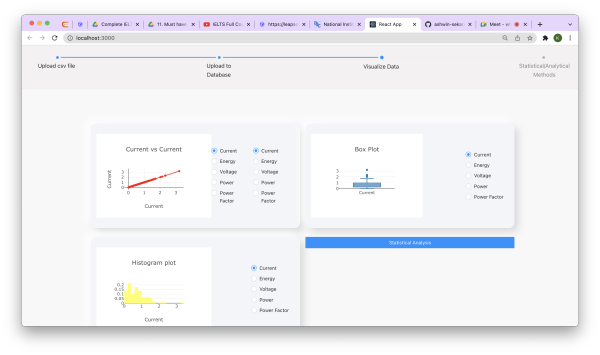
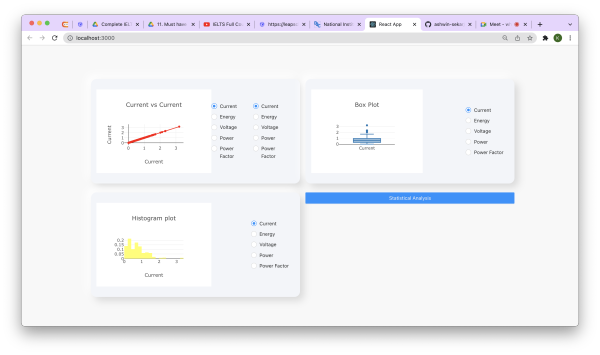
STATISTICAL/ANALYTICAL METHODS (WINDOW 4) : The user interface allows the application of atleast a few statistical and analytical methods.
Short demo video is on this link

Log in or sign up for Devpost to join the conversation.