-
-

Project Demo
-

The Problem
-
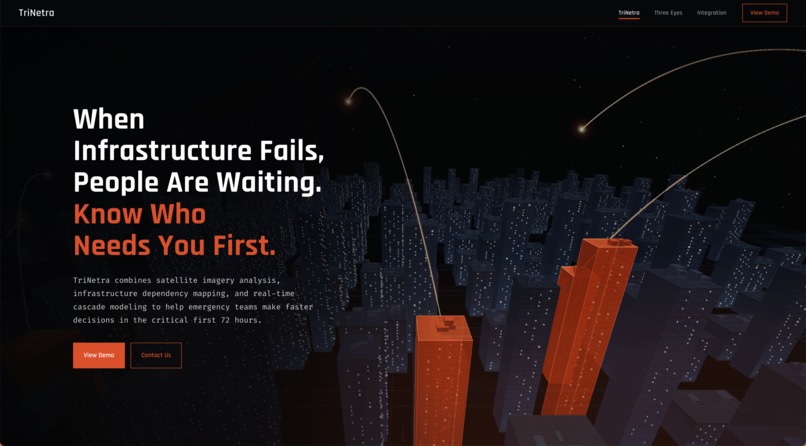
Holy Frontend
-
The Three Eyes
-
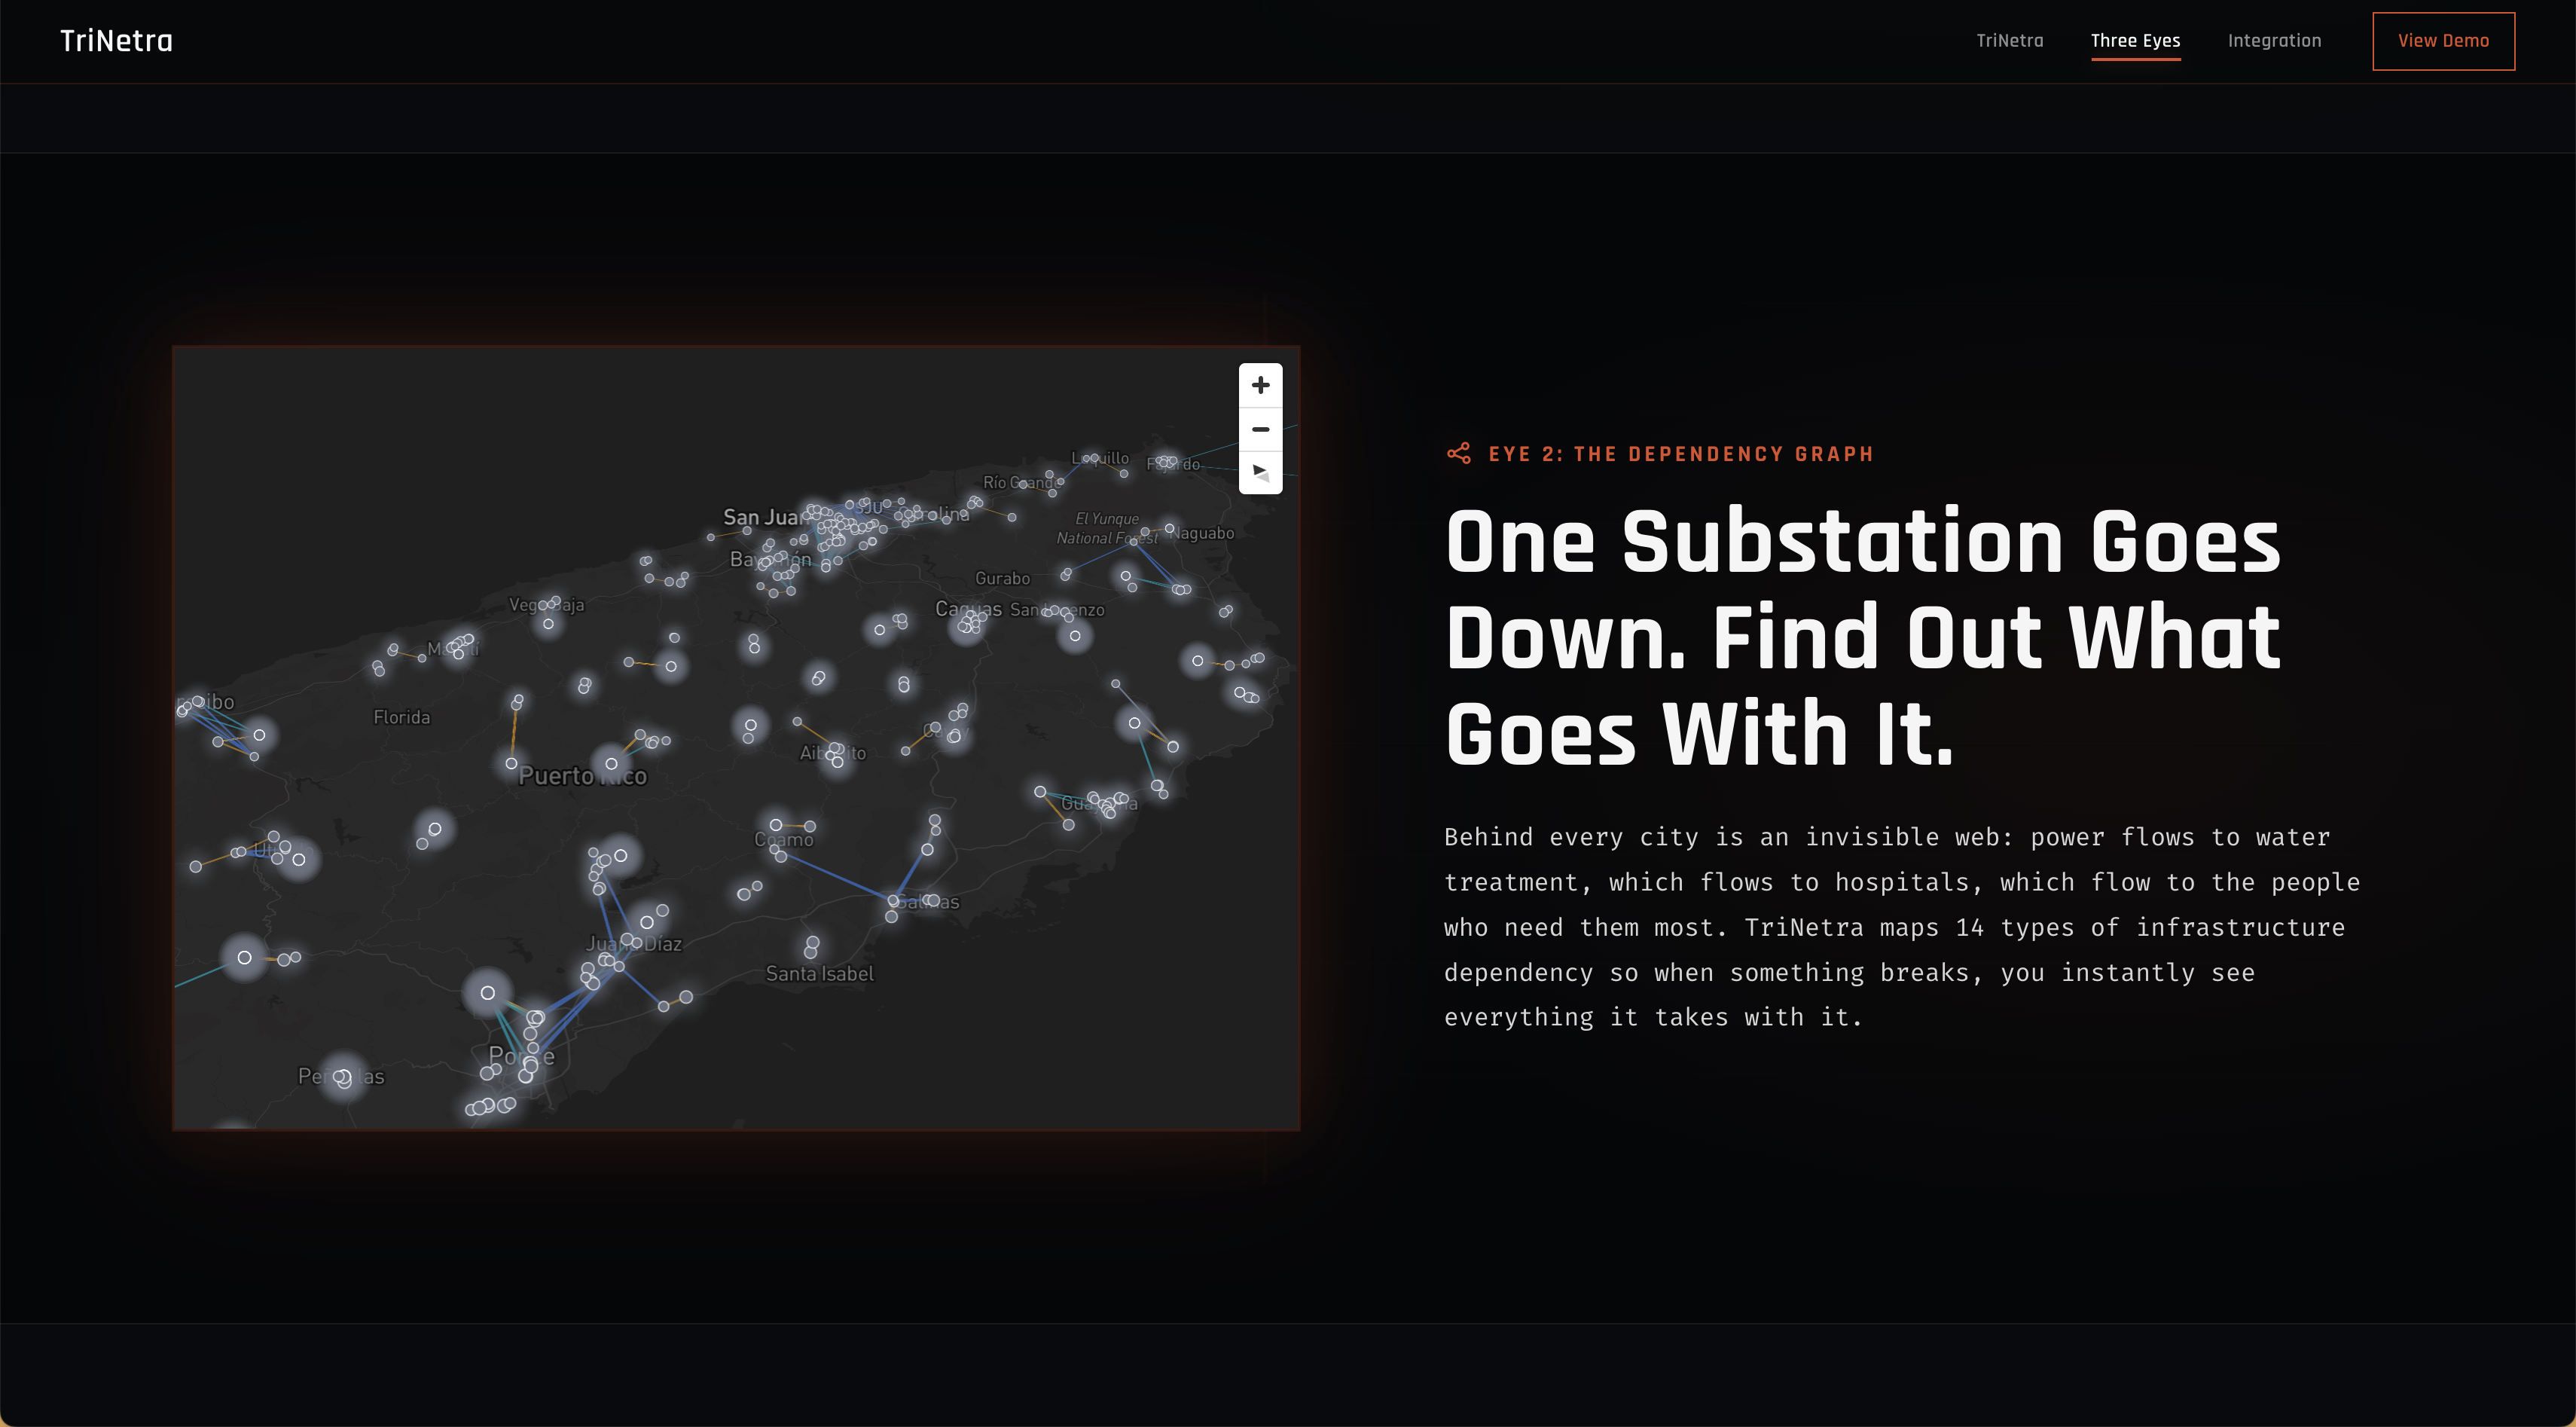
Graph Dependency
-
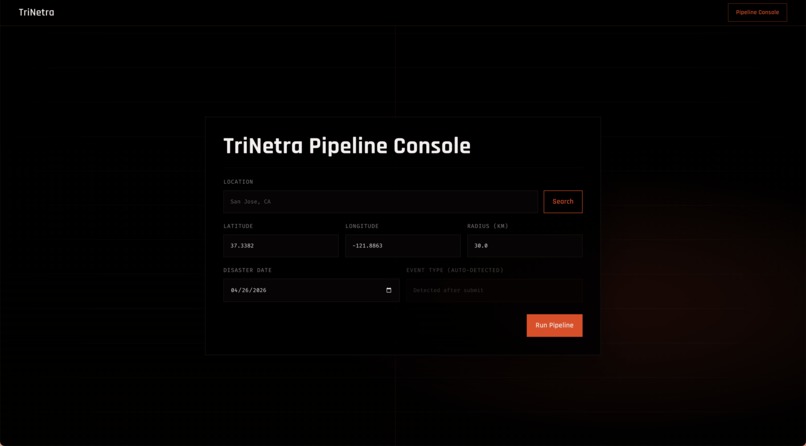
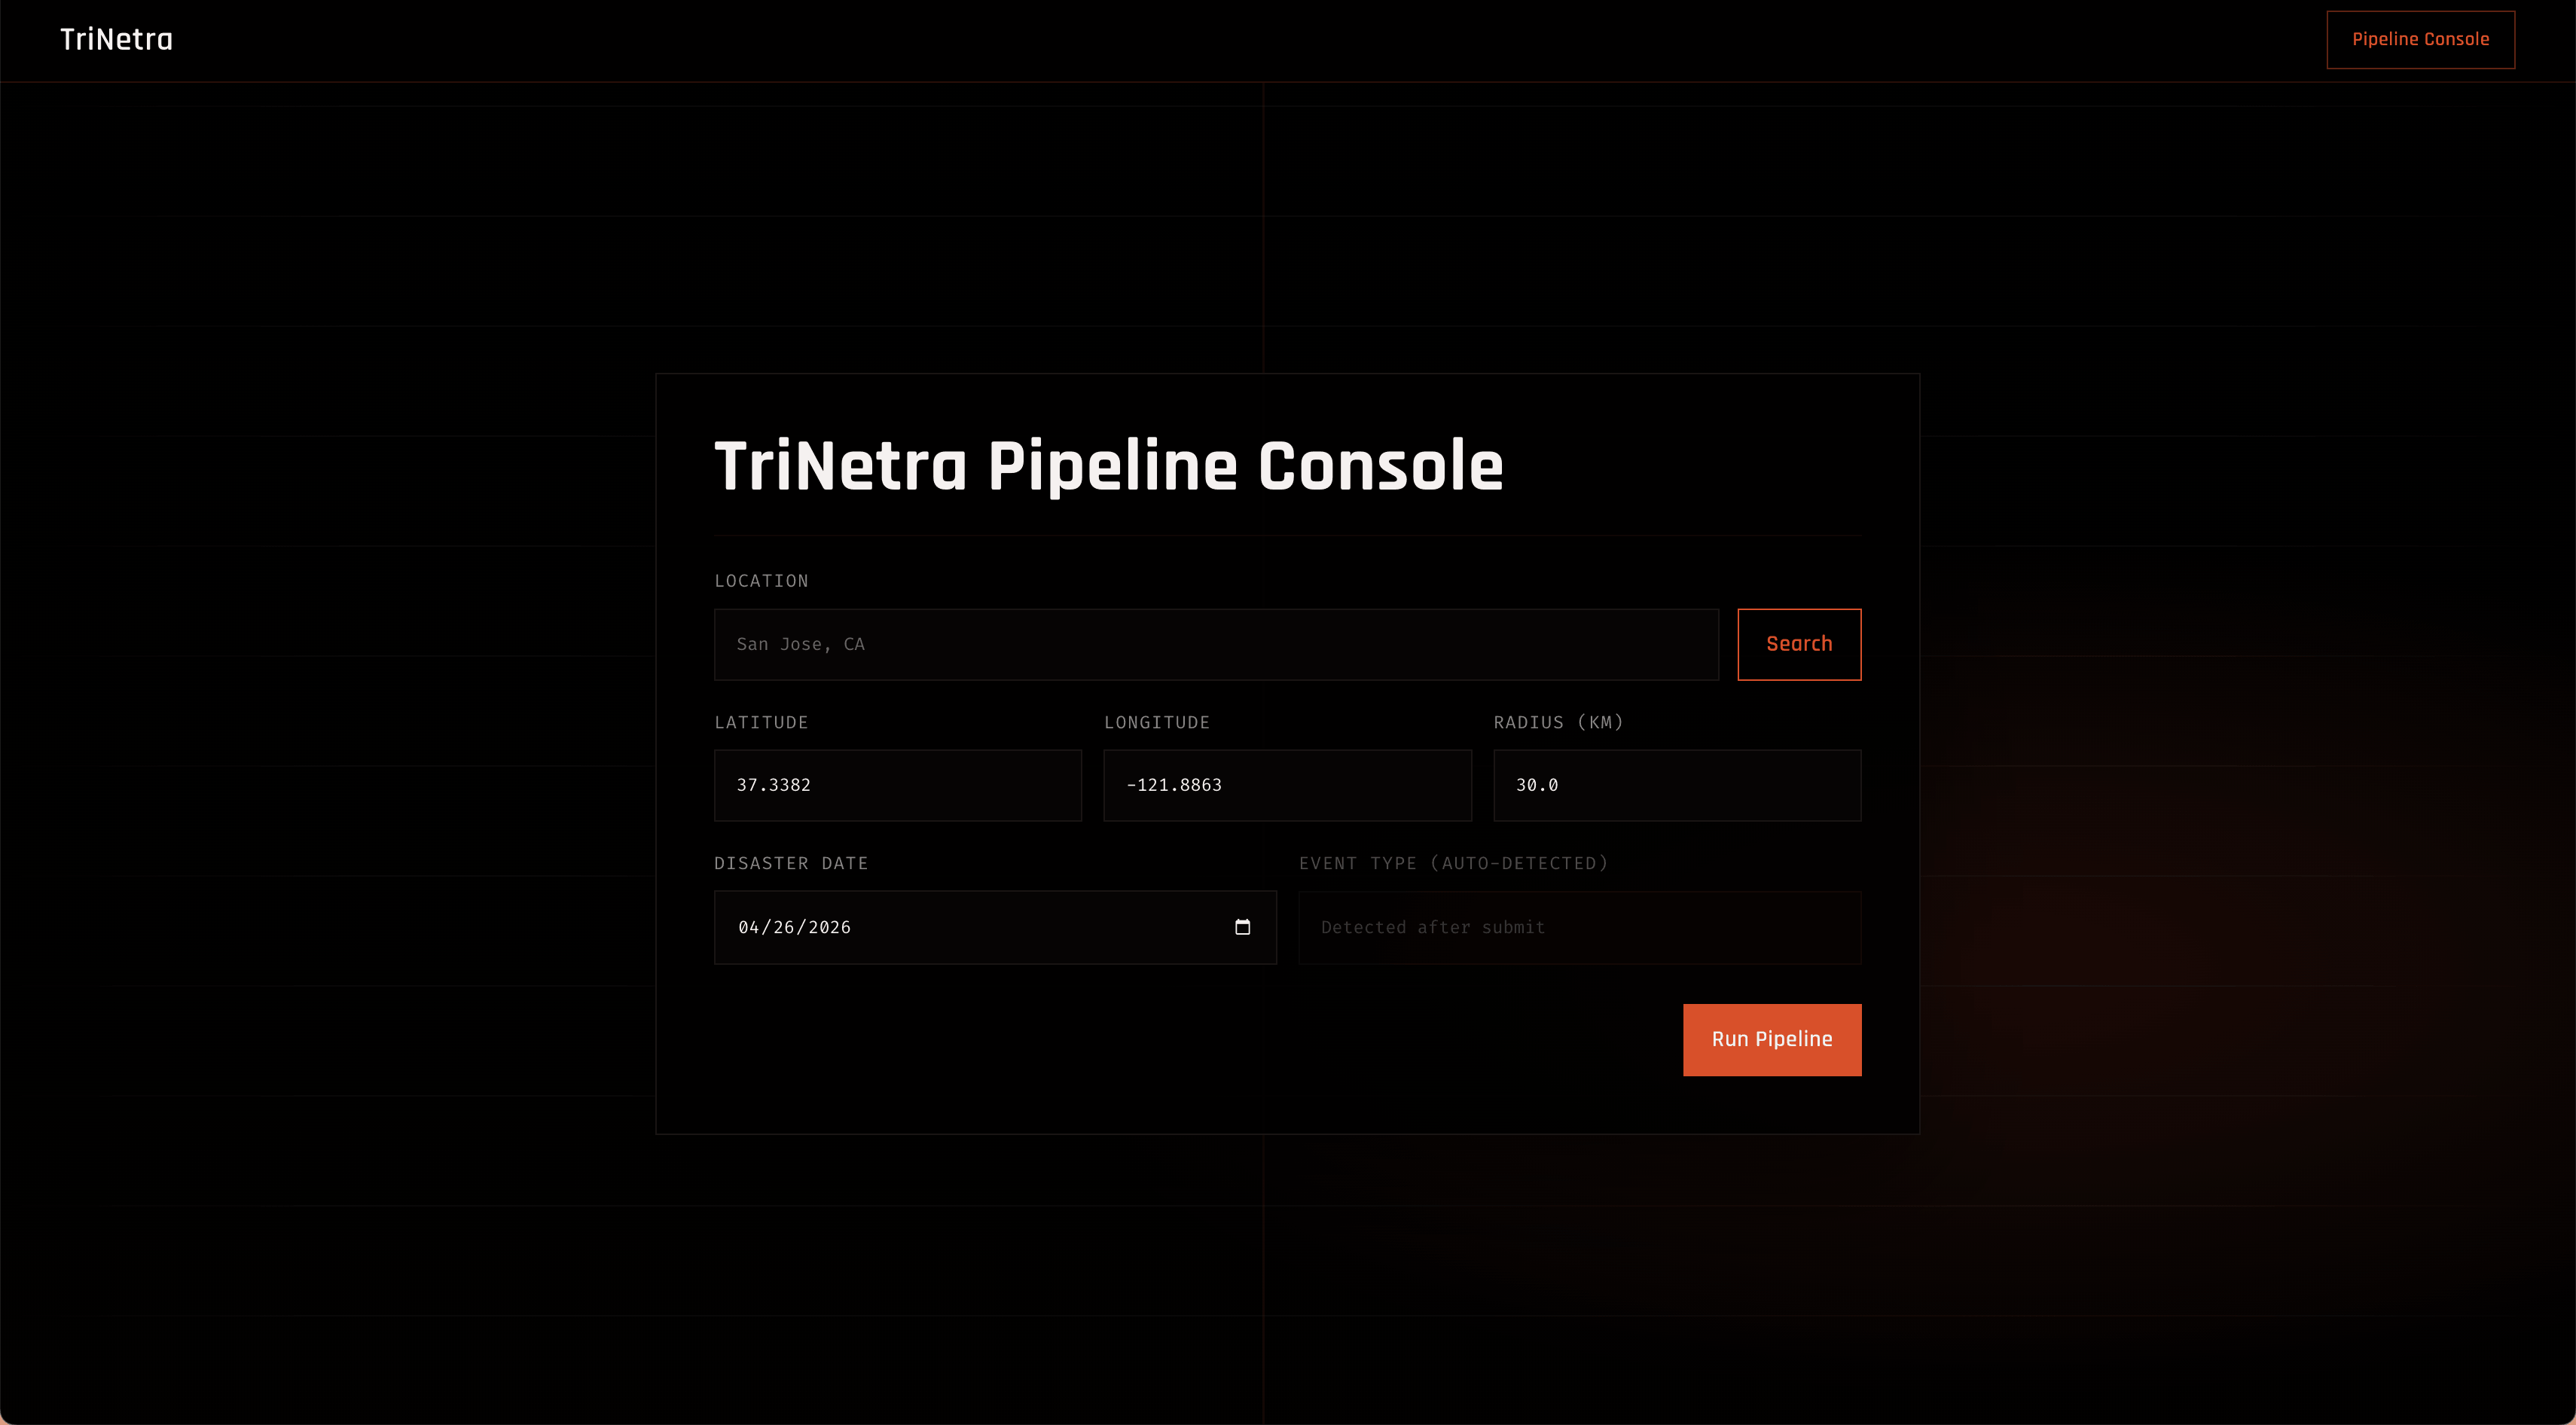
Pipeline Input Screen
https://trinetrawebsite.vercel.app/
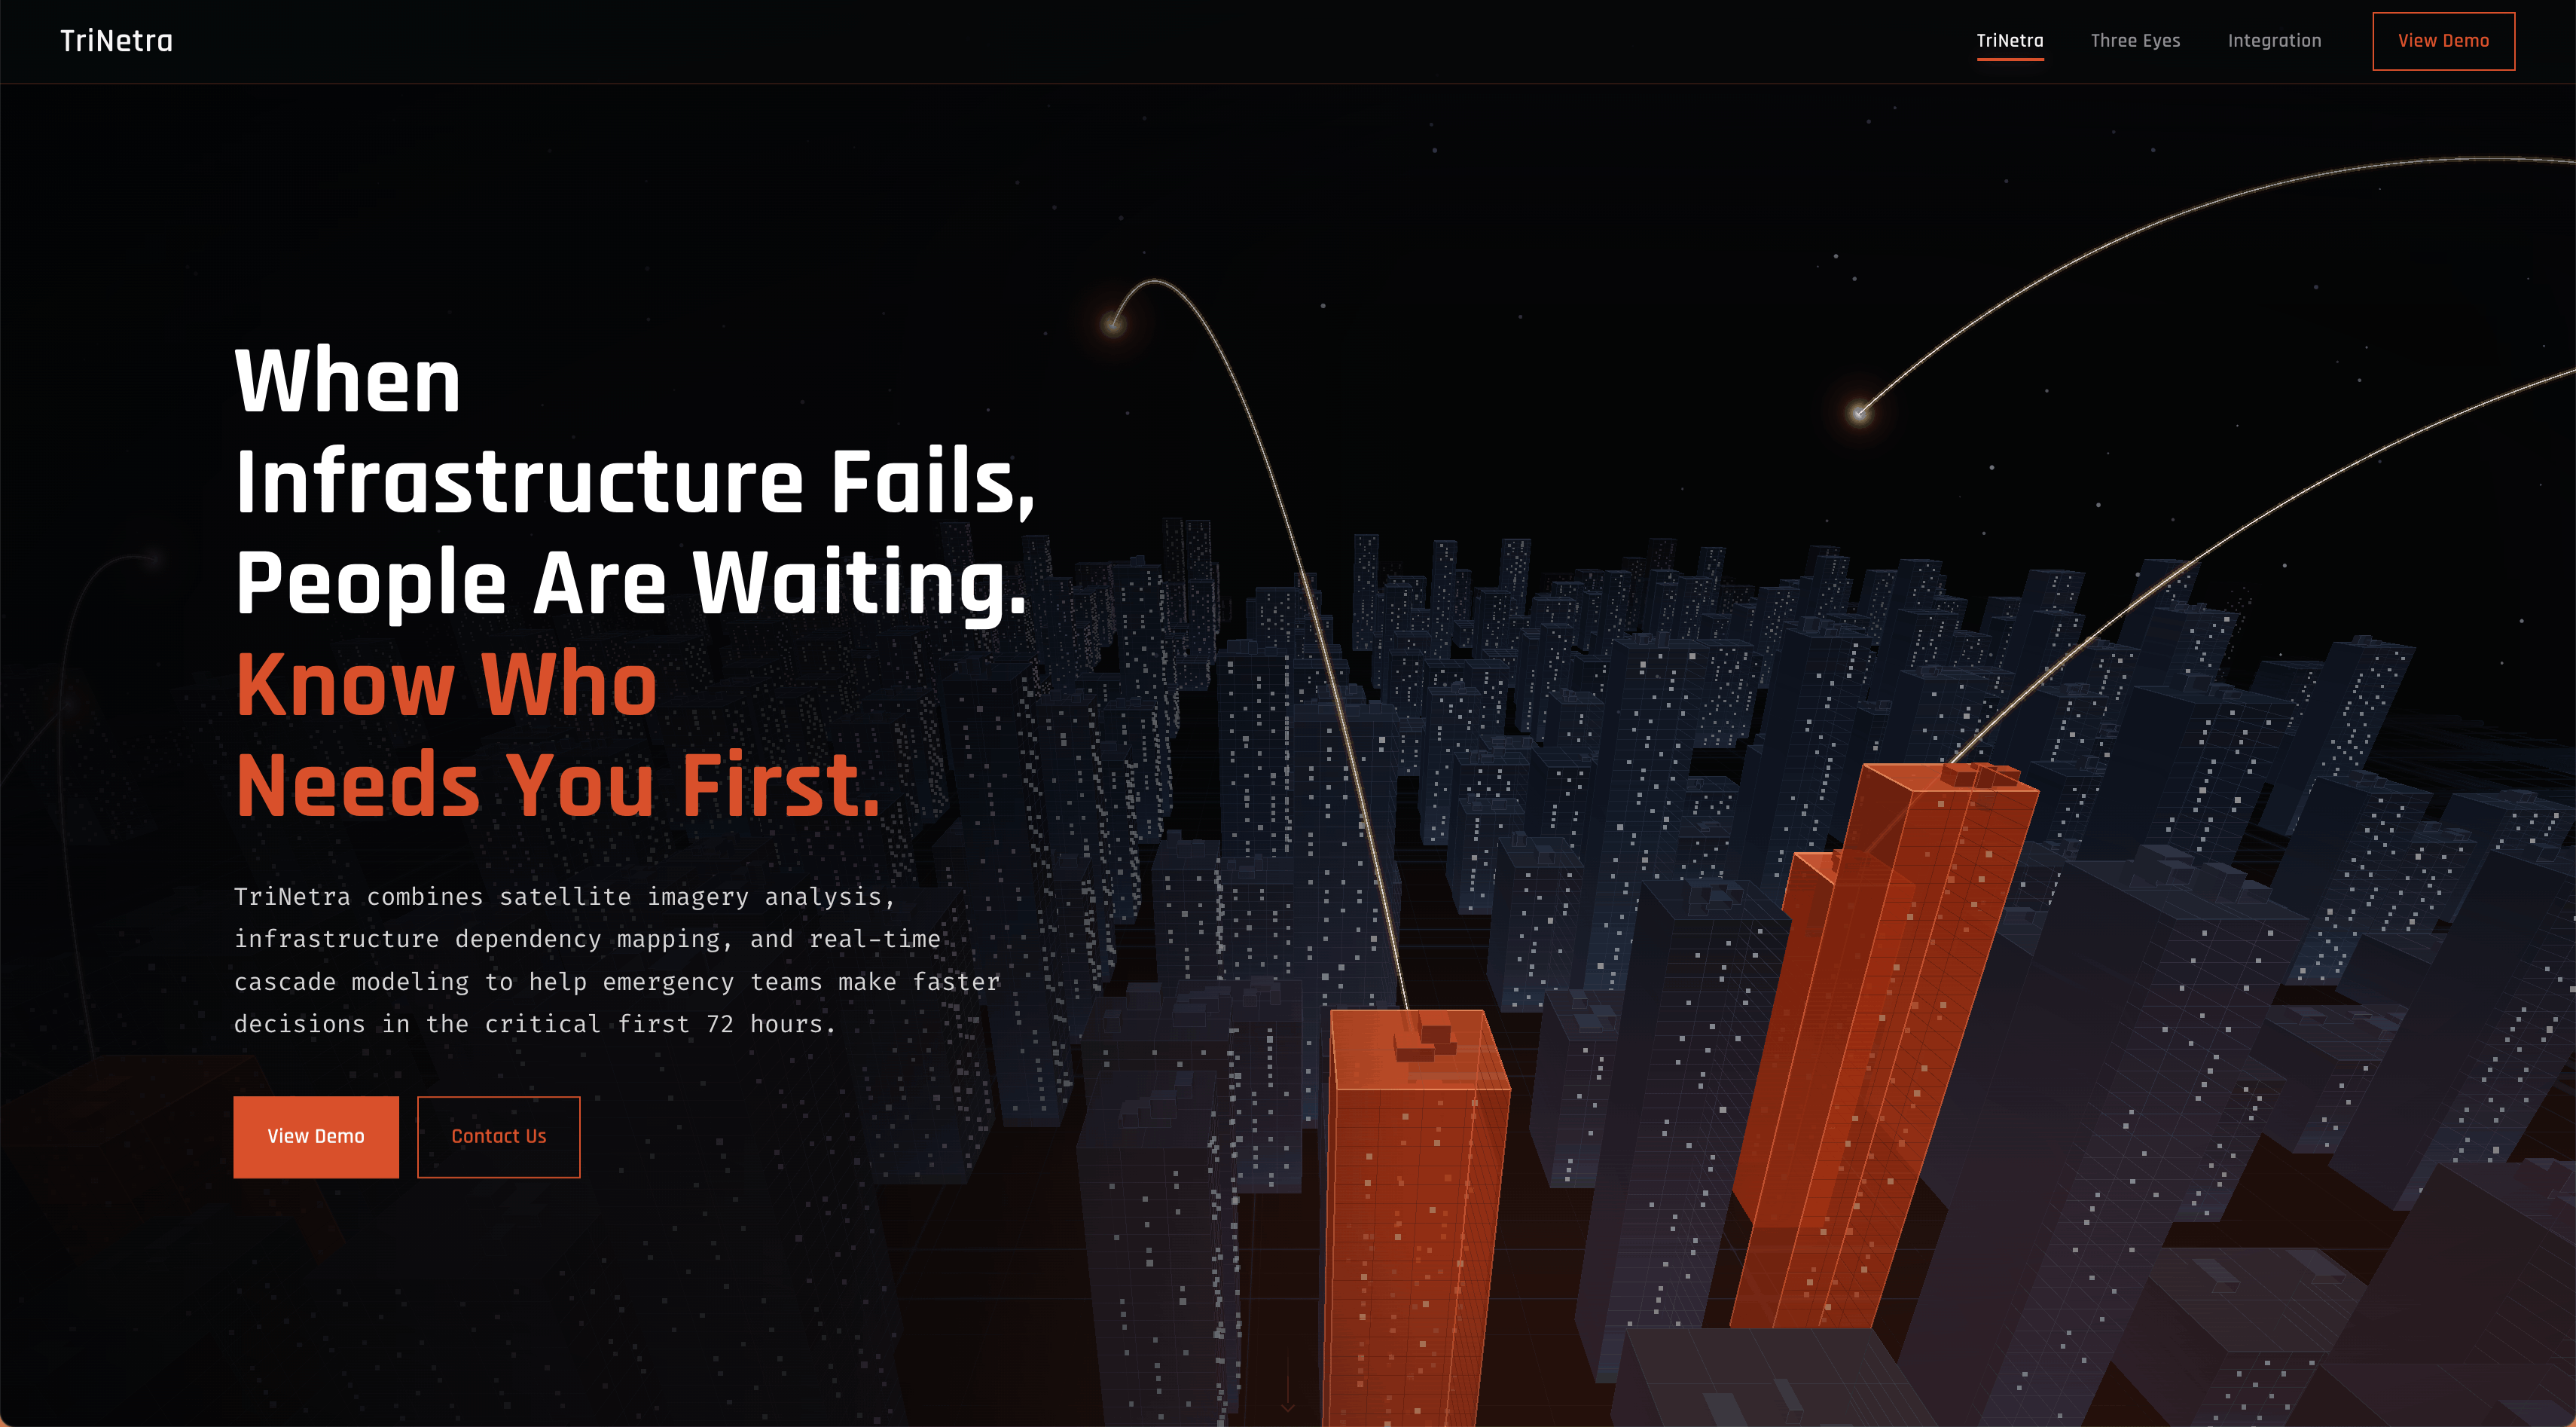
Three eyes. One intelligence. Zero blind spots in disaster response.
Inspiration
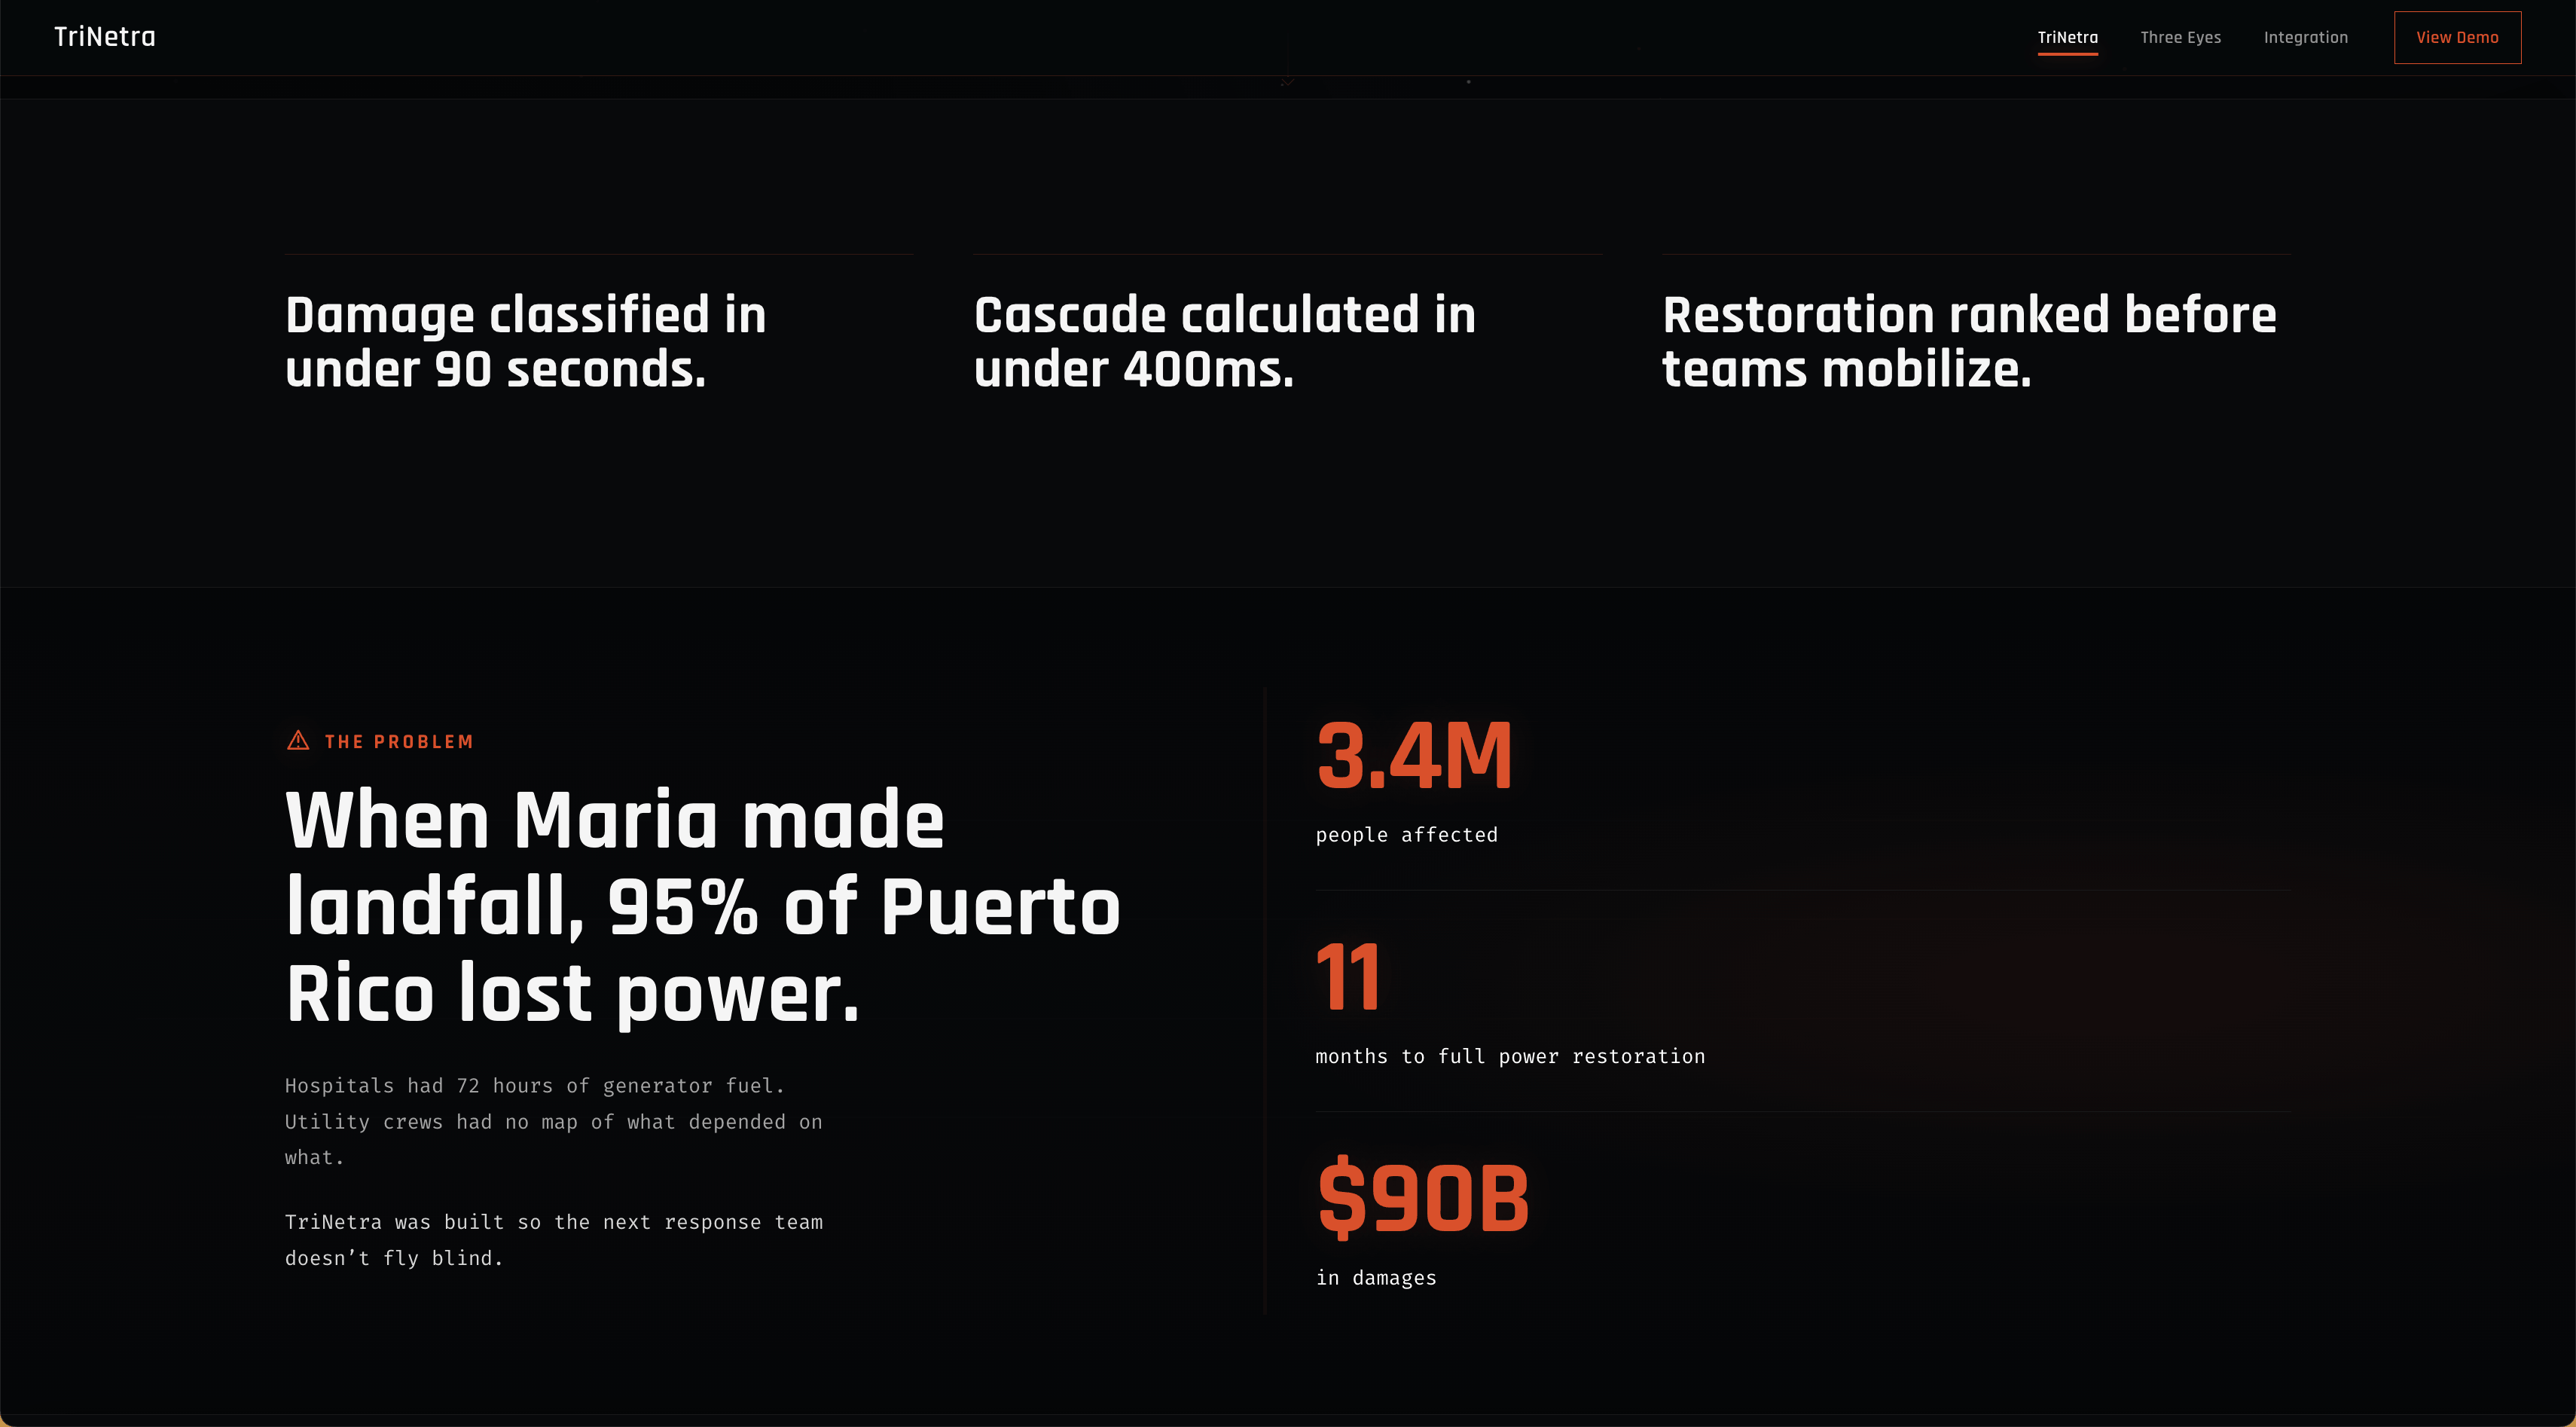
When Hurricane Maria hit Puerto Rico in 2017, hospitals failed not from wind damage but because fuel trucks couldn't reach generators through flooded roads. When the Camp Fire swept through Paradise, California, 911 call centers went dark after communication towers lost grid power. Neither failure was isolated. Each cascaded from a dependency chain that no responder could see in real time. TriNetra, Sanskrit for "three eyes," exists to make that chain visible before it completes. We built a system that watches infrastructure from three independent vantage points simultaneously and computes downstream failures before they happen.
What It Does
TriNetra takes a disaster location, a date, and a radius and returns a ranked response priority list with time-to-failure estimates for every critical infrastructure asset in the affected area. The pipeline runs in seven steps:
Event classification: Identifies the disaster type (flood, earthquake, wildfire, storm, landslide) from ground-sensor datasets Asset fetch: Pulls real infrastructure from HIFLD federal open data: hospitals, substations, water treatment plants, cell towers, fire stations, EMS stations, shelters Dependency graph: Infers which assets power, supply water to, or communicate with which others through spatial relationships Satellite imagery: Downloads NAIP or Sentinel-2 before/after image pairs for the affected area Parallel sensor fusion: All three eyes run concurrently Cascade analysis: Propagates failure up to five hops downstream through the dependency graph, scoring each affected asset by population served, criticality tier, and urgency Output: Delivers ranked priorities to the web dashboard at https://trinetra.vercel.app and to a conversational agent on Fetch.ai's Agentverse that anyone can query in plain English via ASI:One
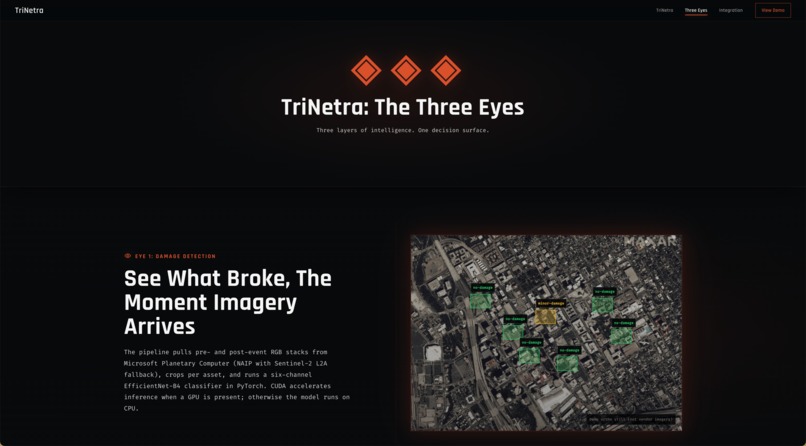
The Three Eyes
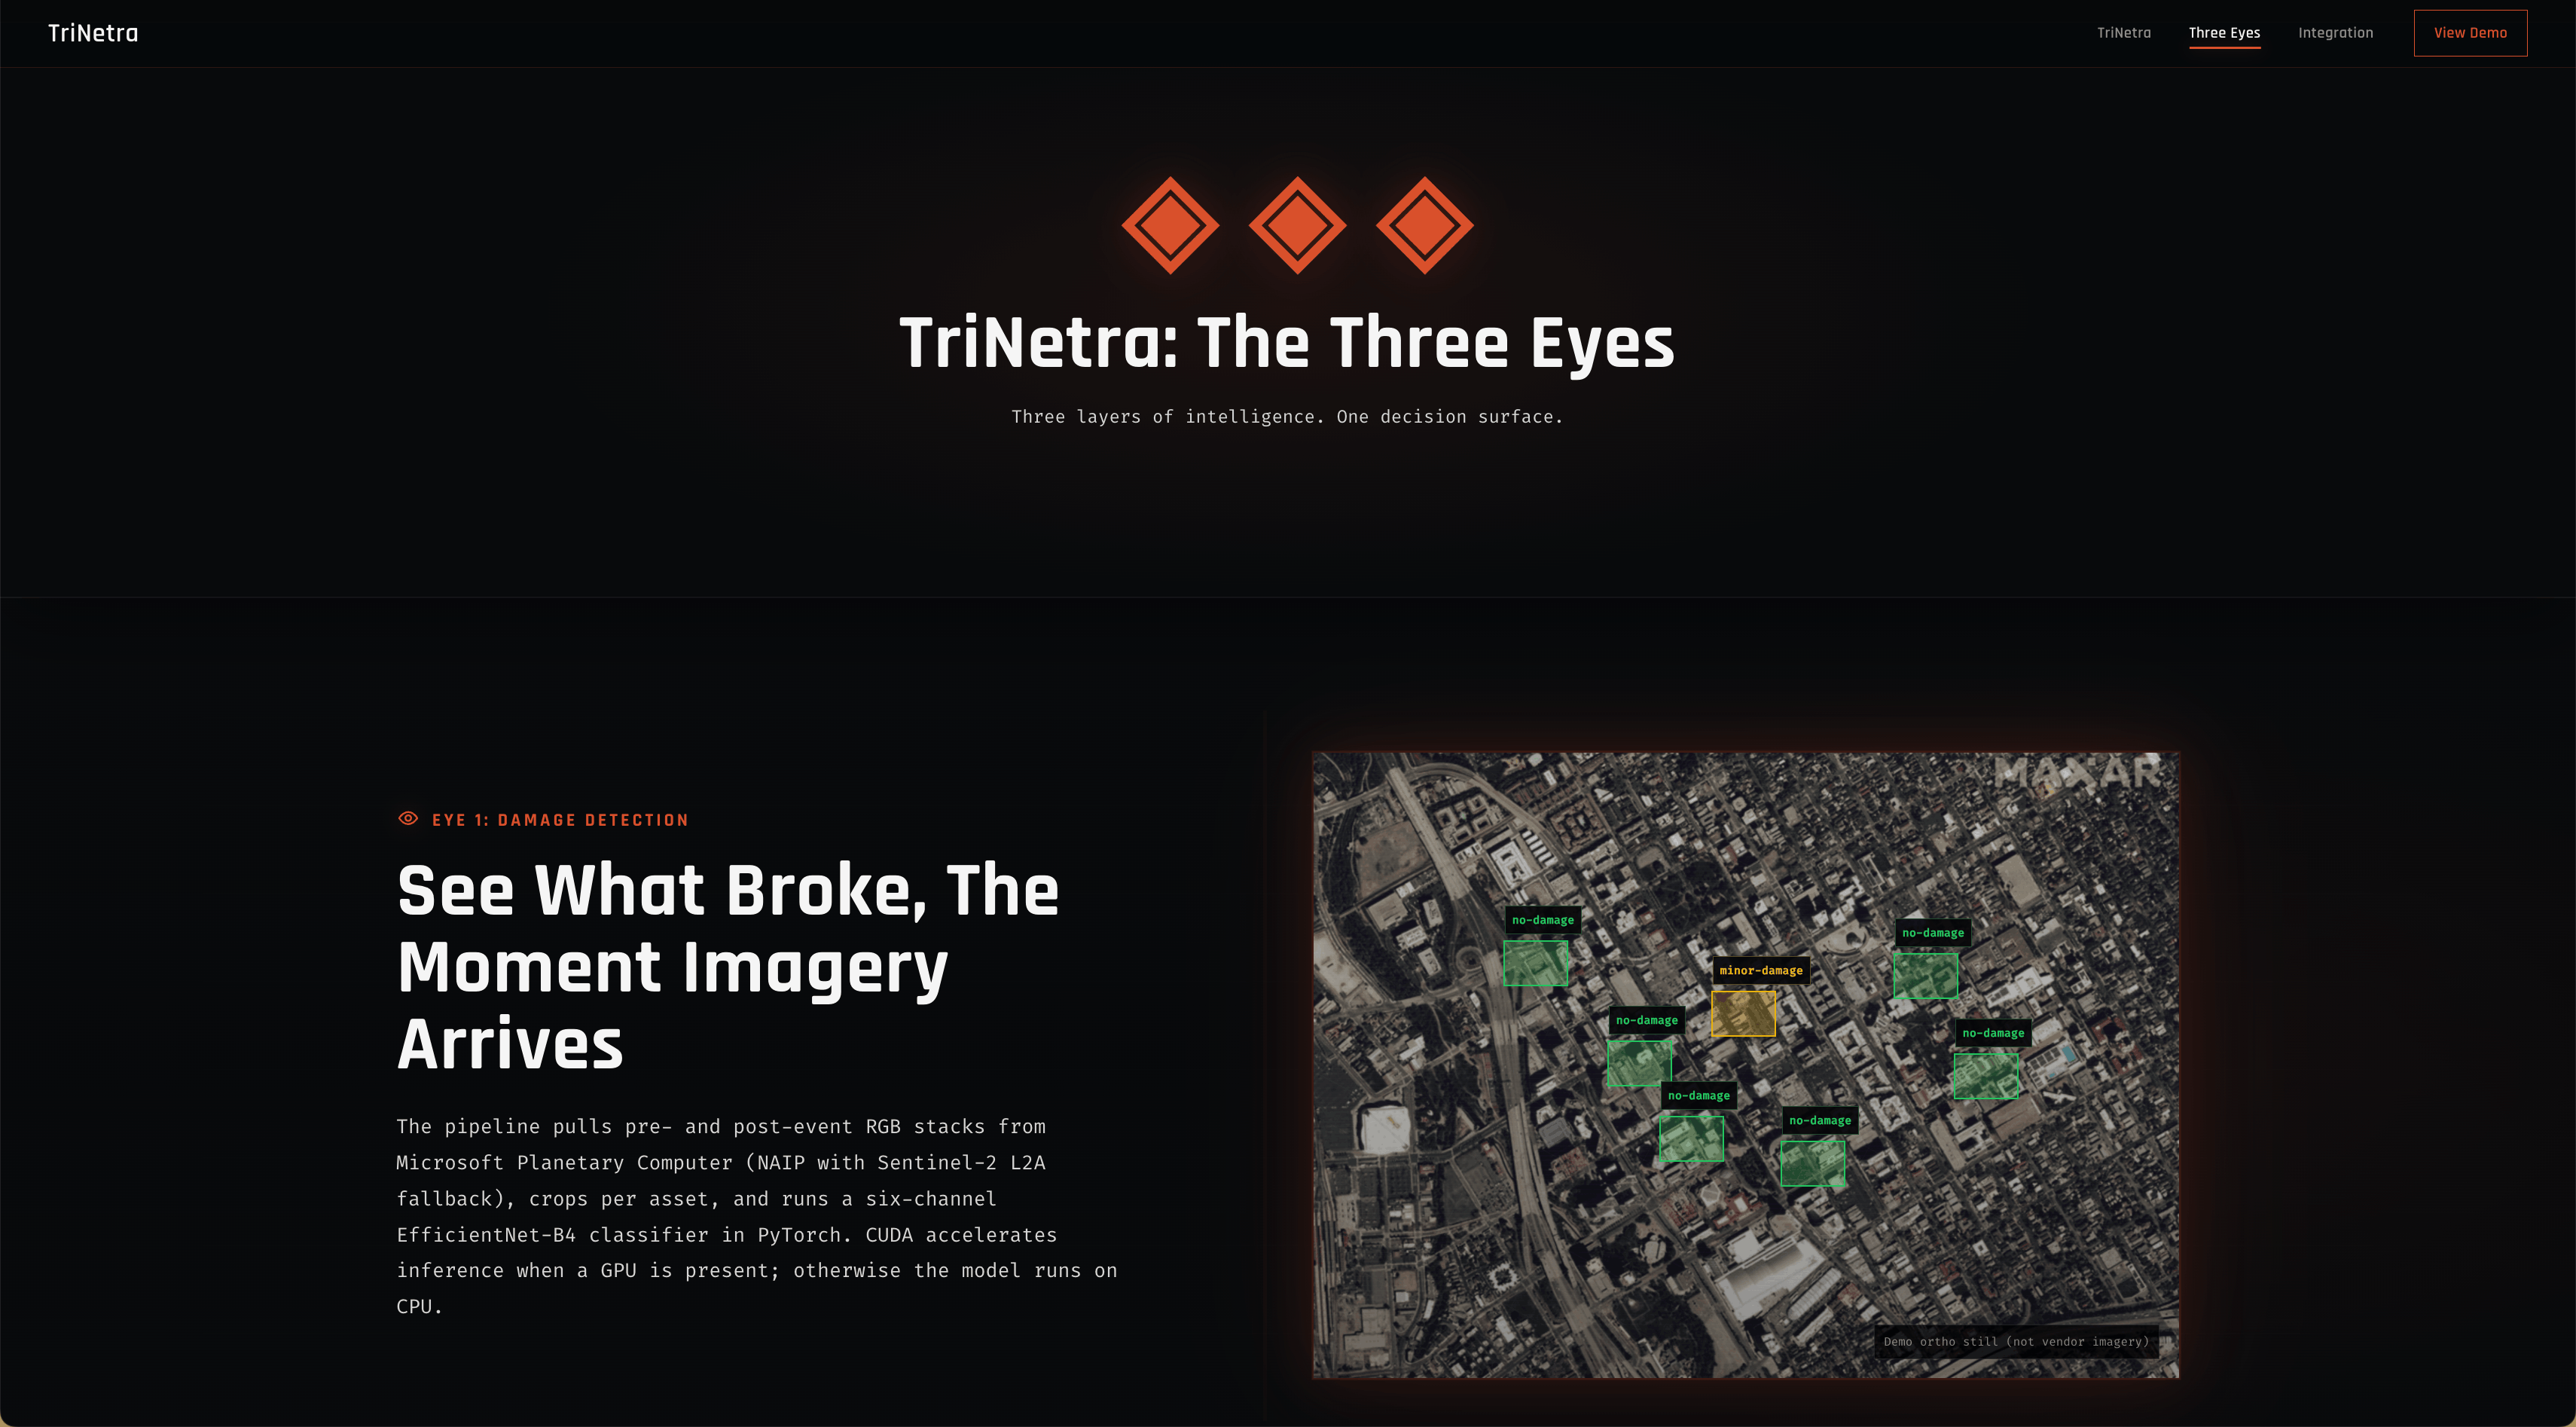
Eye 1: Satellite Damage Assessment We fine-tuned EfficientNet-B4 on the xBD building damage dataset on the ASUS Ascent GX10 supercomputer. The model takes 6-channel input, pre- and post-disaster satellite image pairs stacked channel-wise, and classifies each building chip into four damage levels: no damage, minor, major, or destroyed. Those classifications map back to HIFLD asset geometries to produce per-asset damage observations.
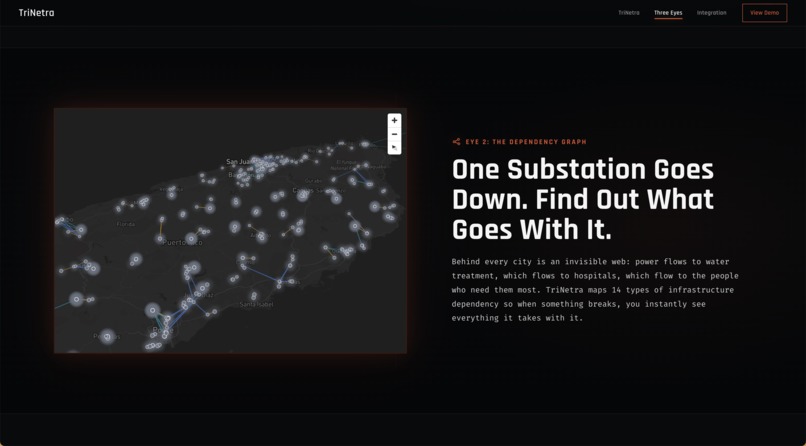
Eye 2: Infrastructure Dependency Graph Stores 617 real critical infrastructure assets for Puerto Rico in PostgreSQL with PostGIS, sourced from HIFLD federal open datasets. A graph builder infers dependency edges spatially: Voronoi service-area inference for substations and water treatment plants, distance-based heuristics for communications links. The result populates a NetworkX DiGraph in memory that the cascade engine walks.
Eye 3: Social Media Intelligence Fetches the most recent disaster-related tweets and classifies their sentiment using cardiffnlp/twitter-roberta-base-sentiment. Negative sentiment maps to major-damage signals, providing a live ground-truth verification layer when satellite imagery lags by days. Aggregation Eye 1 anchors each asset's damage estimate at weight 0.70. Eye 2 (physical ground sensor data: MMI, wind speed, flood depth) modulates at 0.20. Eye 3 (Twitter sentiment) adds noise-adjusted signal at 0.10. If an eye produces no usable data, its weight drops and the remaining weights renormalize. The blend catches borderline cases near a classification boundary that any single signal would miss.
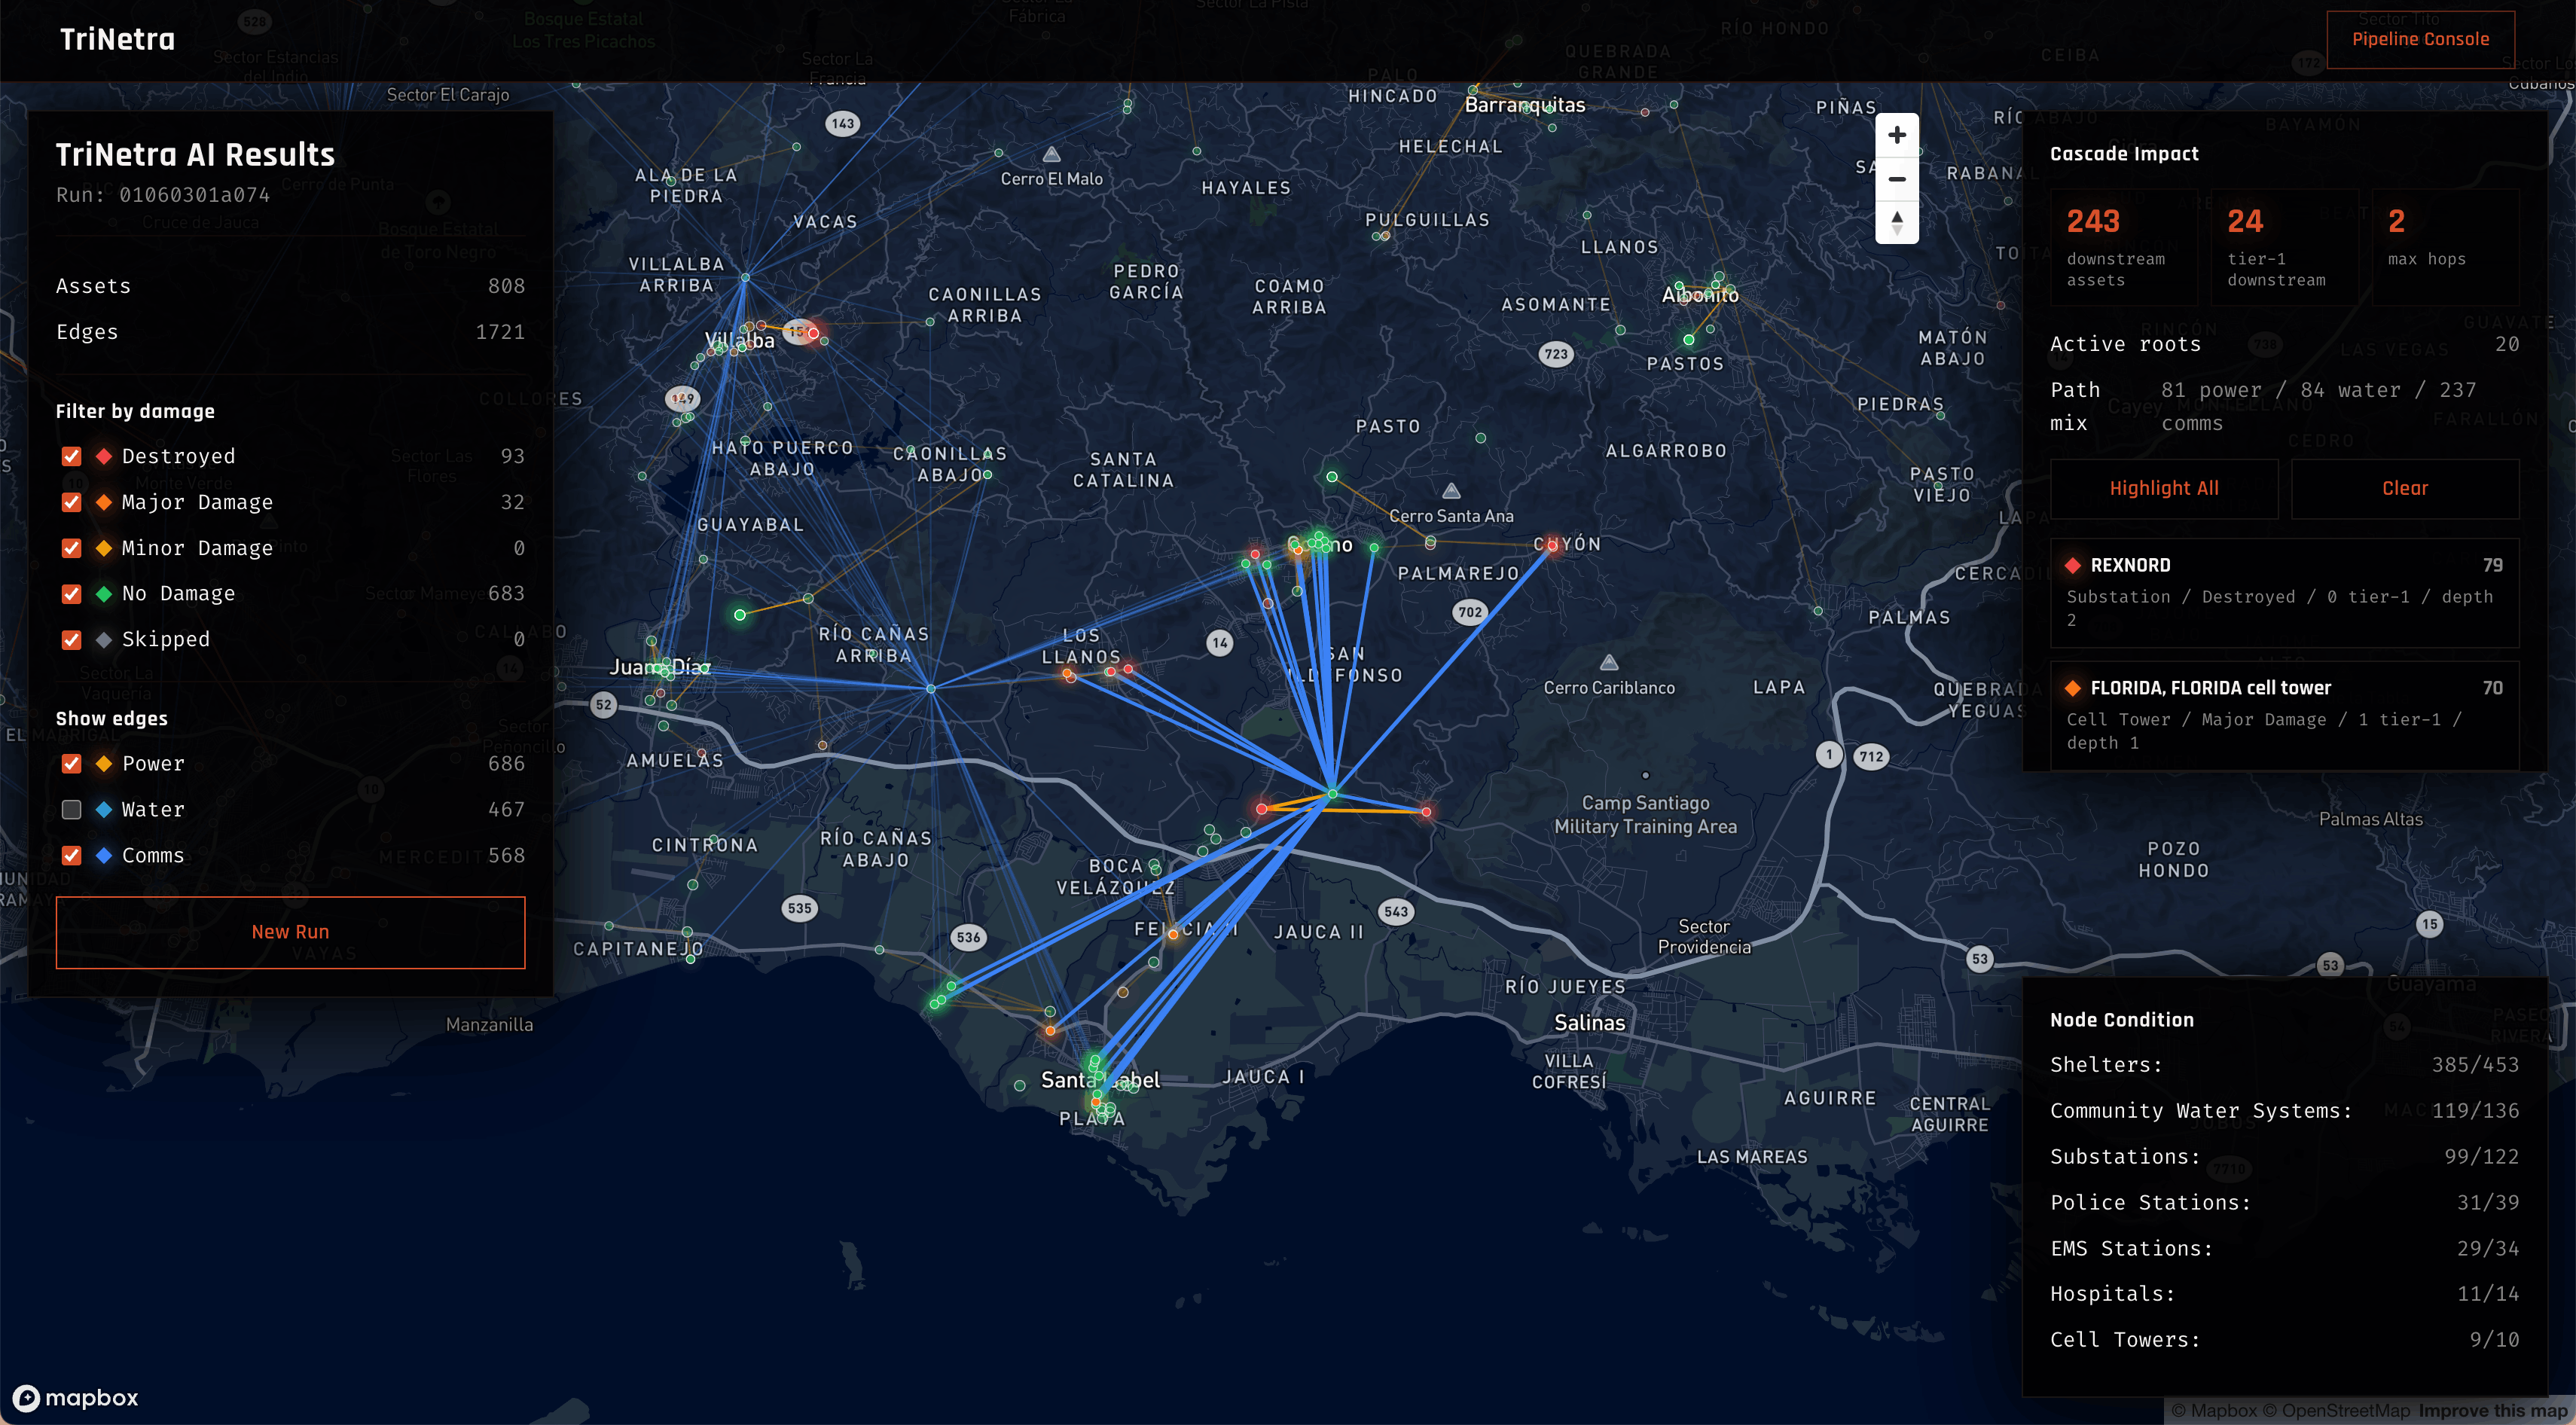
The Cascade Engine
Given a damaged root asset, the cascade engine runs BFS through the dependency graph up to five hops downstream. For each affected asset it computes:
Time-to-failure based on failover buffer times by asset type and dependency type Population impacted Criticality tier A composite priority score
The output is a ranked list of affected assets, consumed by both the live web dashboard and the Agentverse agent through the same CascadeAnalysis JSON contract.
Agentverse Multi-Agent System Four Fetch.ai uAgents coordinate every analysis on Agentverse:
@trinetraai (main orchestrator — receives queries via ASI:One Chat Protocol, dispatches to specialist agents, assembles the unified CascadeContext, and returns plain-language summaries): https://agentverse.ai/agents/details/agent1q0s8yaewr3tvznfrzv8xe0t95aqnrfrv3jjfu3hjj8mqesx6t94qu4mxhk7/profile @trinetra-eye1 (satellite damage detection specialist): https://agentverse.ai/agents/details/agent1qwngtn9jy6ktv4ltf4k0j2asm69tvjccwnrpsn7dy3aup7thxw7d5vtj5xs/profile @trinetra-eye2 (disaster heuristics specialist): https://agentverse.ai/agents/details/agent1qdd3hdhlvcxy665urxa6kqzyga8jre7jc3l05v7qtedmx69v3ueg26s2pr3/profile @trinetra-eye3 (cascade orchestration specialist): https://agentverse.ai/agents/details/agent1qwkpaz8l5t4fxlq9uncv4fk5gtnmgk87neuxdwkzygu4cze327kjjzl6cr6/profile
When a message arrives via ASI:One, the orchestrator pings all three specialists in parallel, assembles a CascadeContext from their responses, runs the cascade dispatch, and prepends a coordination banner confirming all eyes active before returning the result to the user.
How We Built It
FastAPI backs each service and the pipeline orchestrator. PostgreSQL with PostGIS stores the infrastructure graph. The whole pipeline runs async with asyncio throughout, coordinating parallel Eye tasks and streaming SSE progress events to the frontend. Pydantic v2 enforces all data contracts. NetworkX handles the in-memory cascade traversal. Eye 1's training pipeline uses PyTorch and timm. The web dashboard deploys on Vercel.
Challenges
Graceful degradation under real failure modes. Disasters break APIs. Satellite coverage lags by days. Twitter returns nothing. Every eye can drop out without stopping execution: if Eye 3 finds no tweets, the aggregator renormalizes weights silently; if Eye 2 raises an exception, the pipeline logs and proceeds on Eye 1 alone. The same resilience pattern runs in the Agentverse coordinator, the orchestrator assembles partial context and continues even if a specialist agent misses its coordination ping.
Spatial inference without wiring diagrams. No public dataset maps which substation powers which hospital. We approximated real dependency topology by combining Voronoi service-area inference for substations and water plants with distance heuristics for communications links, producing dependency edges that closely mirror actual infrastructure clustering.
Balancing per-asset vs. event-level signals. Eye 1 knows the state of one building. Eyes 2 and 3 characterize the whole event. Giving event-level eyes too much weight homogenizes all asset predictions incorrectly regardless of each asset's individual vulnerability. Getting to the right weights (0.70 / 0.20 / 0.10) required being explicit about what each signal actually represents.
Accomplishments We're Proud Of
End-to-end pipeline from disaster coordinates to cascade-ranked response priorities, built and live within the hackathon Four live Fetch.ai uAgents registered on Agentverse with real addresses, coordinating in production via ASI:One Chat Protocol 617 real HIFLD infrastructure assets loaded for Puerto Rico with spatially inferred dependency edges EfficientNet-B4 trained on the xBD dataset on ASUS Ascent GX10 hardware, serving live inferences Dashboard live at https://trinetra.vercel.app
What We Learned
The multi-agent pattern on Agentverse proved cleaner than a monolith. Each specialist knows one domain deeply, and the orchestrator assembles context from their contributions without encoding any domain logic itself. The same separation of concerns you want in microservices emerges naturally from autonomous agents with explicit message contracts. The Figma conflict also taught us something about early-stage product design. Verbal debates about priorities go in circles. Visual artifacts resolve them. Seeing four complete designs side by side on a canvas forces explicit acknowledgment of what overlaps and what doesn't in a way that abstract discussion never does. Building on real data instead of synthetic data changes the character of the problem. Every asset in our graph corresponds to something that actually exists in Puerto Rico. That grounded the cascade results in a way that made them feel meaningful rather than illustrative — and made us much more careful about edge cases in the propagation logic.
What's Next
Live FEMA and NOAA event feeds to trigger analysis automatically without manual coordinate input. Coverage expansion from Puerto Rico to the full continental US HIFLD dataset. Push notifications from the cascade engine to incident command systems when a priority threshold crosses a configured threshold. A responder feedback loop that logs confirmed and corrected cascade predictions and uses those corrections to improve dependency graph accuracy for the next event.
Sponsor Track Submissions
Sustain the Spark (Main Track) Climate change intensifies the disasters TriNetra responds to and makes infrastructure interdependencies more fragile. Flooding reaches further. Wildfires burn faster. Storms carry more energy. Each of those effects hits aging infrastructure that was designed without accounting for cascading interdependencies at scale. TriNetra directly addresses the response gap that climate-driven disasters expose: when the grid, water, and communications systems fail together rather than independently, responders need to see the full cascade, not individual asset status reports. Faster, better-targeted response means fewer assets lost to secondary failures, less waste from misdirected relief resources, and a shorter path back to the stable infrastructure that clean energy transition depends on.
Fetch.ai / Agentverse Track TriNetra runs as a four-agent system on Agentverse. The main orchestrator (@trinetraai) coordinates three specialist agents, each registered independently with their own address and deployed on the Agentverse network. Queries arrive through ASI:One Chat Protocol. The orchestrator dispatches coordination pings to @trinetra-eye1, @trinetra-eye2, and @trinetra-eye3, assembles a unified CascadeContext from their responses, and returns a natural-language cascade analysis with a coordination banner confirming which specialist agents contributed. The same cascade intelligence the dashboard surfaces through a REST API reaches any user with an ASI:One client through plain-language conversation. Agent profiles:
@trinetraai (Cascade Engine): https://agentverse.ai/agents/details/agent1q0s8yaewr3tvznfrzv8xe0t95aqnrfrv3jjfu3hjj8mqesx6t94qu4mxhk7/profile @trinetra-eye1: https://agentverse.ai/agents/details/agent1qwngtn9jy6ktv4ltf4k0j2asm69tvjccwnrpsn7dy3aup7thxw7d5vtj5xs/profile @trinetra-eye2: https://agentverse.ai/agents/details/agent1qdd3hdhlvcxy665urxa6kqzyga8jre7jc3l05v7qtedmx69v3ueg26s2pr3/profile @trinetra-eye3: https://agentverse.ai/agents/details/agent1qwkpaz8l5t4fxlq9uncv4fk5gtnmgk87neuxdwkzygu4cze327kjjzl6cr6/profile ASI Chat: https://asi1.ai/shared-chat/a8776059-8258-4237-ad38-6faa1722e9bb
ASUS Supercomputer Track Eye 1's EfficientNet-B4 sits at the compute core of TriNetra: 19 million parameters, 6-channel input processing pre- and post-disaster satellite image pairs simultaneously, trained on over 50,000 building chip pairs extracted from the xBD dataset across hurricane, wildfire, flood, and earthquake disaster scenarios. We built and trained this model on the ASUS Ascent GX10 — the ultra-small AI supercomputer powered by the NVIDIA GB10 Grace Blackwell Superchip. The GX10 gave us real-time, low-latency inference without routing anything through the cloud, which matters directly for the disaster response use case: in a grid-degraded environment, a system that can run locally rather than depending on cloud egress is a system that still works when it needs to most. On ASUS hardware, the training job that would have stretched across consumer GPU nights completed in hours. That speed let us experiment during the hackathon rather than waiting on a single fixed run — we tested different dropout rates, input normalization schemes, and class weighting strategies across multiple passes. The resulting best_model.pth backs every satellite damage inference in the live pipeline and demonstrates the kind of rapid ML iteration that only becomes possible with access to serious compute. The GX10's on-device inference capability also means TriNetra's most compute-intensive component runs without cloud dependency — exactly the kind of resilient, edge-capable architecture ASUS and NVIDIA designed the platform for.
Arista Networks Track: Connect the Dots Arista's challenge asks for software that connects people to resources or routes useful data to solve a real problem in daily life. TriNetra does exactly that, but for the highest-stakes version of "daily life": the hours immediately after a major disaster. The core routing problem in disaster response is information, not trucks. First responders, community coordinators, and ordinary residents all have the same question in the first hours of a crisis: what broke, what's about to break, and where do I go? That information exists in satellite feeds, infrastructure databases, and social media, but it never reaches the people who need it in a form they can act on. TriNetra routes that data to three different audiences simultaneously. Emergency managers get the full cascade analysis through the ops dashboard, ranked asset failures, time-to-failure estimates, population impact scores. Community coordinators query the Agentverse agent through ASI:One in plain language: "Which hospitals near me are at risk?" "Are the cell towers in my neighborhood going to lose power?" A family deciding whether to evacuate or shelter in place gets an actual answer, not a press release. The innovation in TriNetra's approach is the dependency graph at its core, it doesn't just report that Asset A failed, it traces the route from A to every downstream asset that depends on it, across power, water, and communications networks simultaneously. That's the "connect the dots" insight applied to physical infrastructure: the graph makes invisible dependencies visible and routes urgency signals to the people and systems that need them. The result is a platform that networks three different sensing layers, routes their combined signal through a cascade engine, and delivers it to multiple audiences, technical operators, community coordinators, and the general public, each through an interface built for how they actually work.
Our Figma Story
We nearly shipped four different products. Ishaan wanted a clean command-line interface targeting technical responders who would find a dashboard noisy. Adam had already wireframed a full ops dashboard with asset filters, damage heatmaps, and a timeline scrubber. Hans pushed for a map-first topology view where the infrastructure graph itself served as the primary visualization, with any analysis secondary. Brian argued we were optimizing for the wrong user entirely and wanted a mobile-first card-based layout that a community coordinator, not a GIS analyst, could navigate during a crisis. Six hours in, nobody had ceded ground. We each dropped our full vision into a shared Figma file on the same canvas: Ishaan's sparse query view, Adam's full ops layout, Hans's graph topology, Brian's community card design. Then we annotated what we actually agreed on. The overlap appeared immediately. Everyone wanted the cascade result front and center. Everyone accepted the map as a drill-down layer rather than the primary view. Everyone saw that the Agentverse conversational agent already handled Brian's community-coordinator use case without forcing it onto the dashboard. The final design took Adam's structural skeleton, incorporated Hans's dependency graph as an interactive detail layer within the asset view, kept Ishaan's emphasis on scannable data tables for responders working under pressure, and shipped Brian's use case through the Agentverse interface. We used Figma Make at multiple points in that process: to mock up competing layouts before writing a line of code, to pitch each vision to the rest of the team at 2am, and to make the reconciliation concrete by overlaying all four frames on a single shared board. The design conflict produced a better product than any single vision would have, and Figma Make is the reason we could run that process in an hour rather than losing half the hackathon to it. Without Figma, the "three eyes" would be blind.
Important Links: Main repo: https://github.com/banksaj27/trinetra Website repo: https://github.com/banksaj27/trinetra_website Demo video: https://youtu.be/R6Yv8kgSrUU
Built With
- agentverse
- ascent
- asi:one
- asus
- asyncpg
- blackwell
- data
- dataset
- efficientnet-b4
- fastapi
- fetch.ai
- figma
- gb10
- grace
- gx10
- hifld
- huggingface
- naip
- networkx
- next.js
- nvidia
- open
- postgis
- postgresql
- pydantic
- python
- pytorch
- sentinel-2
- sqlalchemy
- timm
- transformers
- twitter-roberta-base-sentiment
- uagents
- v2
- vercel
- xbd


Log in or sign up for Devpost to join the conversation.