-
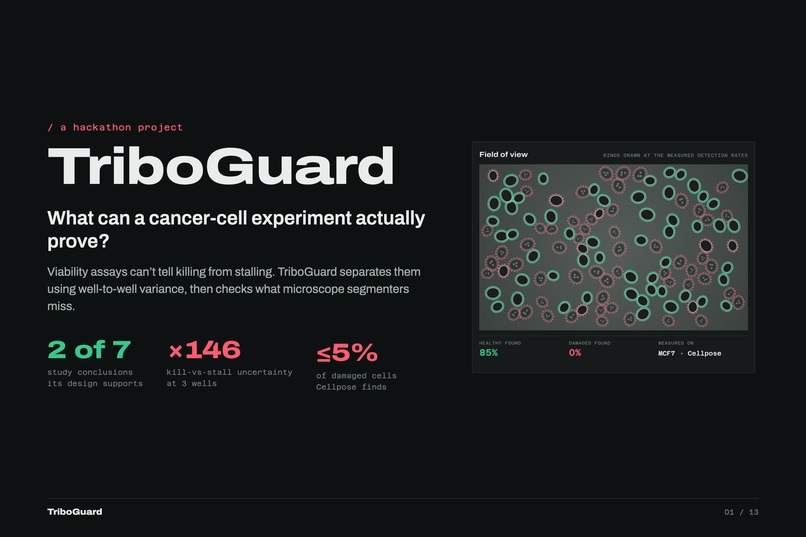
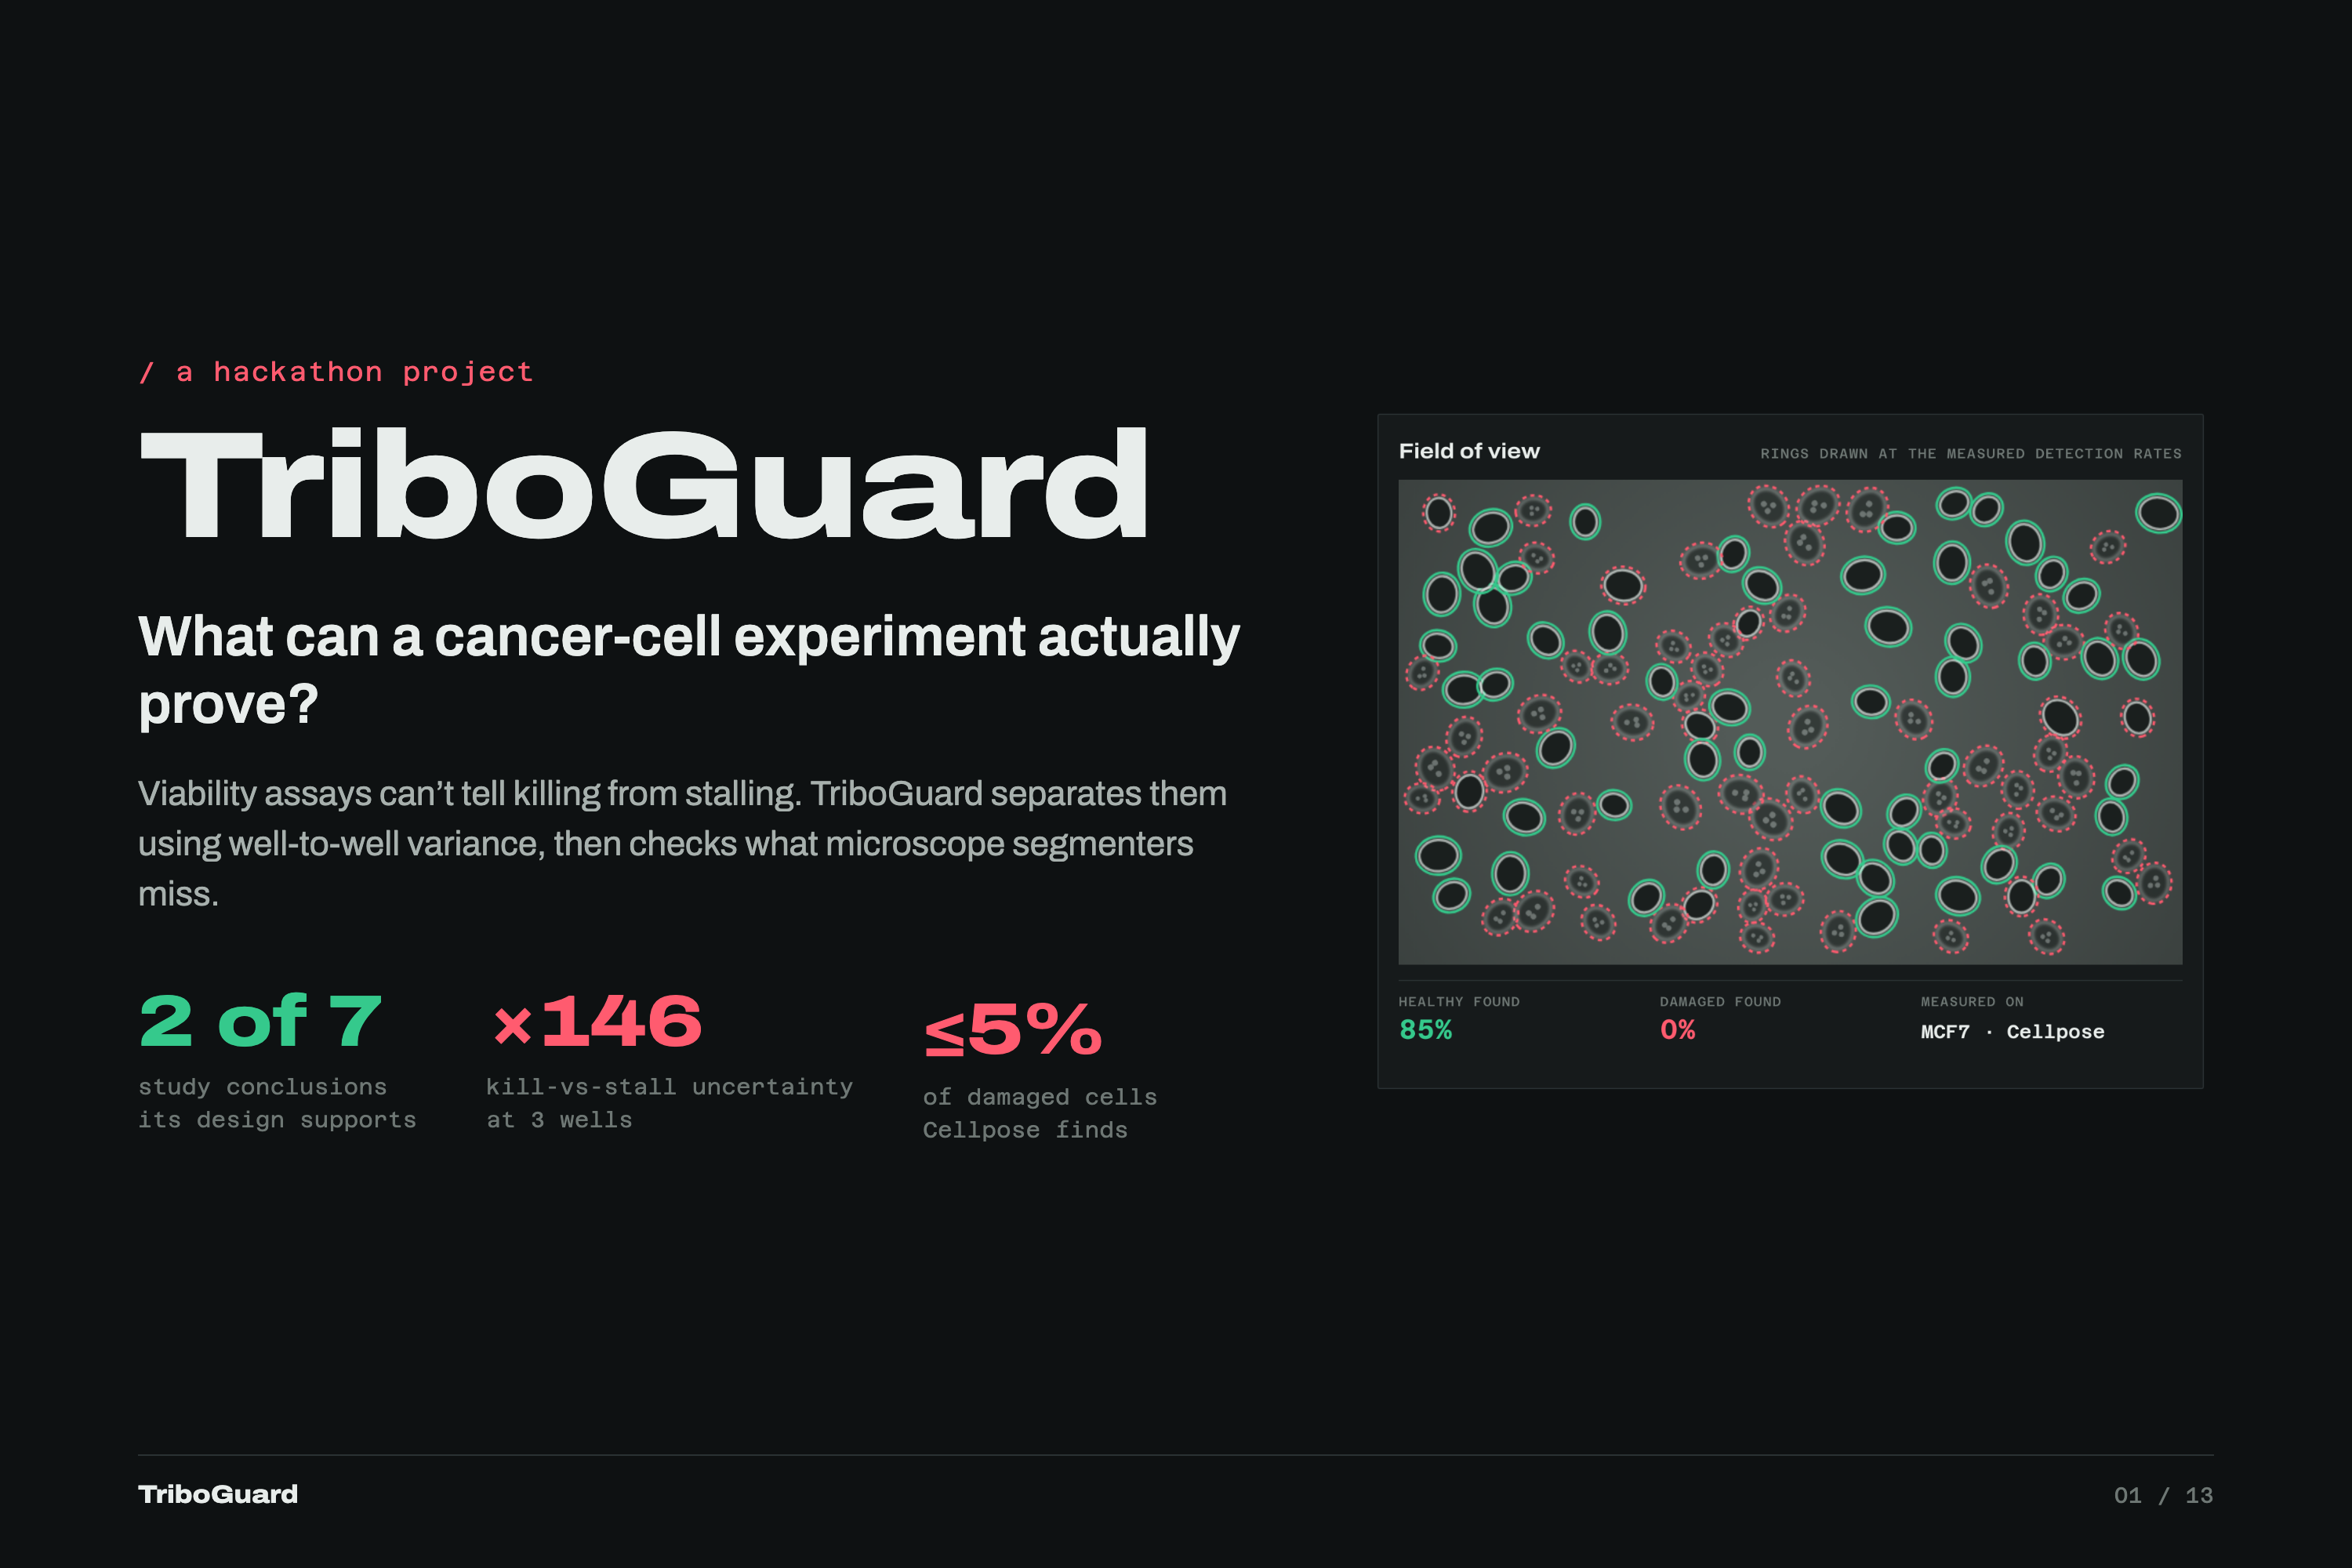
TriboGuard asks what a cancer-cell experiment can prove: it separates killing from stalling and checks what microscope software misses.
-
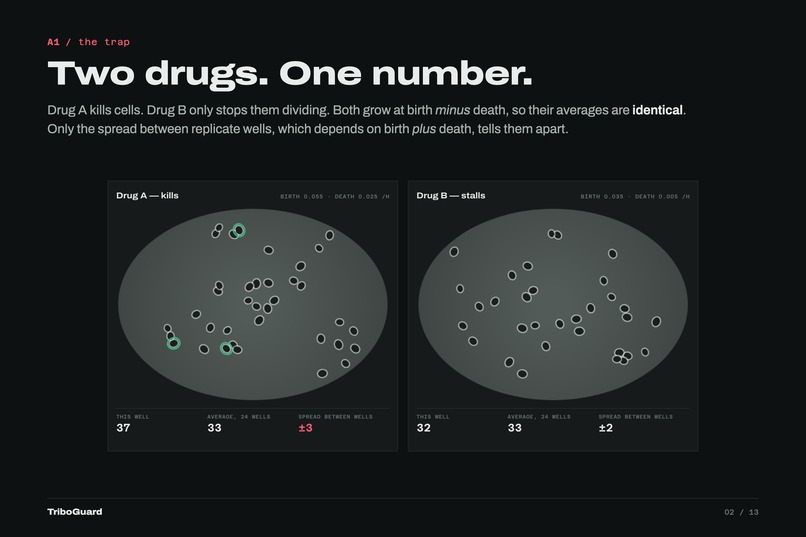
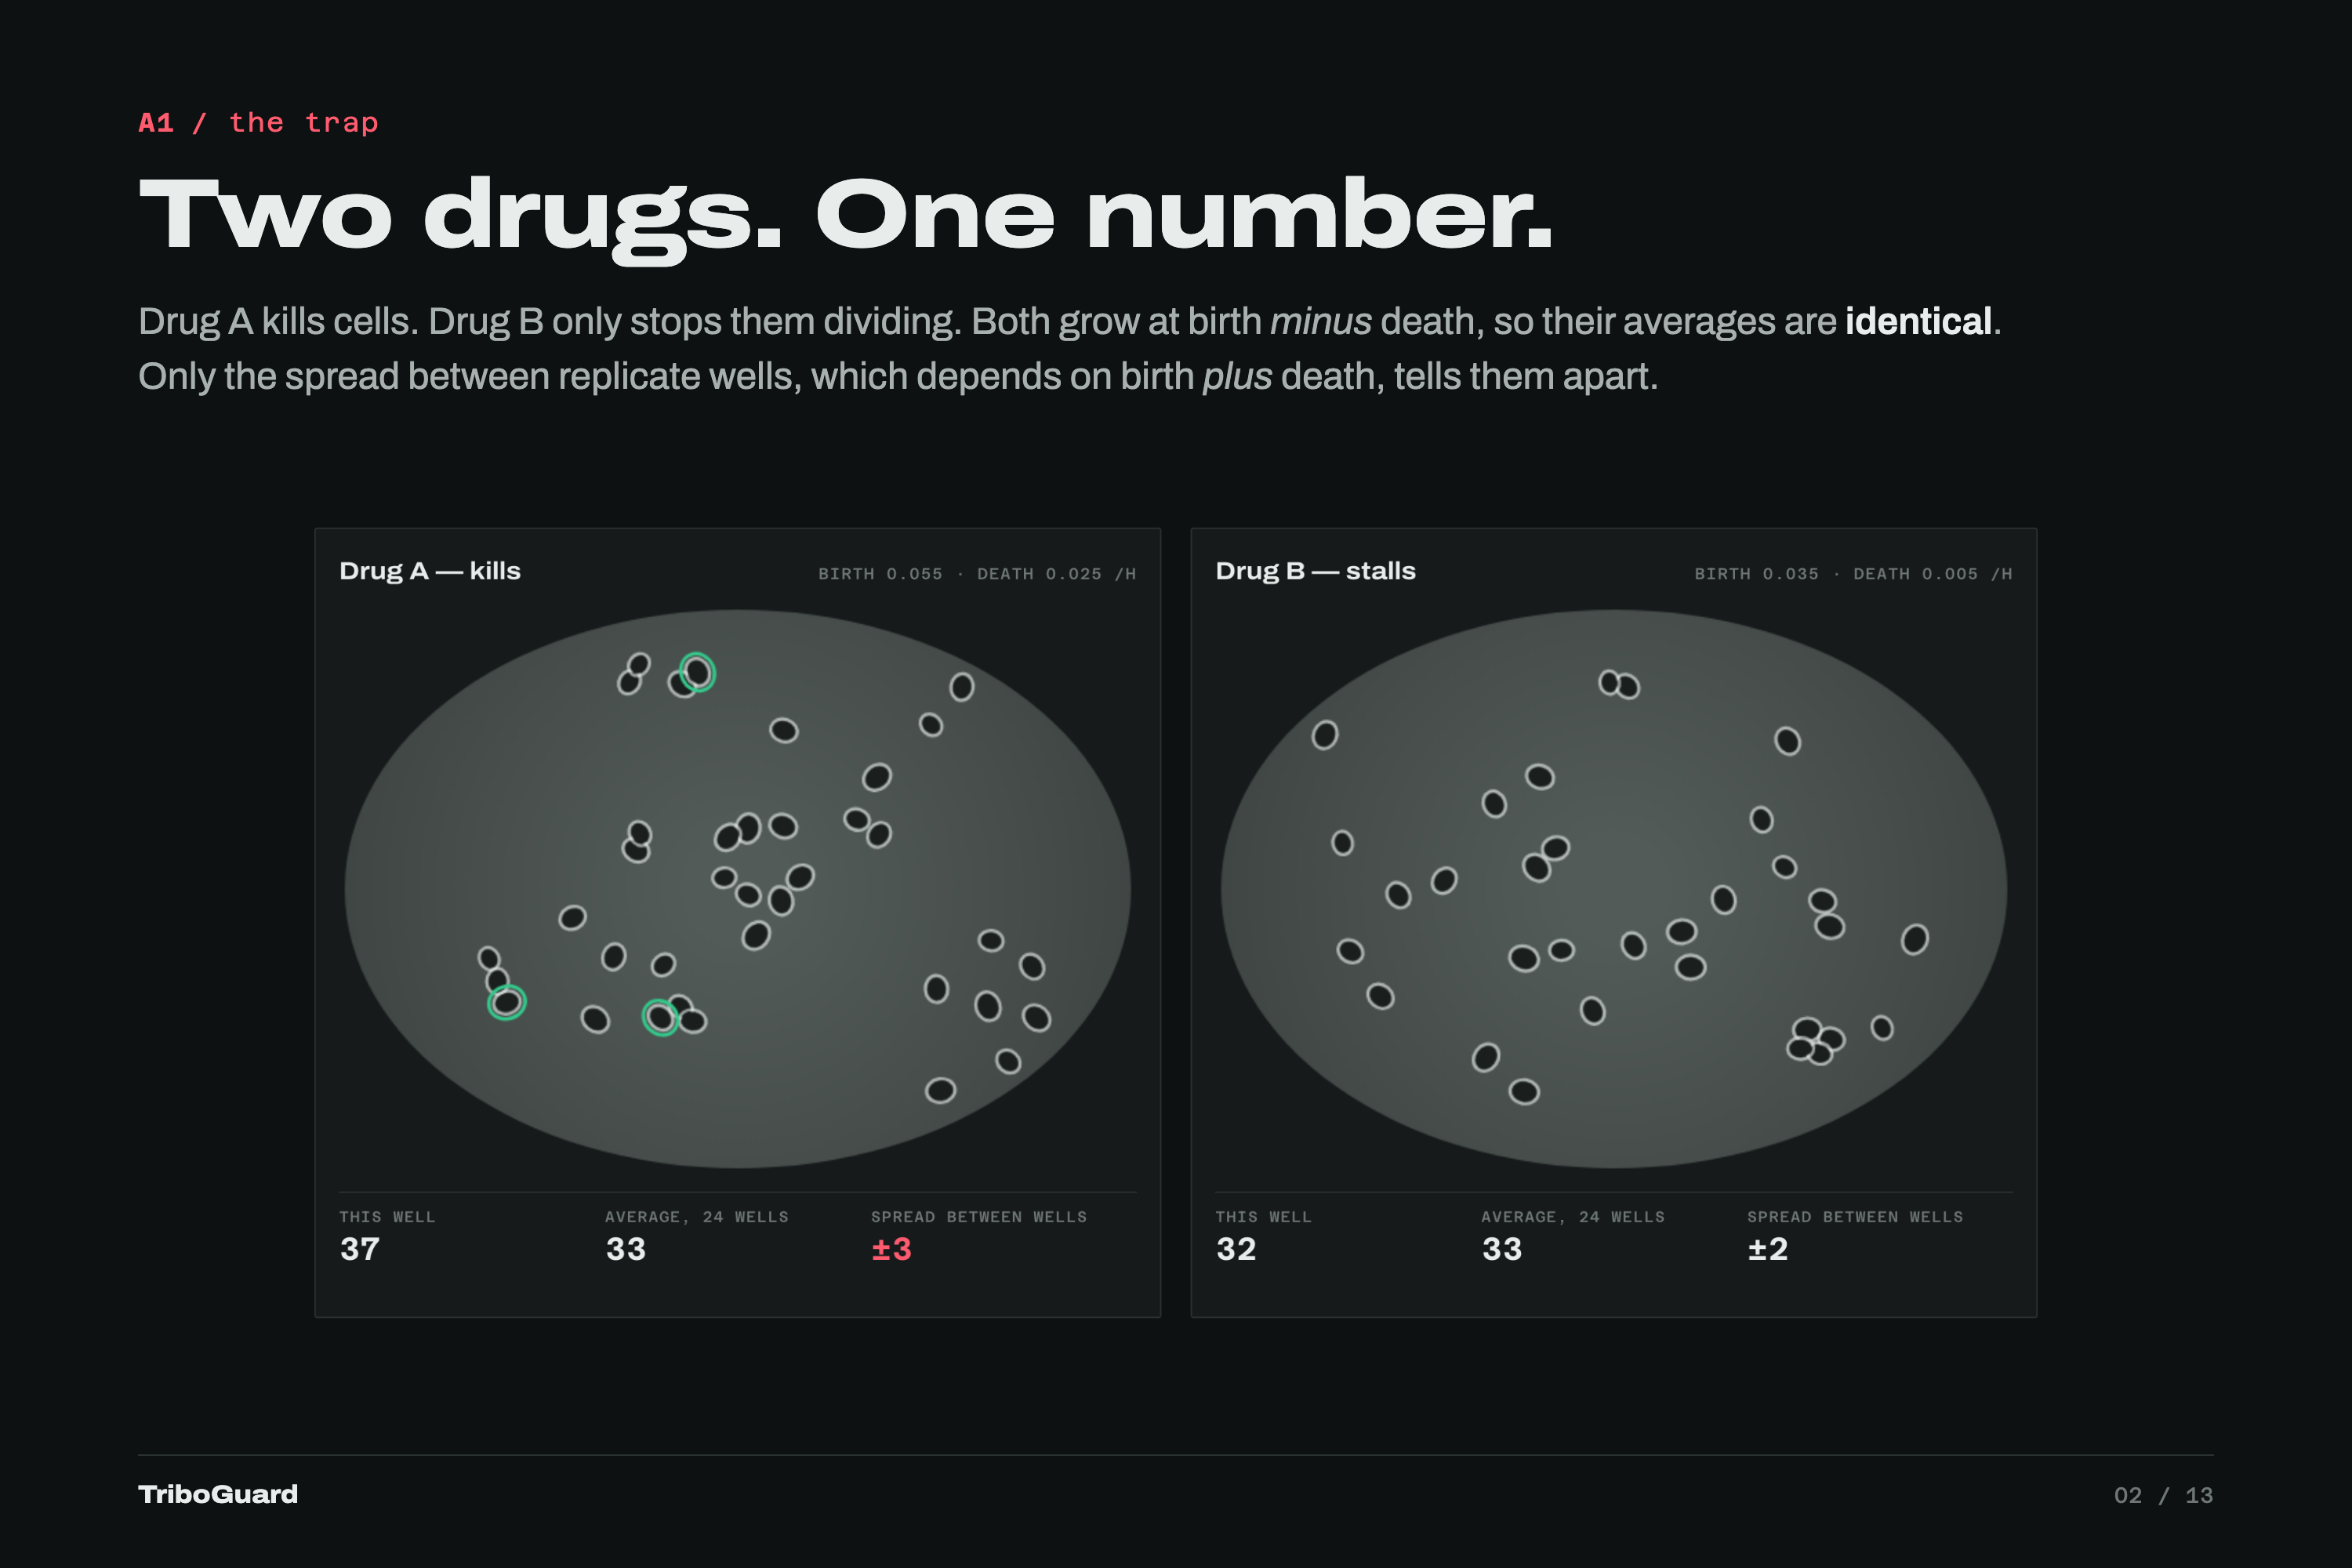
A drug that kills and one that only stops division can grow at the same average rate. Only the spread between replicate wells differs.
-
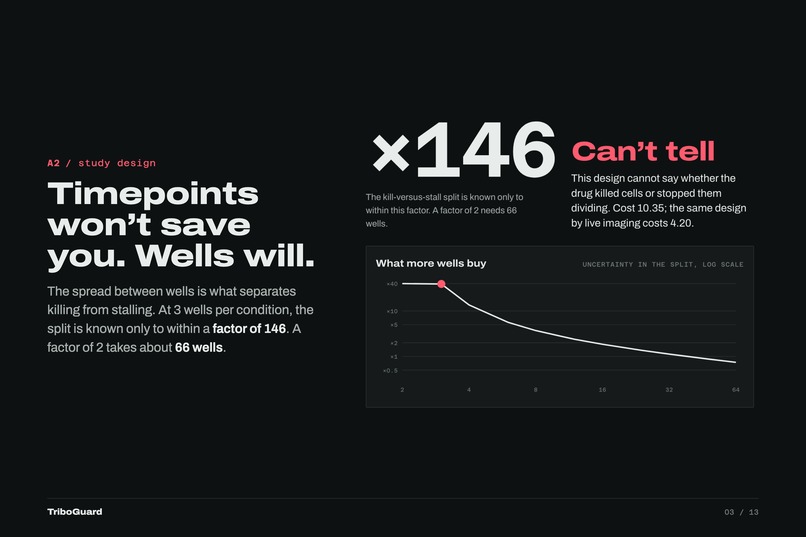
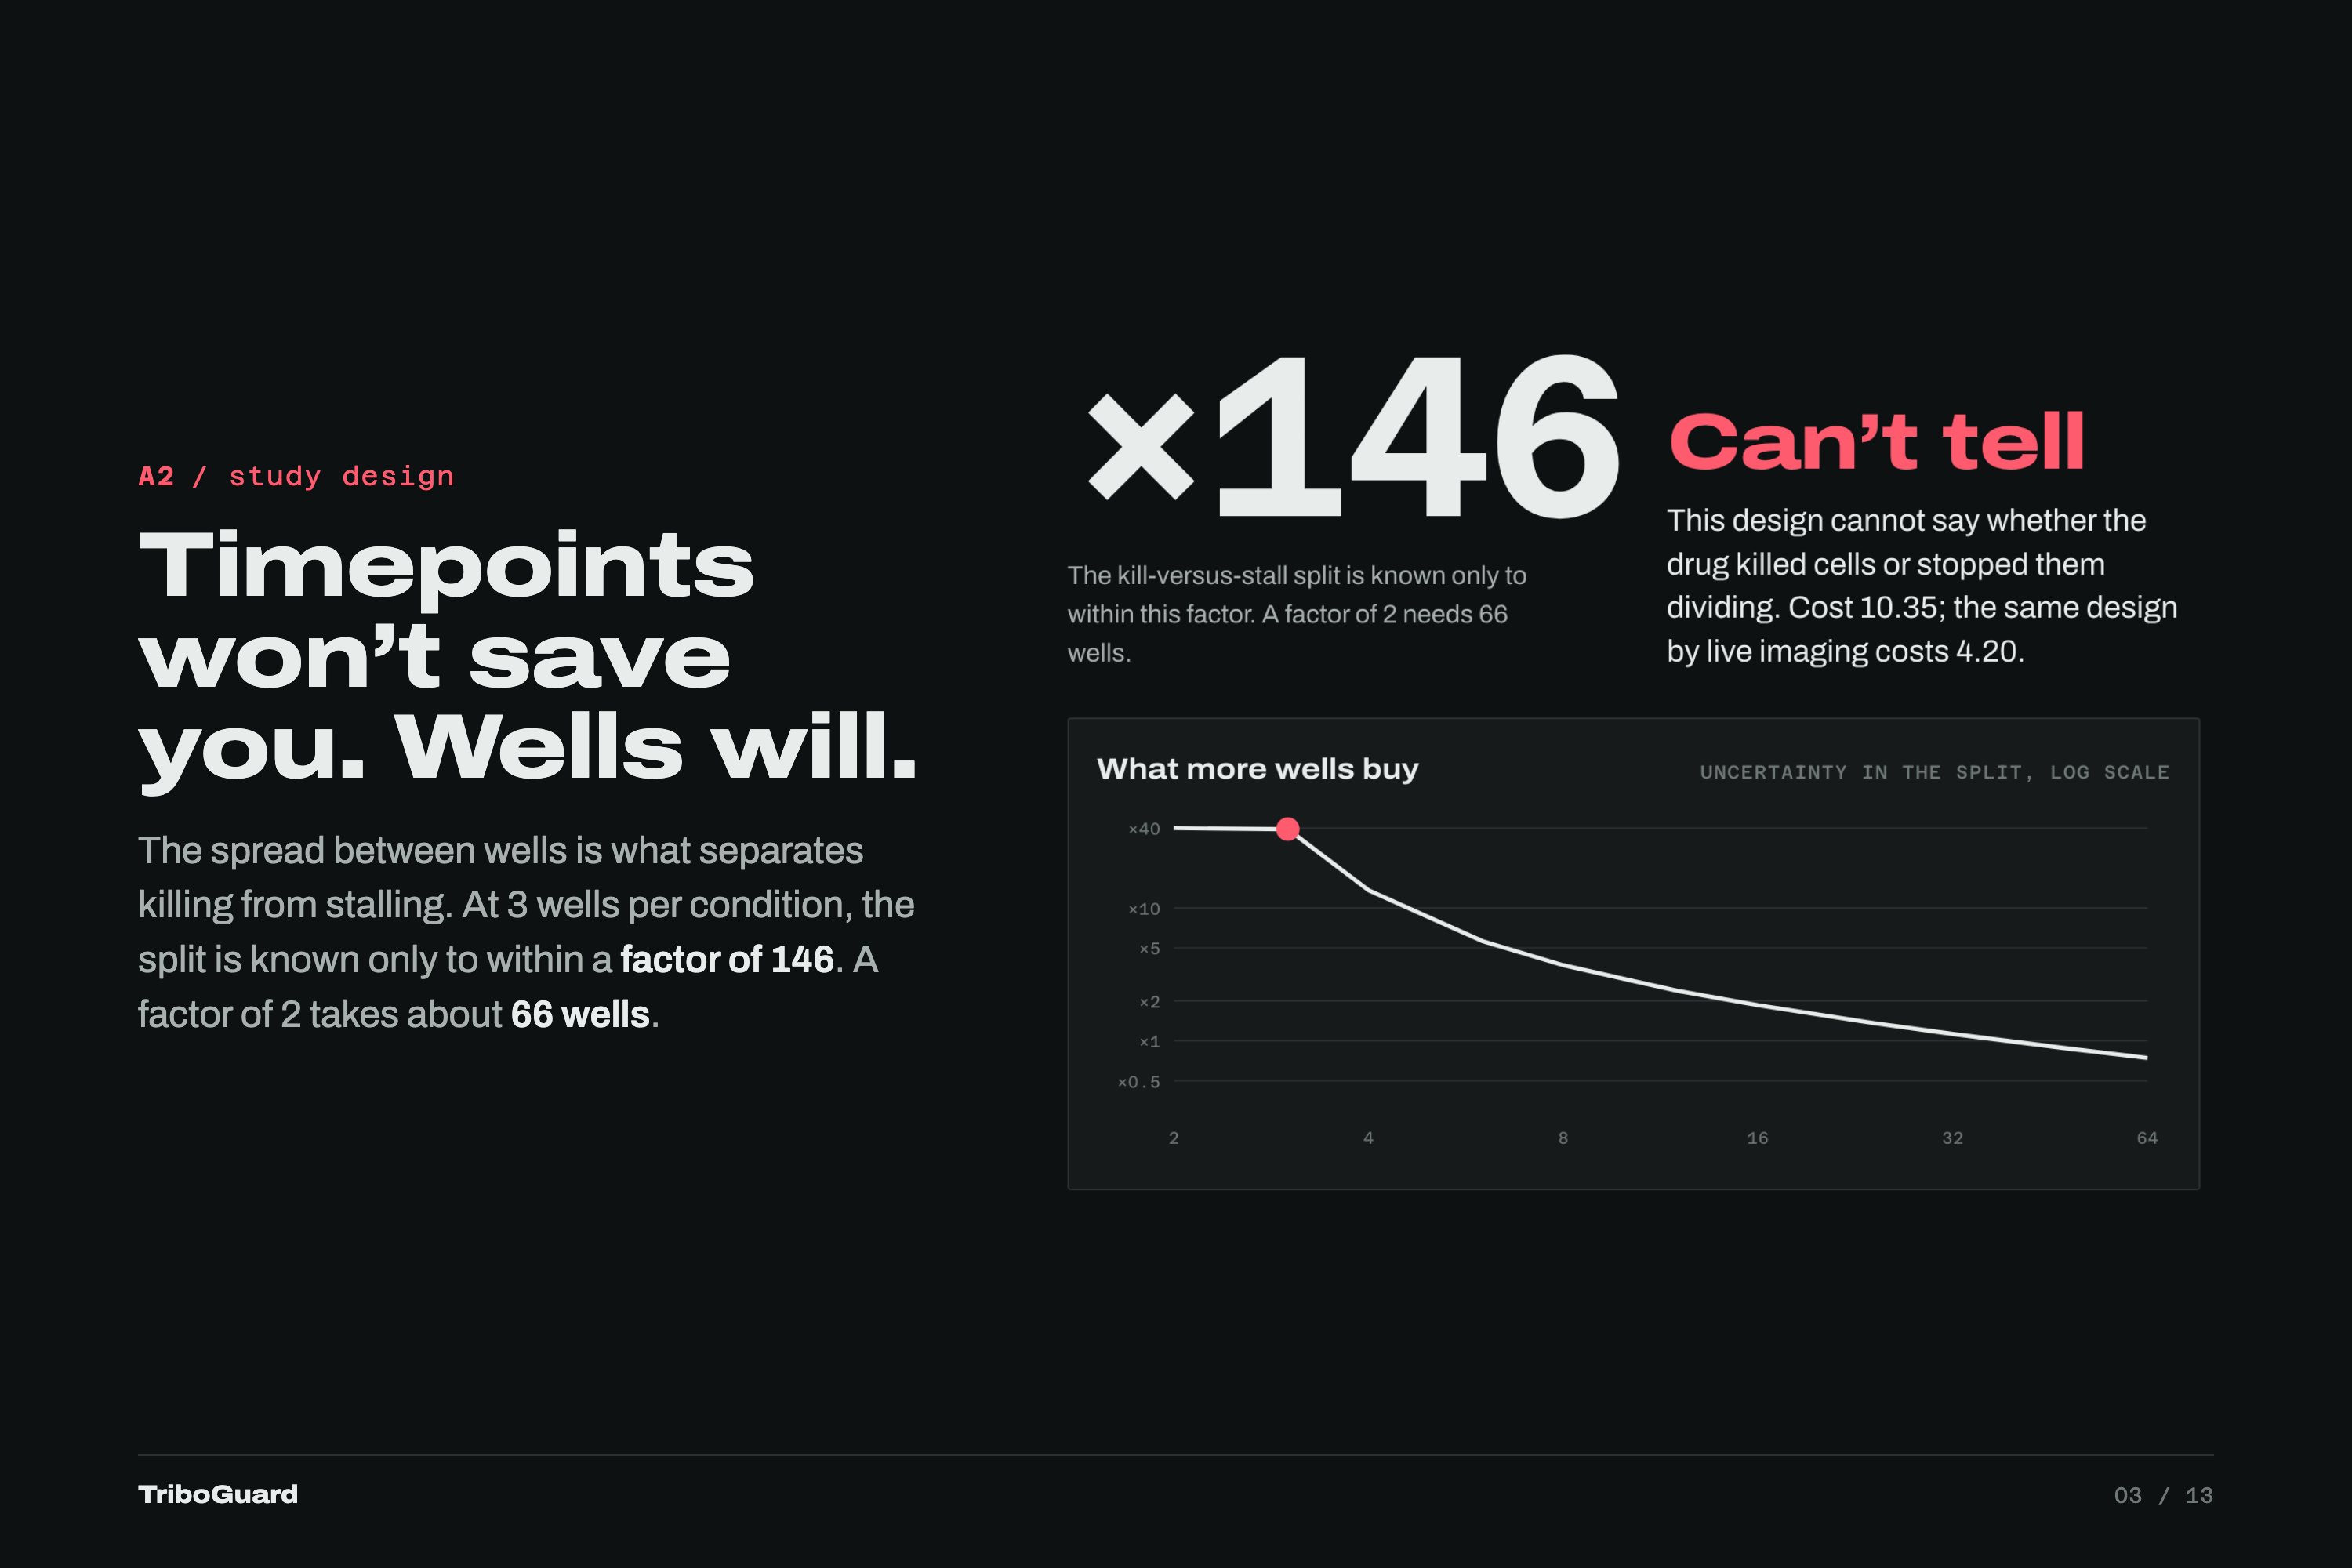
At 3 wells per condition, whether a drug killed or stalled cells is known only within a factor of 146. A factor of 2 takes about 66 wells.
-
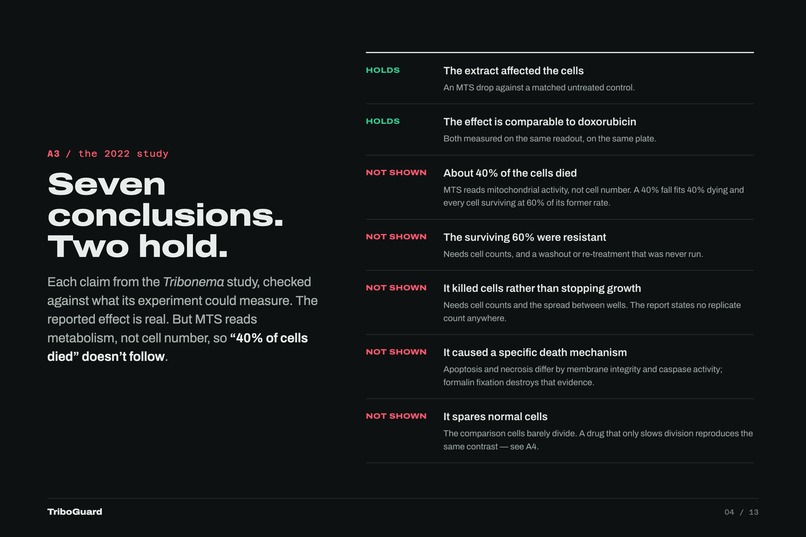
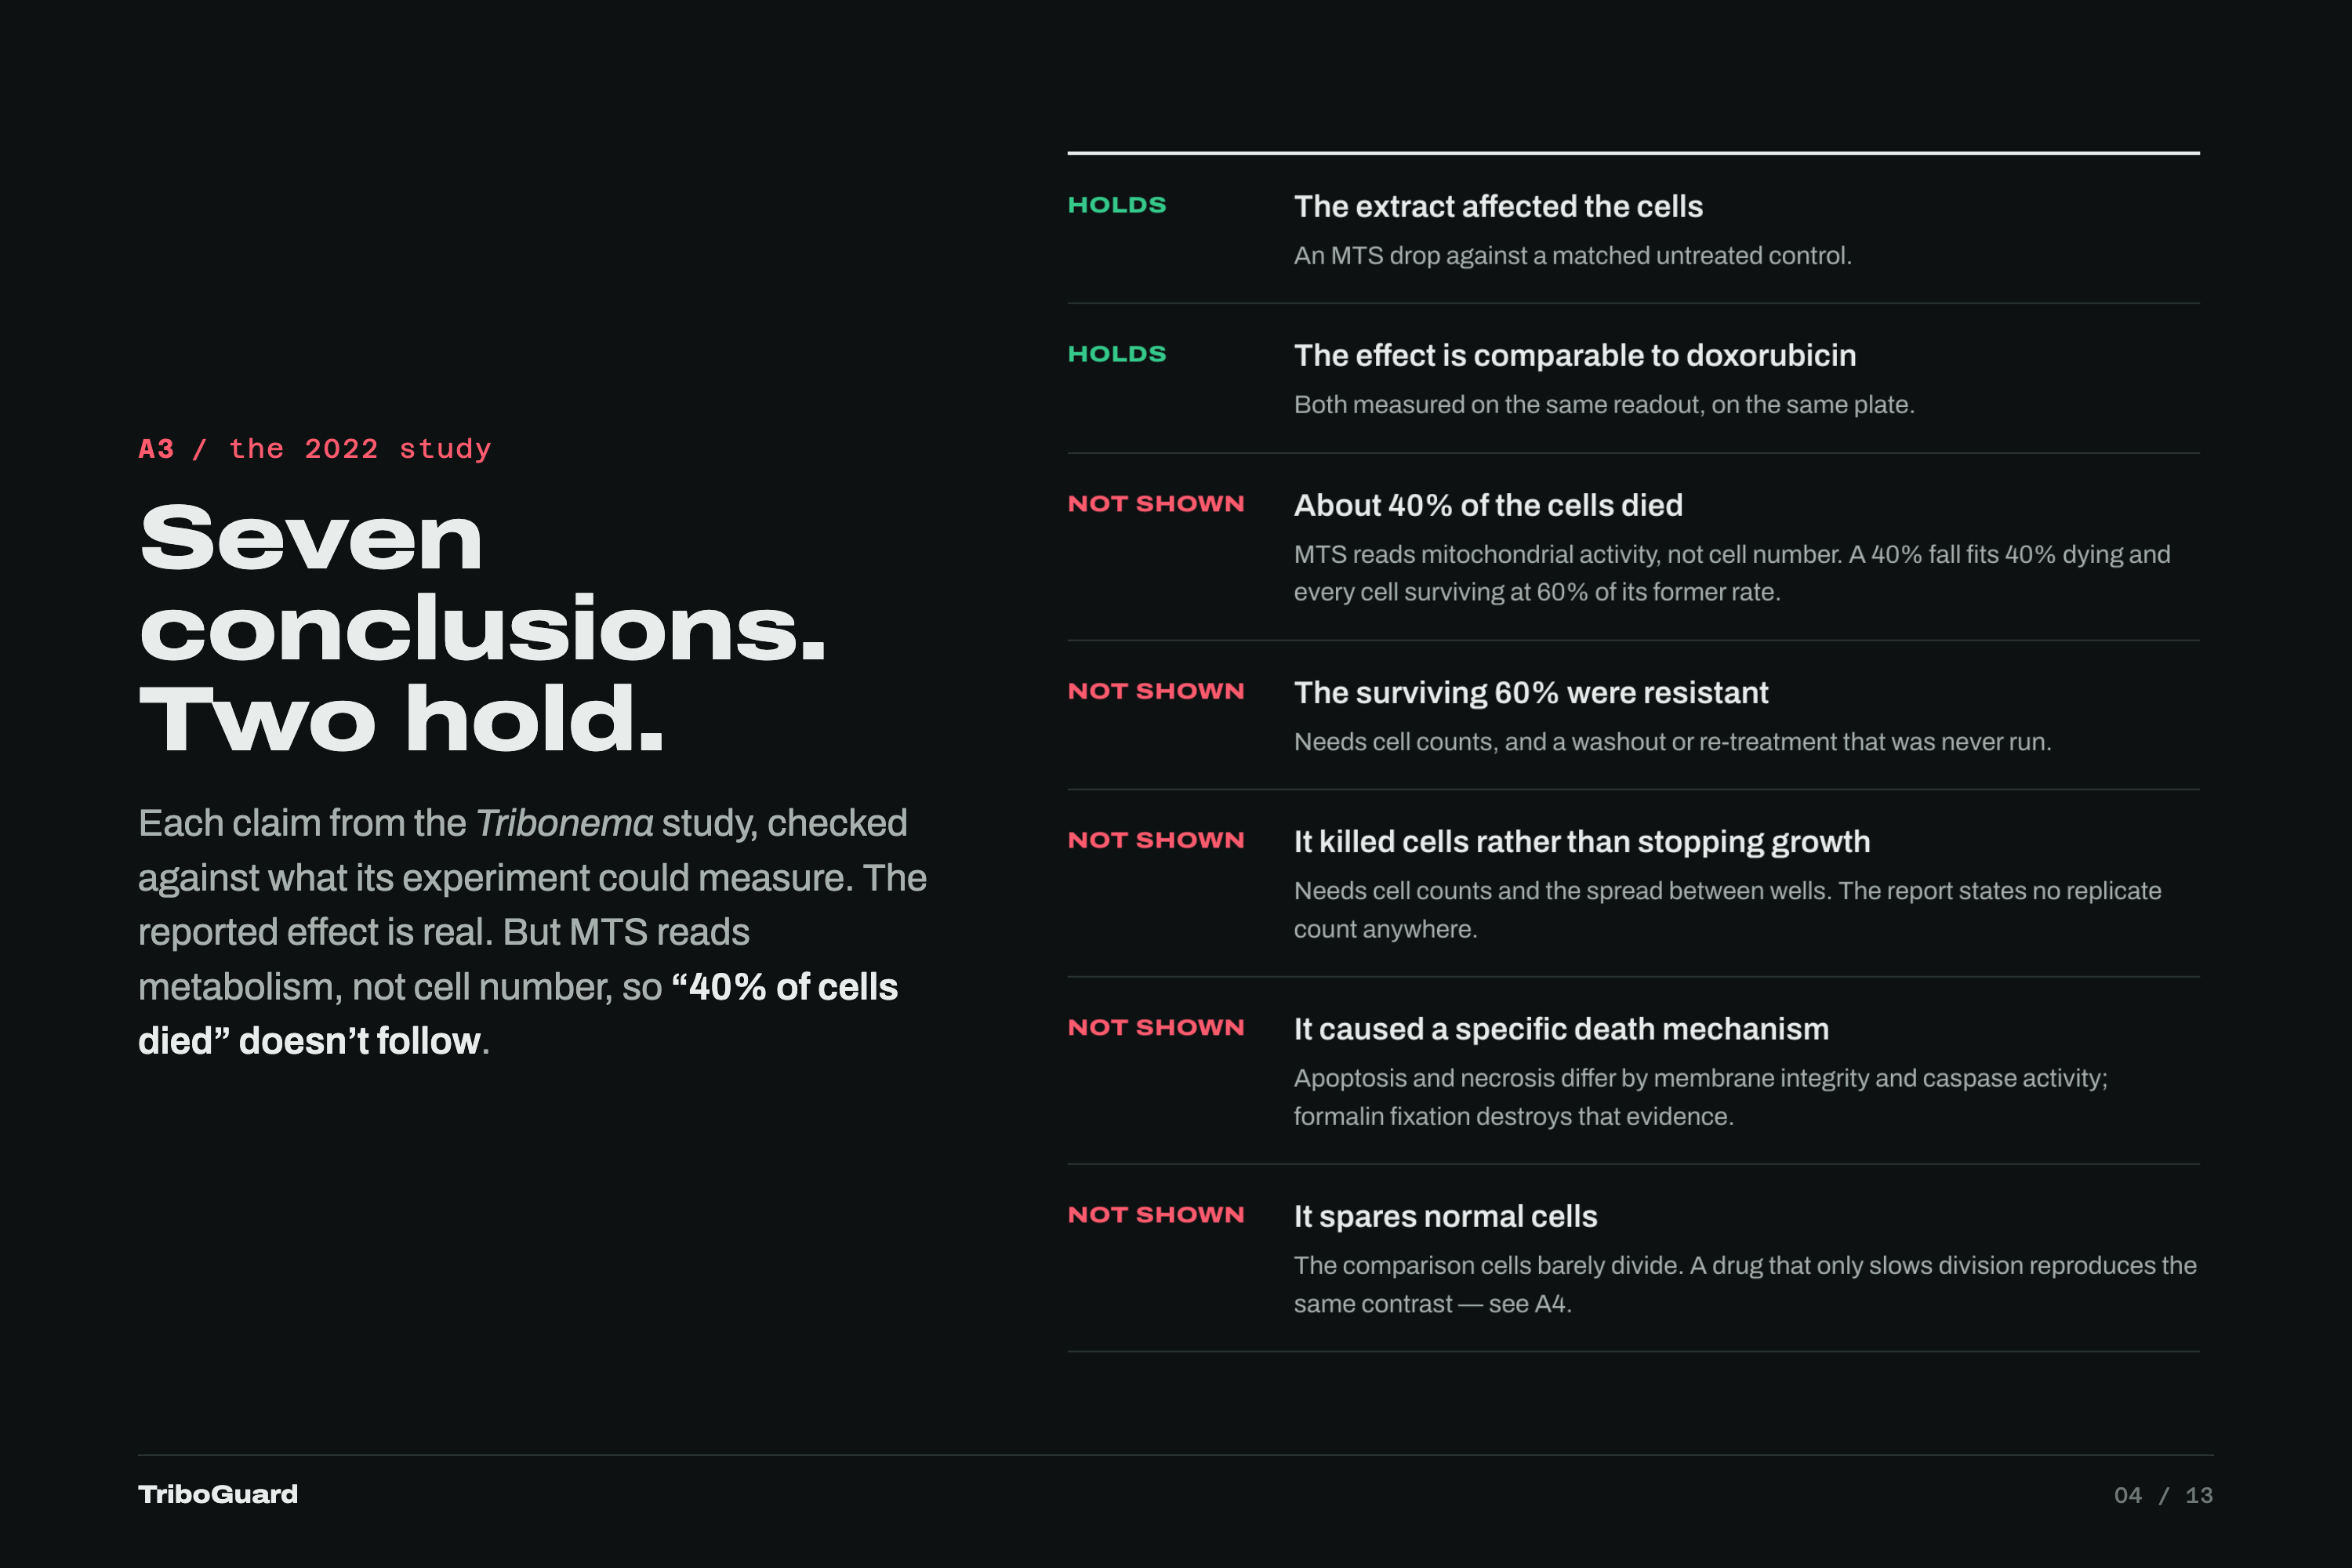
We checked 7 claims from the 2022 Tribonema study against what its MTS assay can measure. Two hold. MTS reads metabolism, not cell number.
-
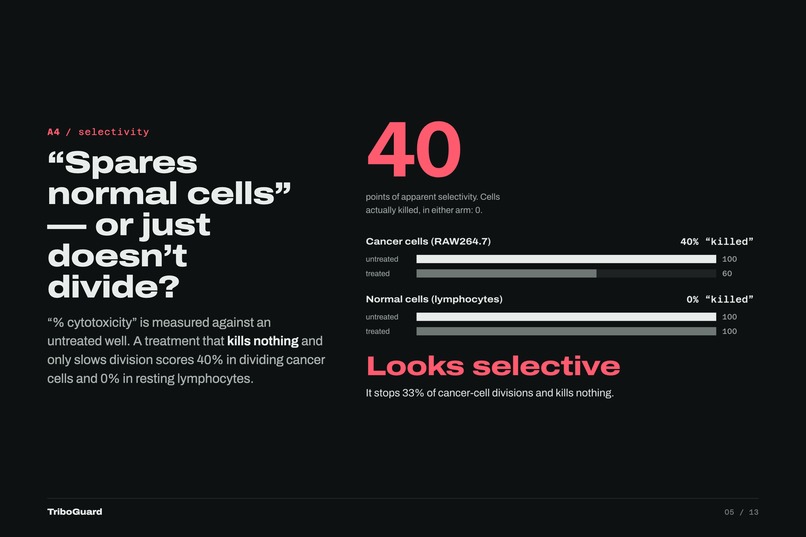
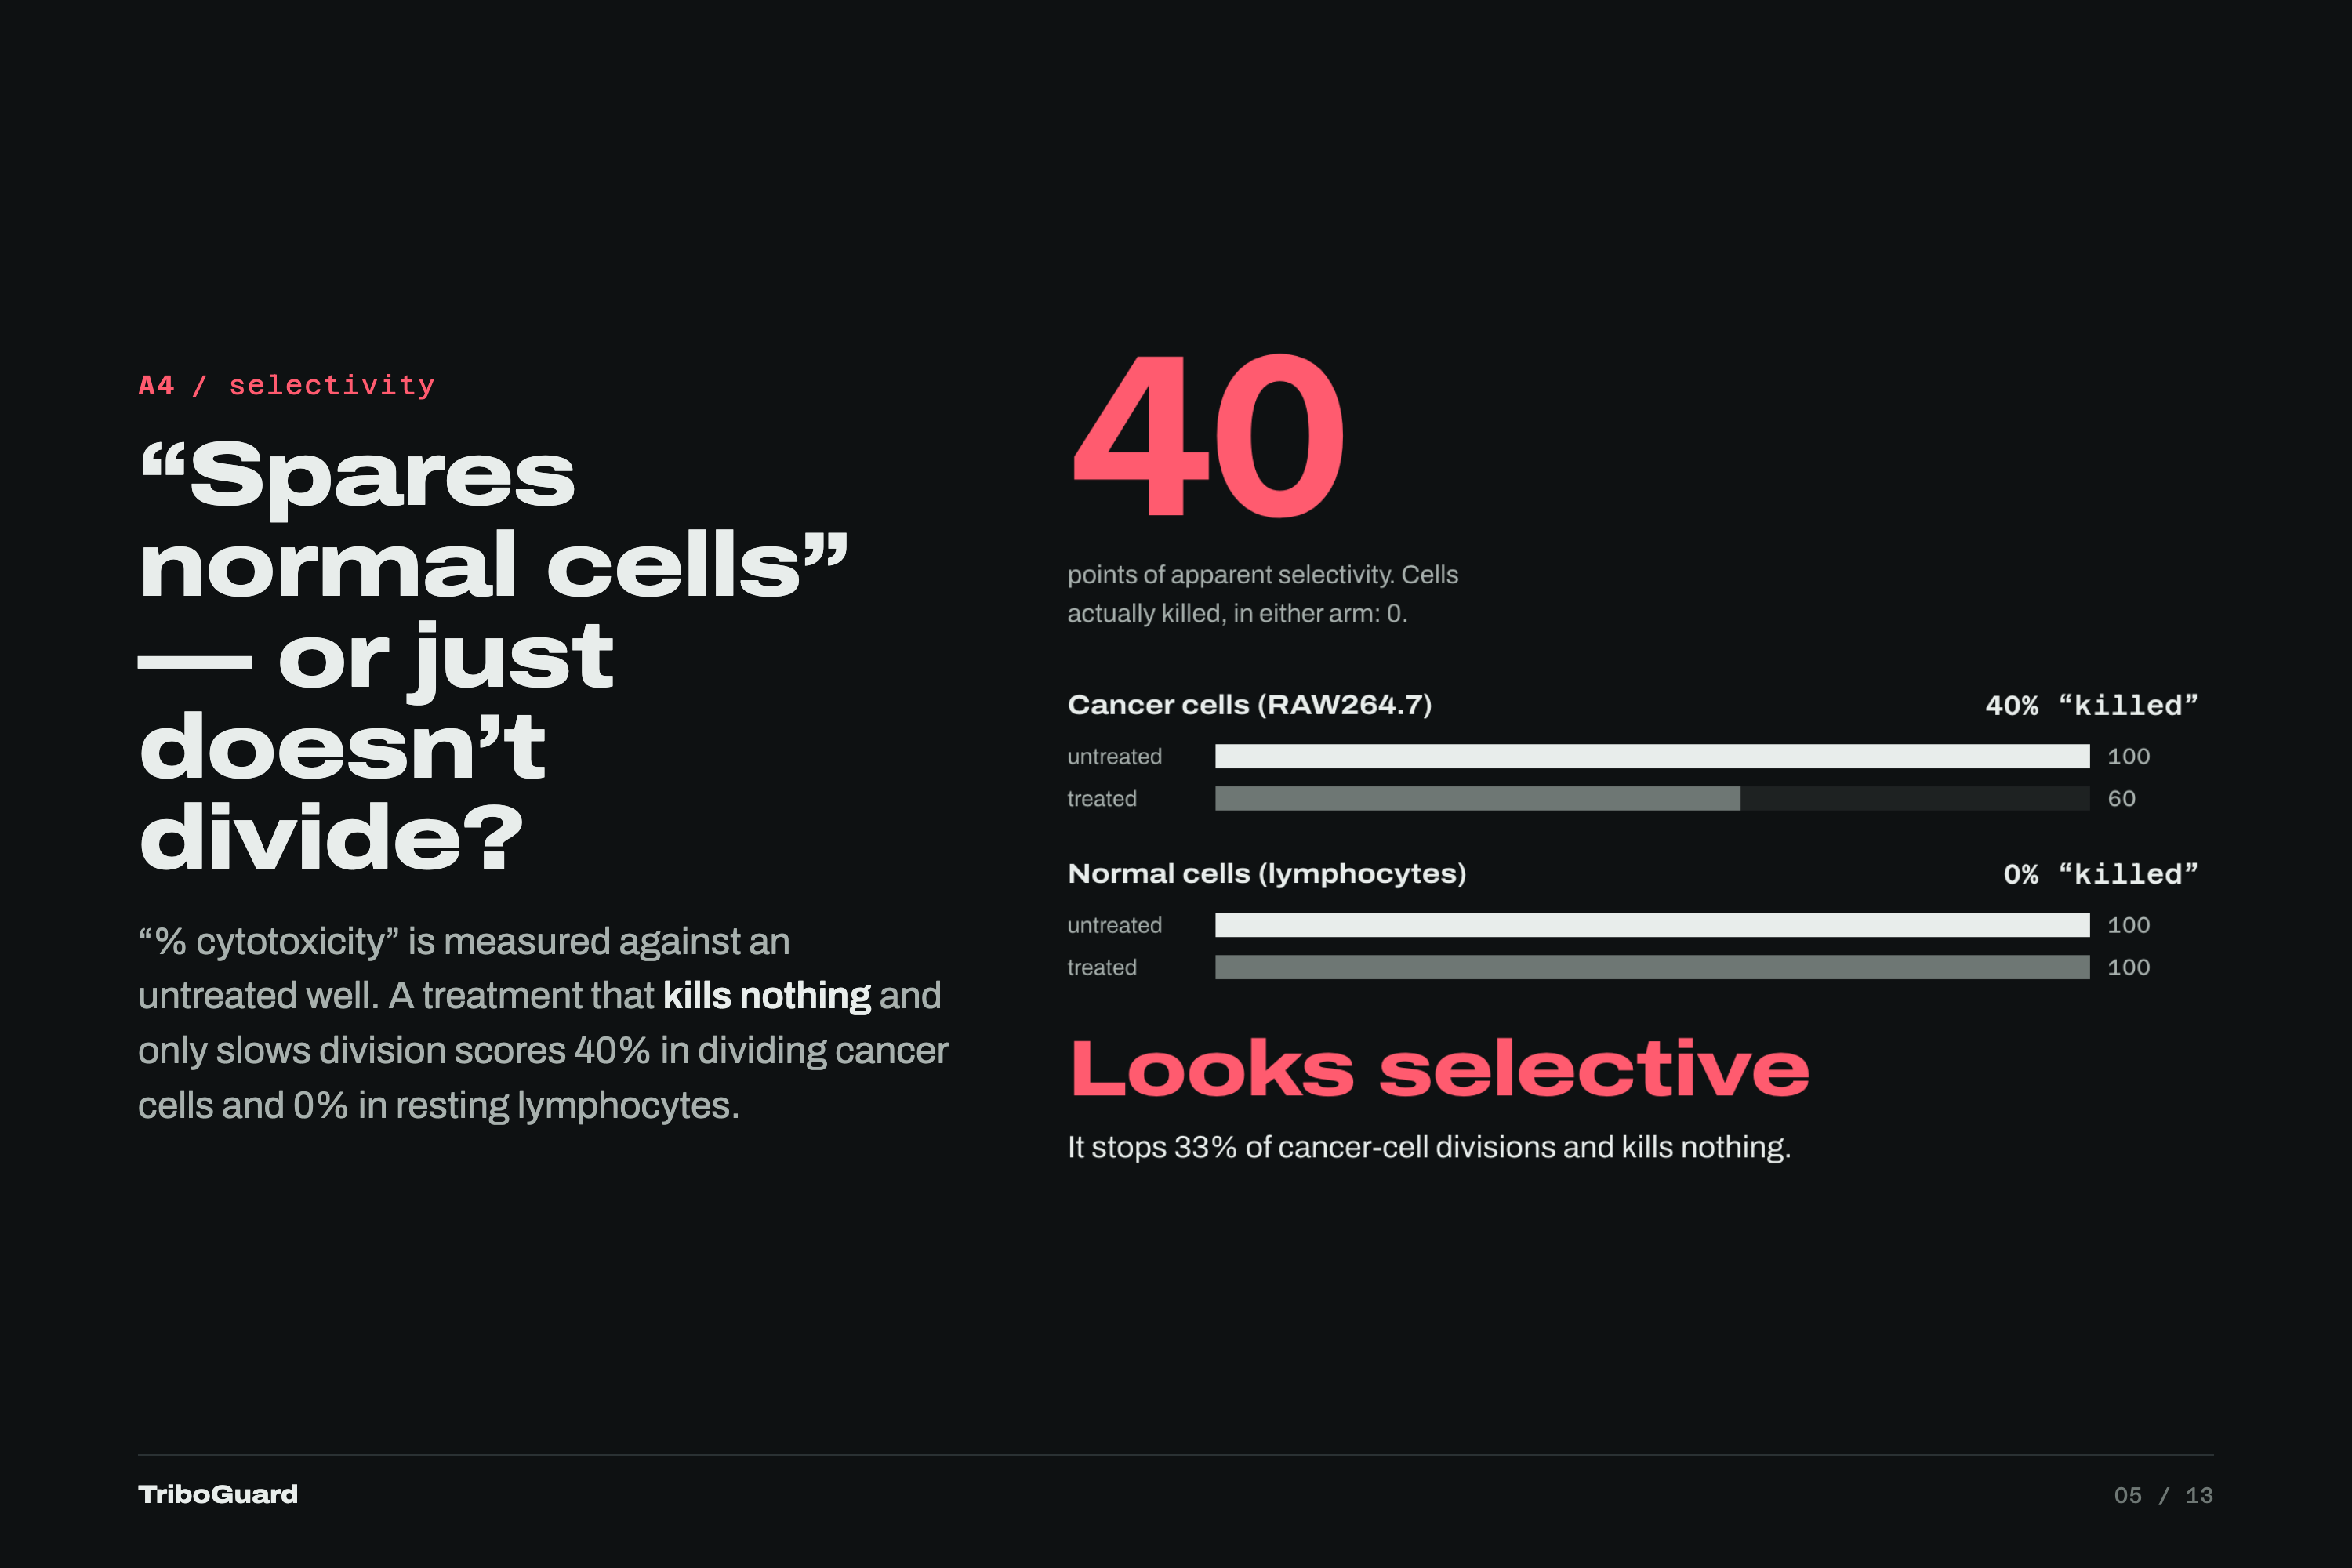
"Spares normal cells"? A treatment that kills nothing and only slows division scores 40% in dividing cancer cells and 0% in resting ones.
-
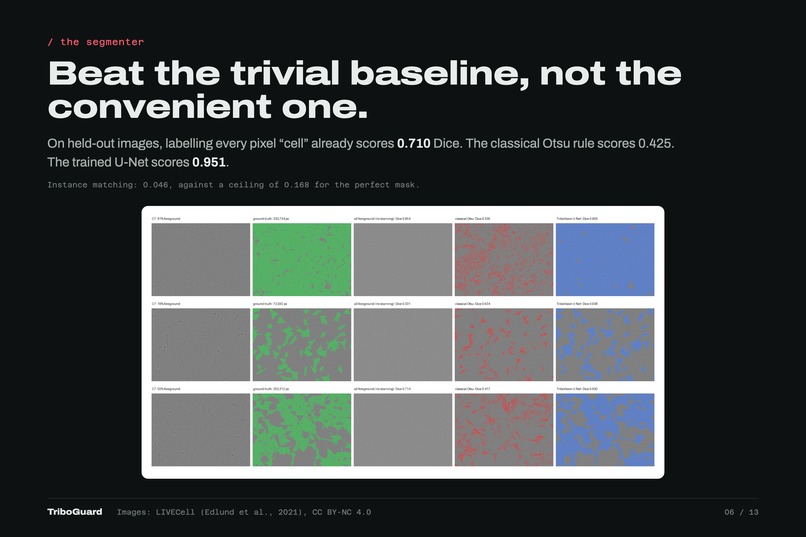
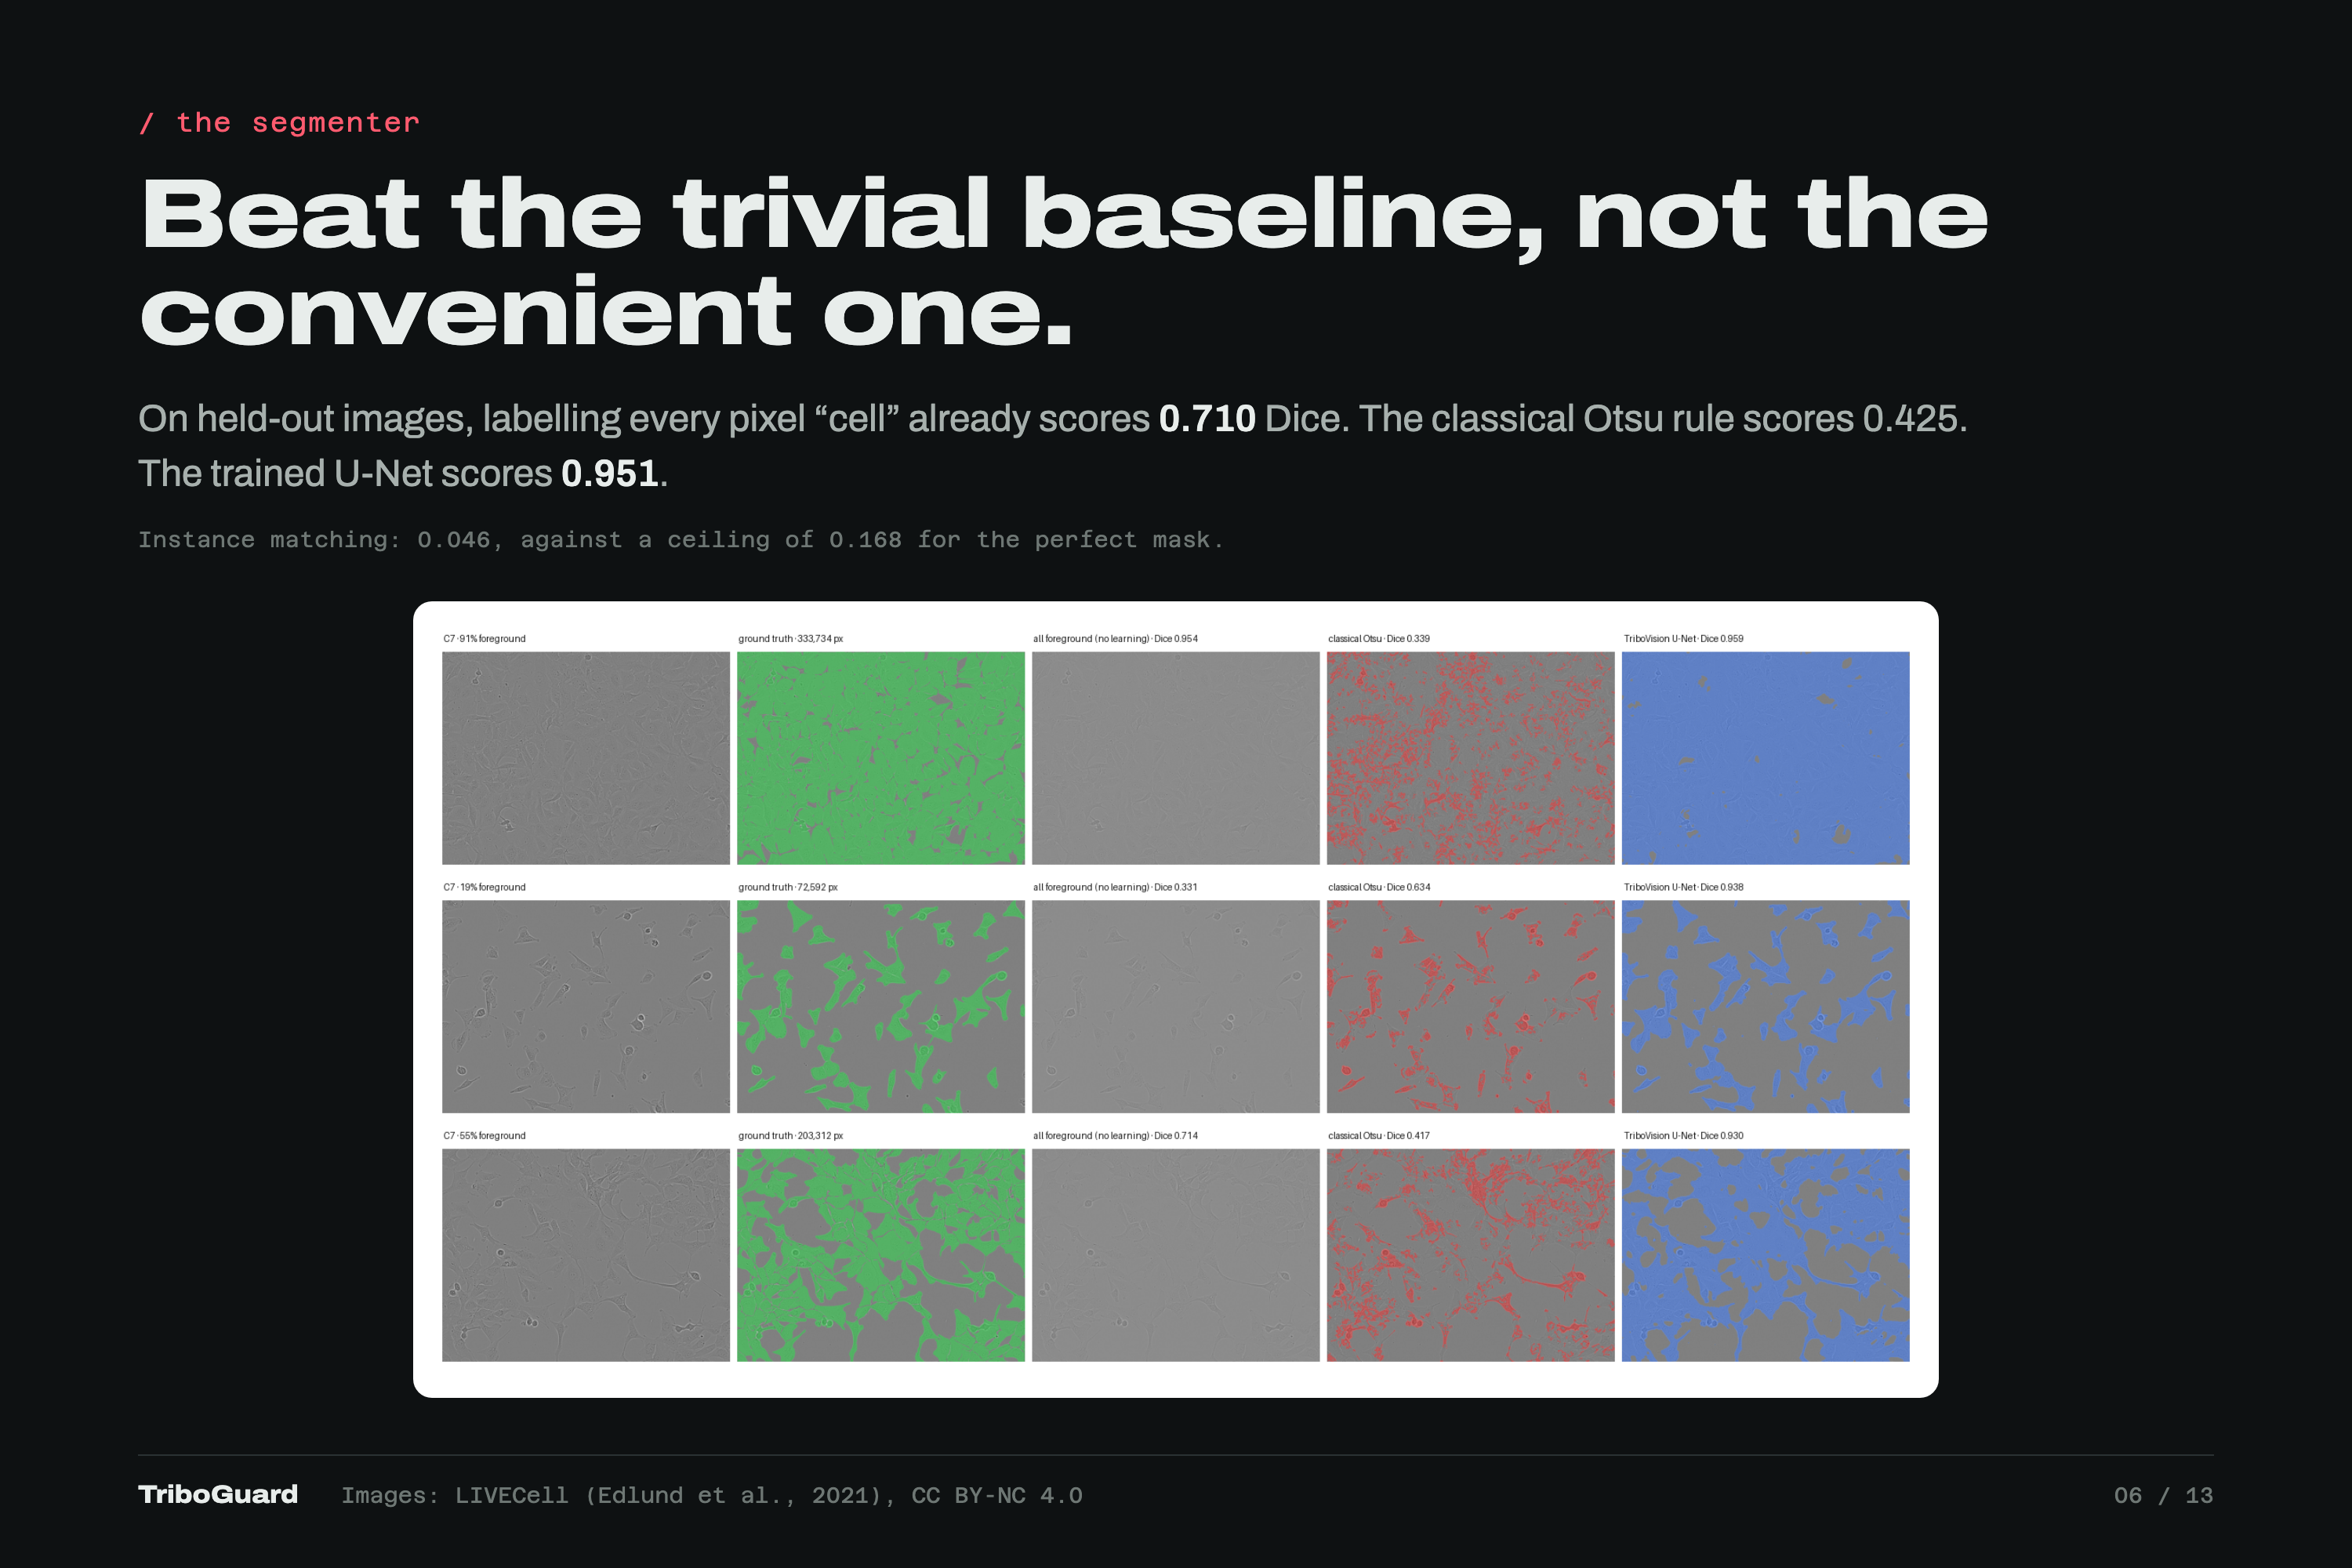
Our U-Net scores 0.951 Dice; labelling every pixel "cell" already scores 0.710. Instance matching: 0.046 vs a 0.168 perfect-mask ceiling.
-
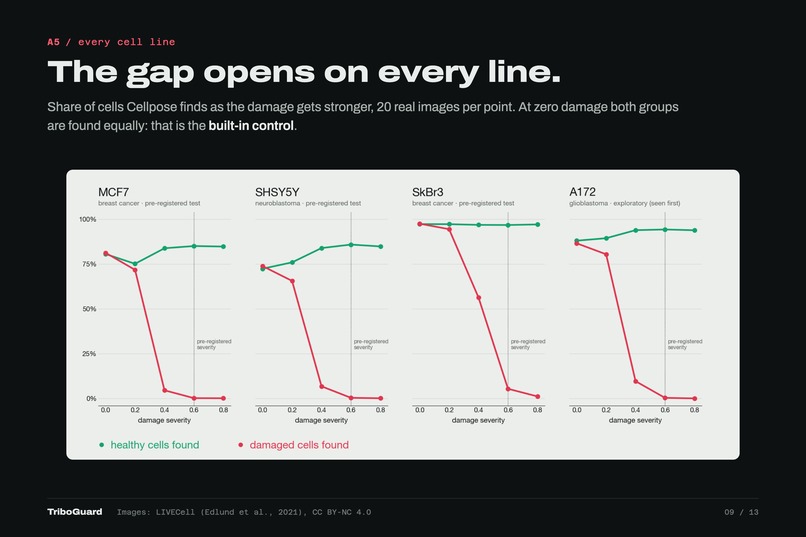
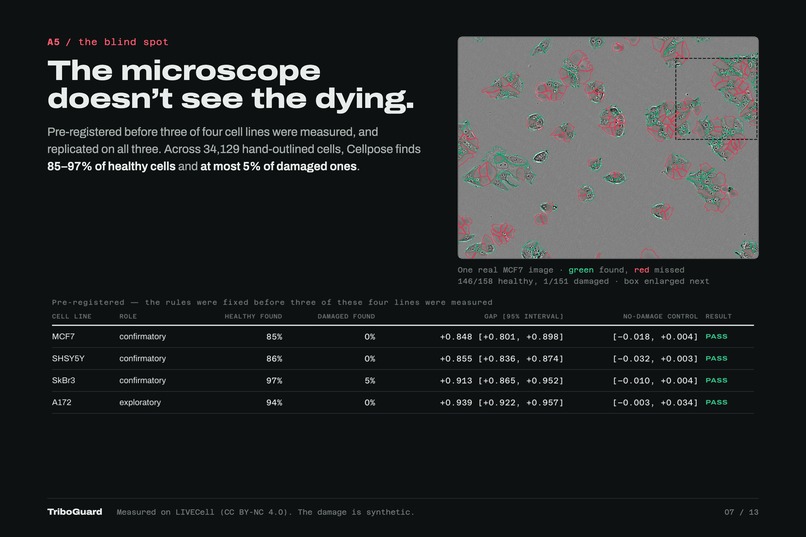
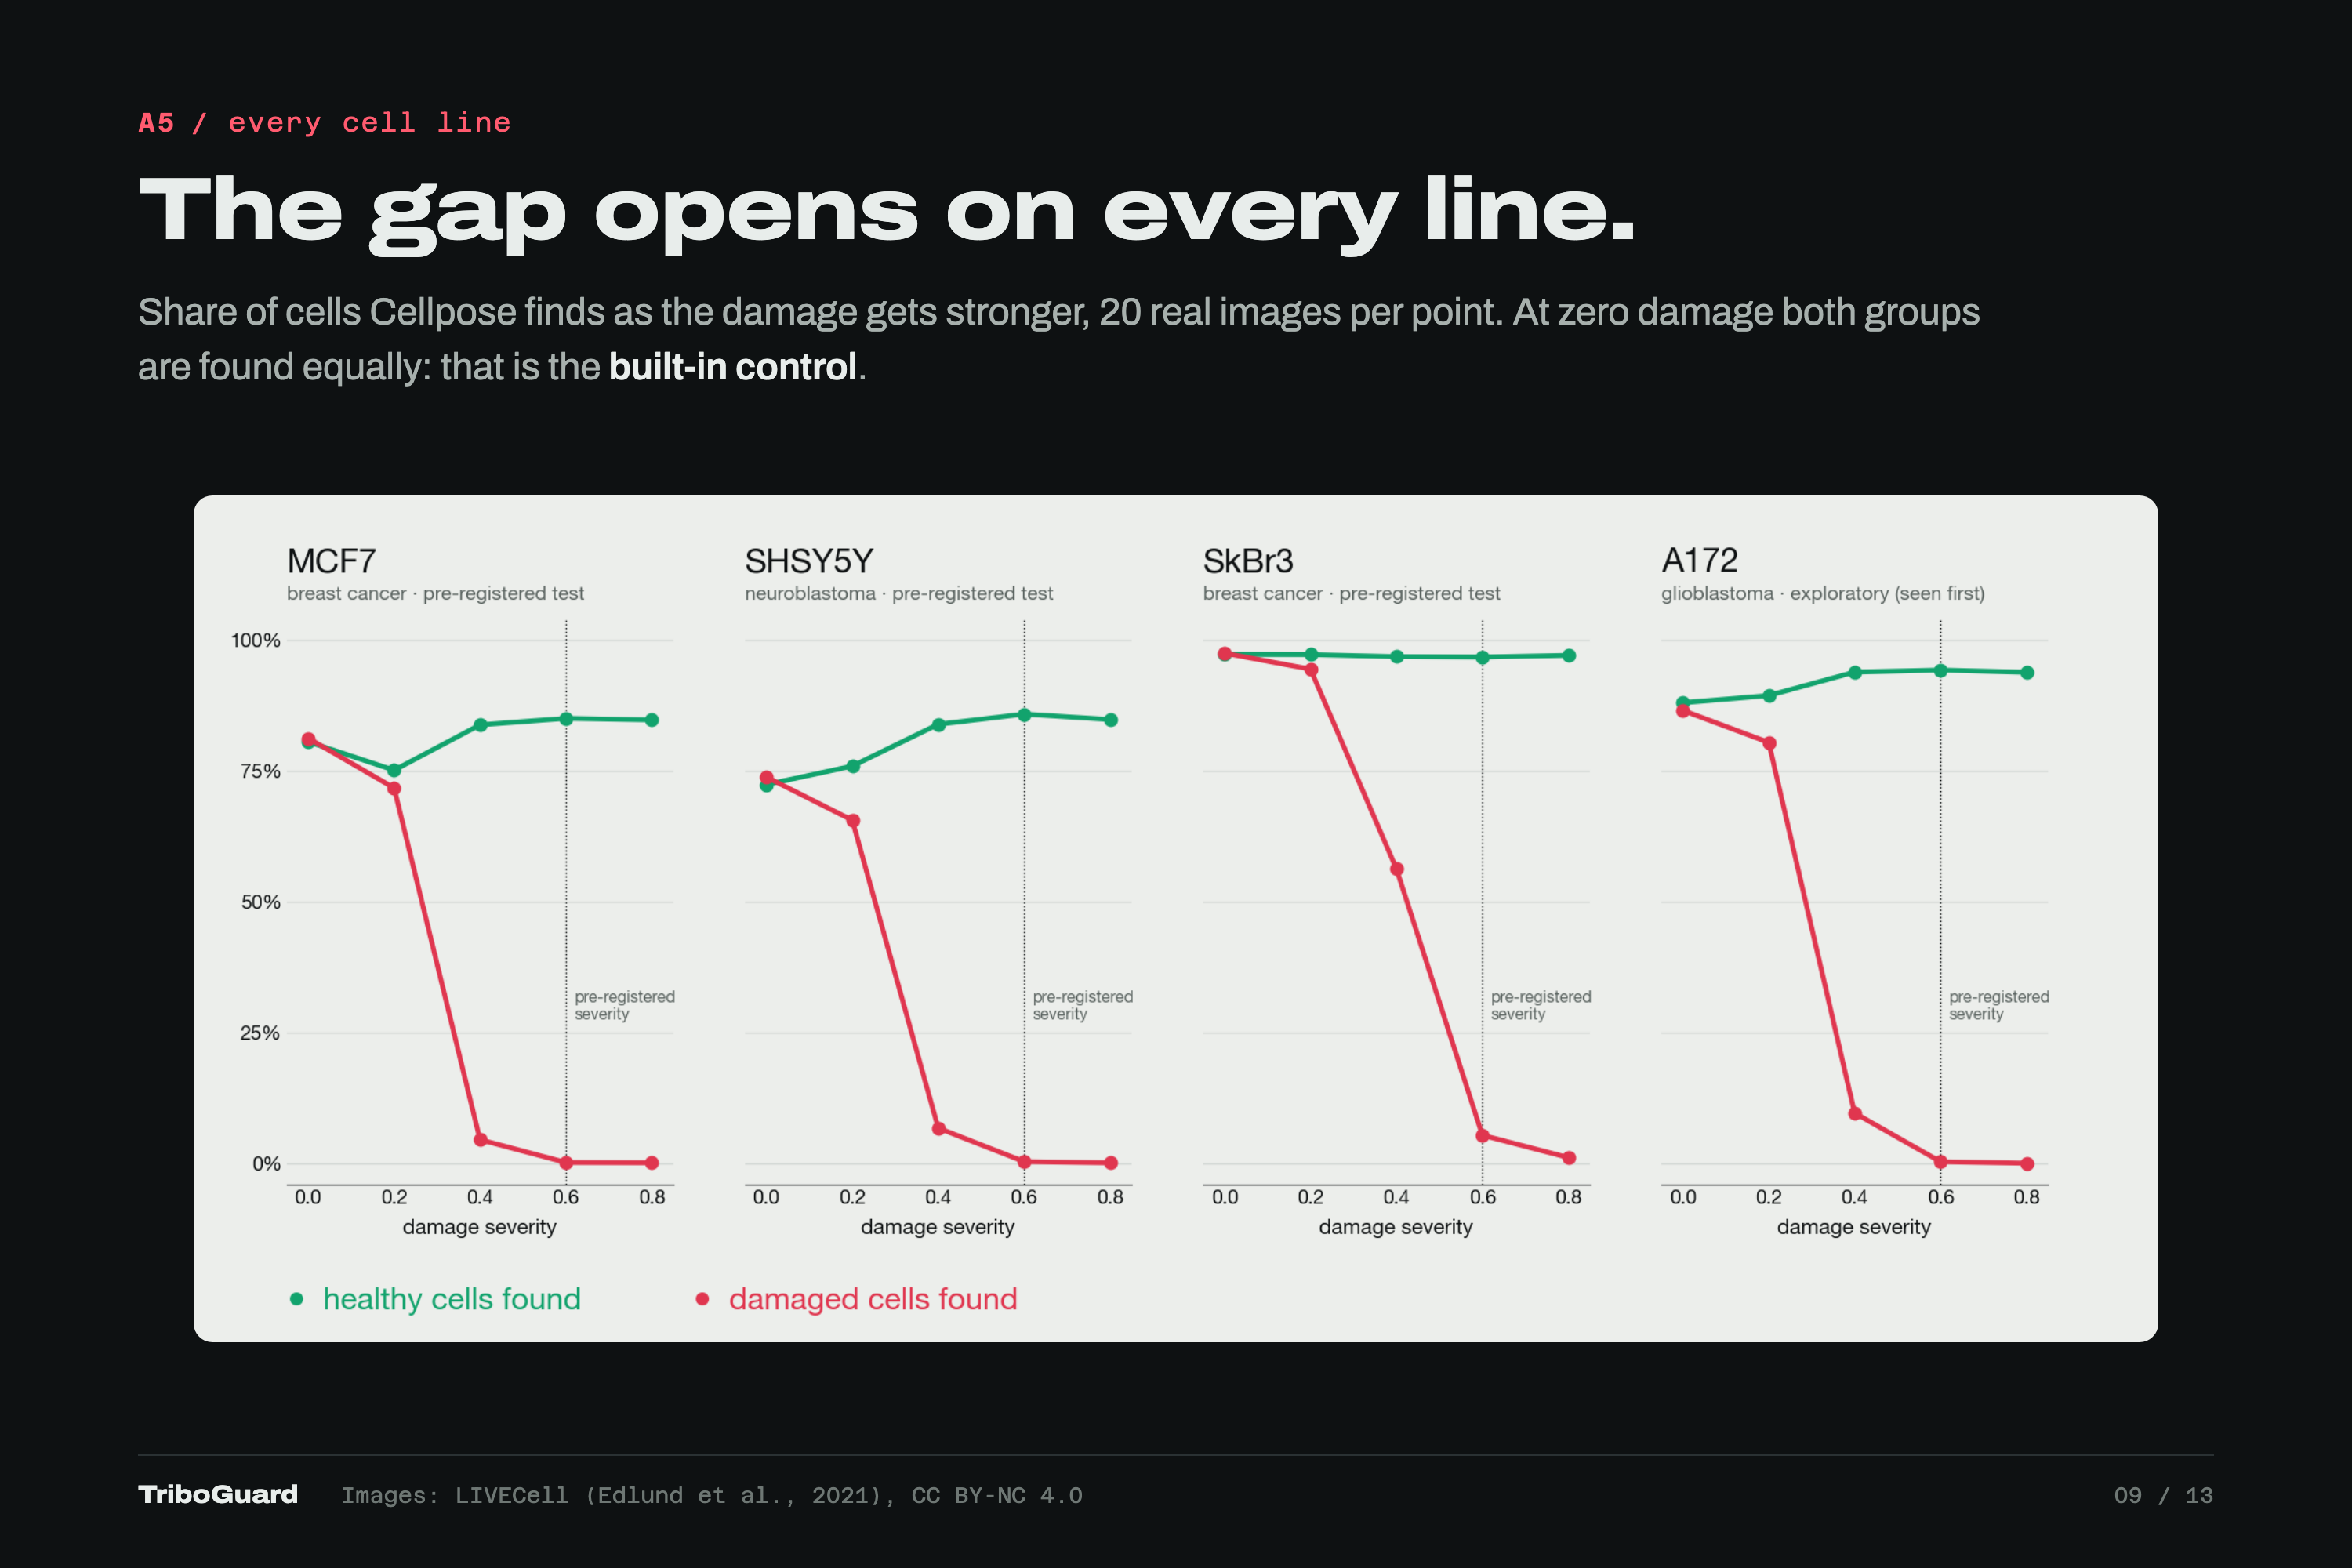
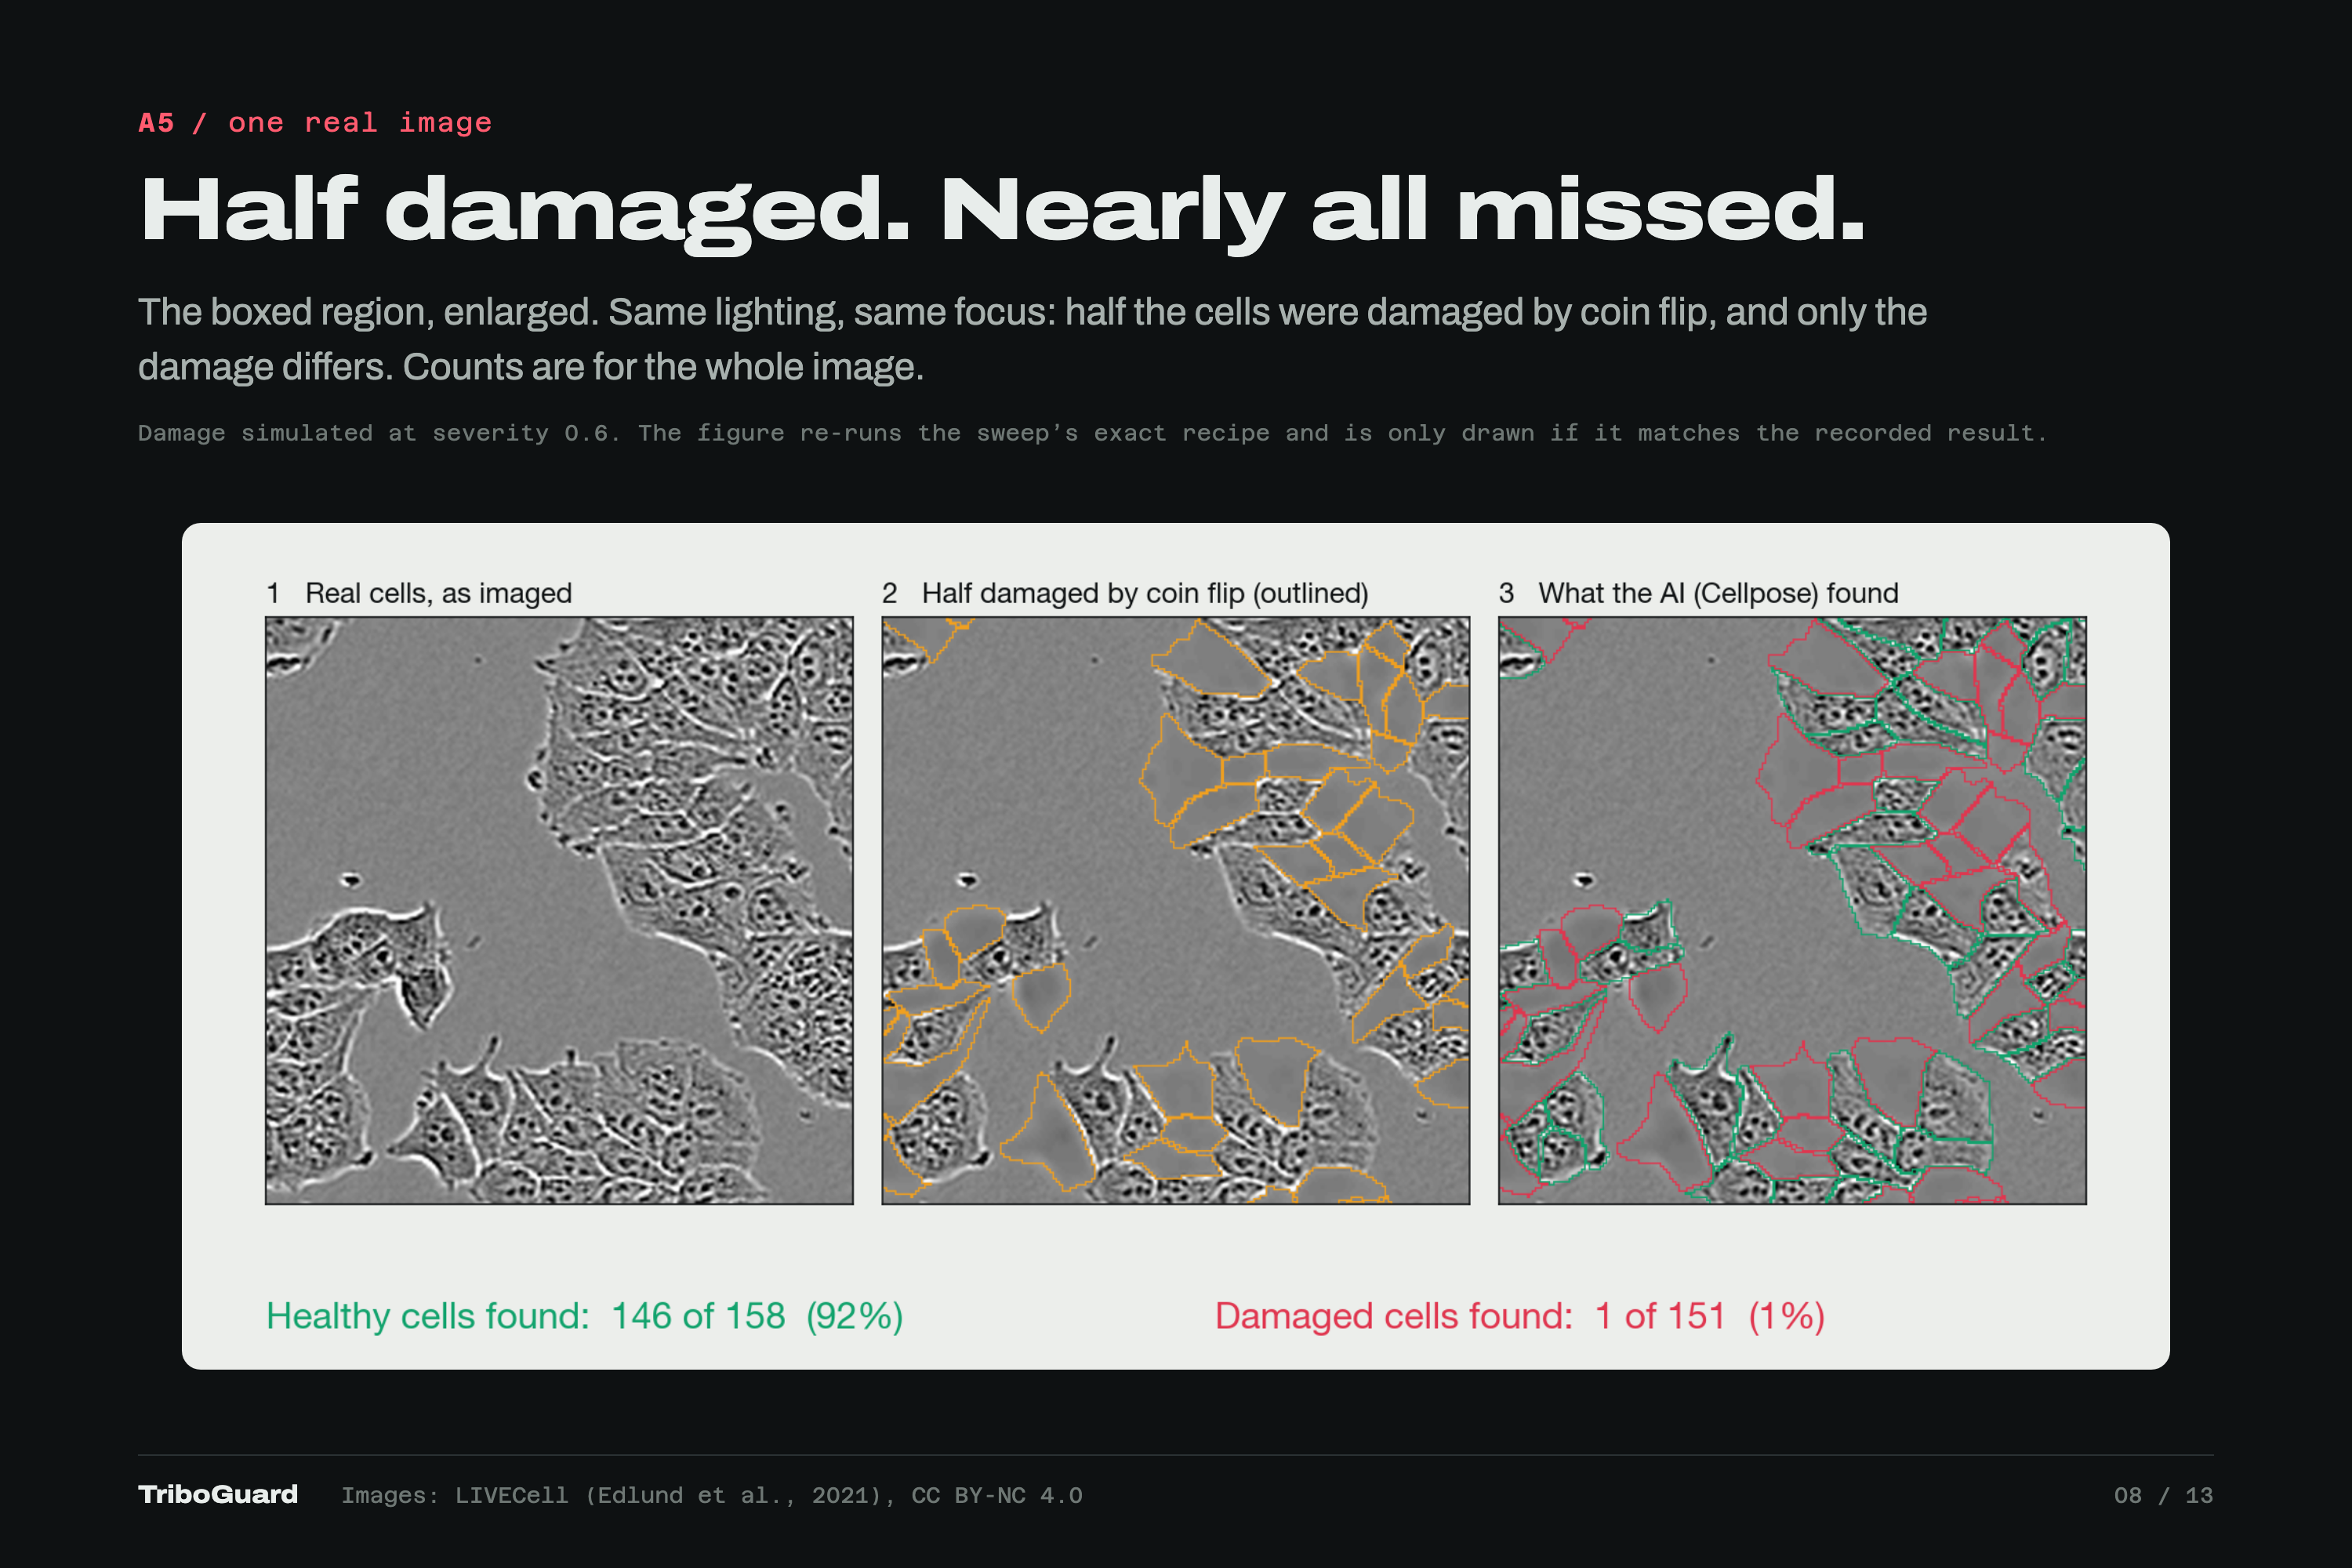
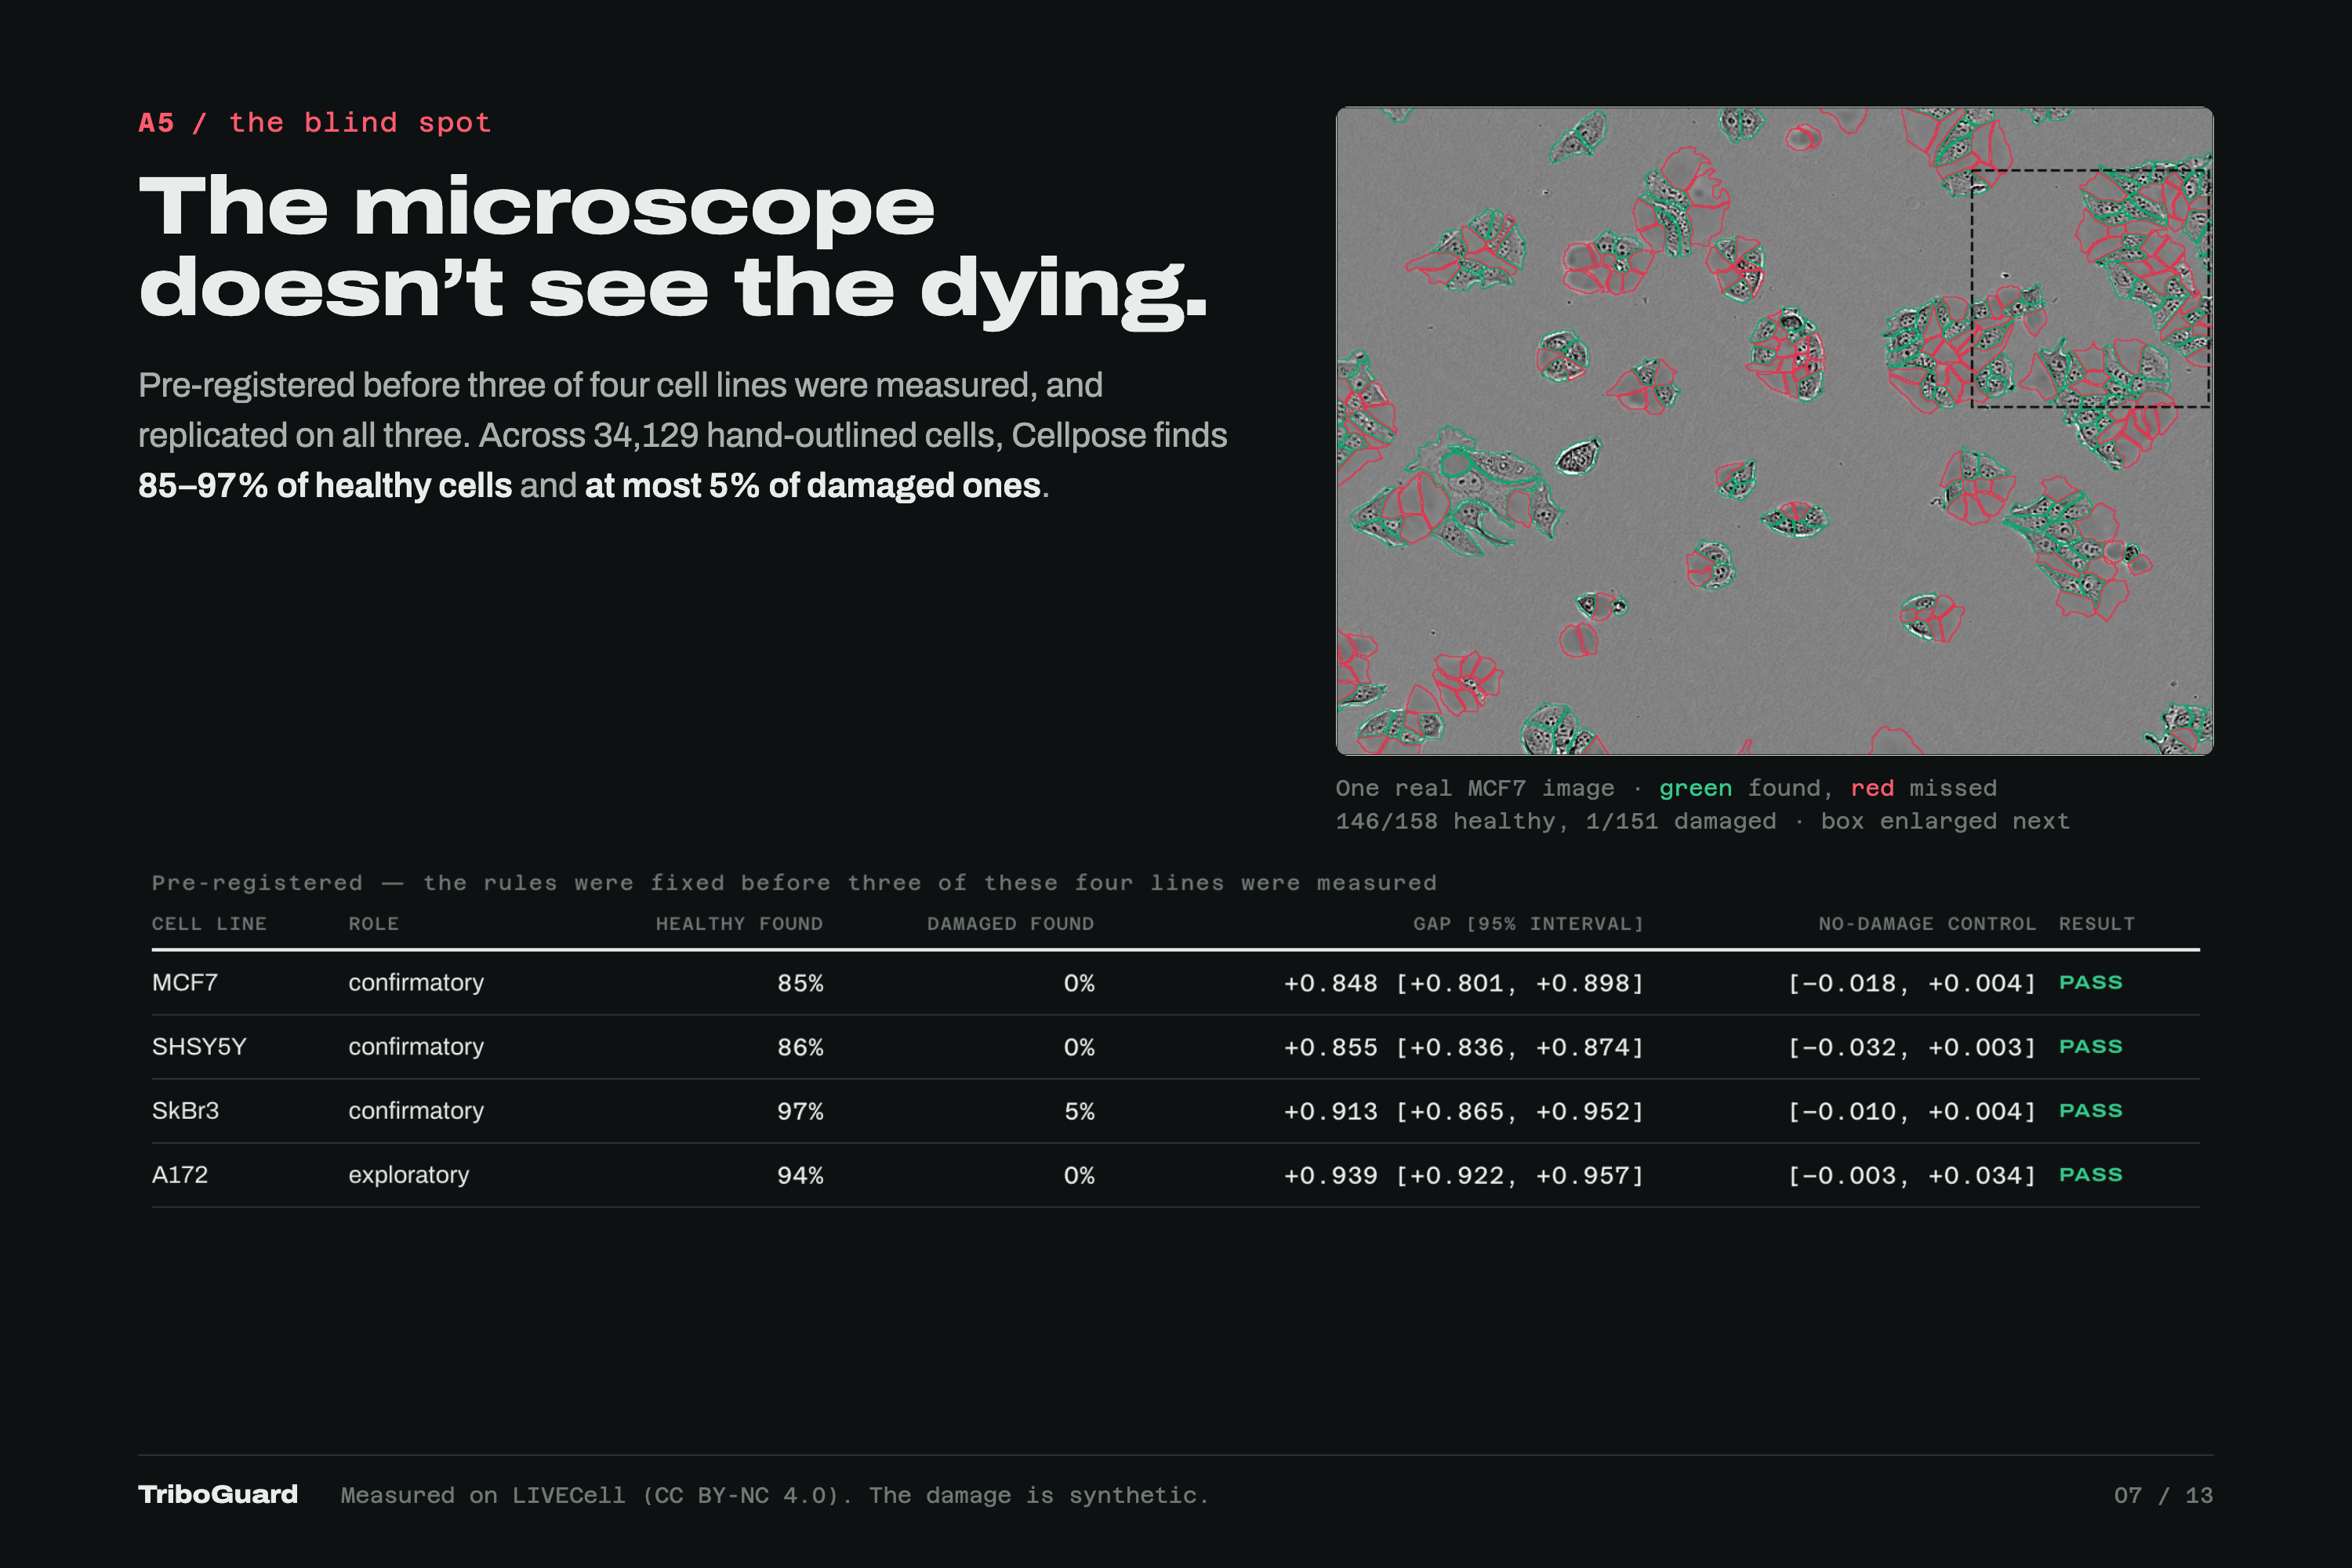
Pre-registered, then replicated on 3 unseen cell lines: Cellpose finds 85-97% of healthy cells but at most 5% of (simulated) damaged ones.
-
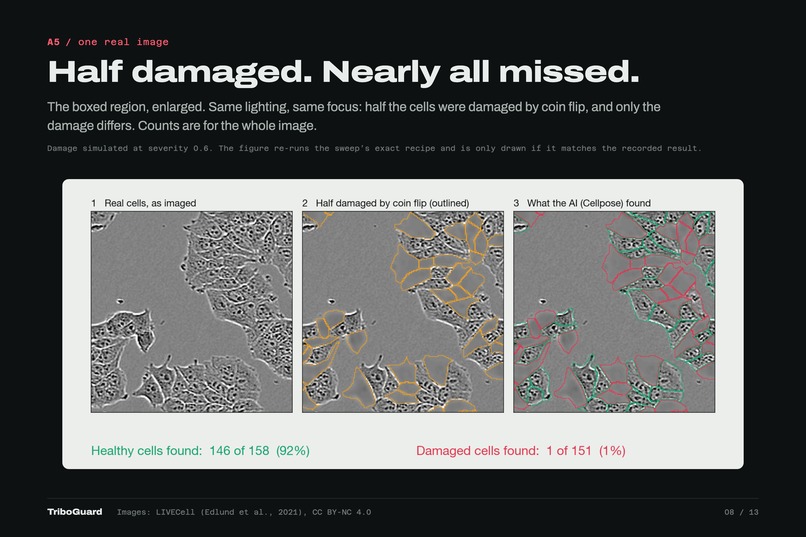
One real MCF7 image, half its cells given simulated damage by coin flip. Cellpose found 146 of 158 healthy cells and just 1 of 151 damaged.
-
On all 4 cell lines, damaged cells drop out of the count as damage grows; healthy ones are still found. Zero damage is the built-in control.
-
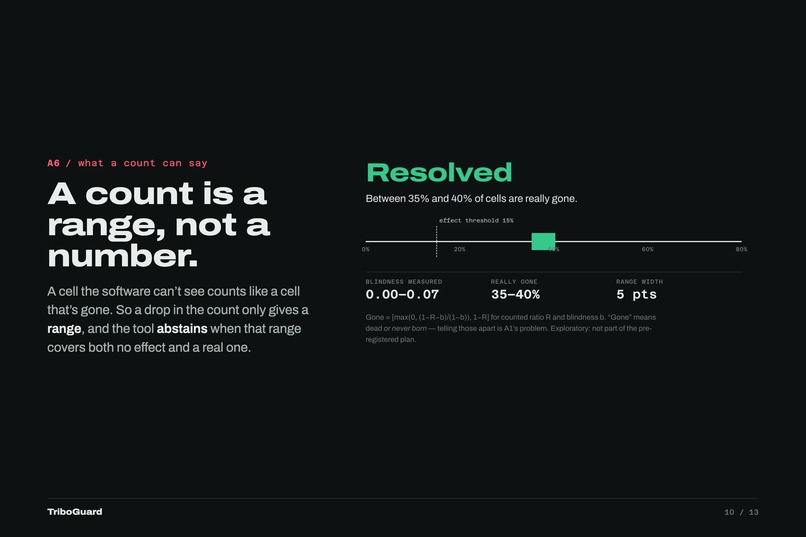
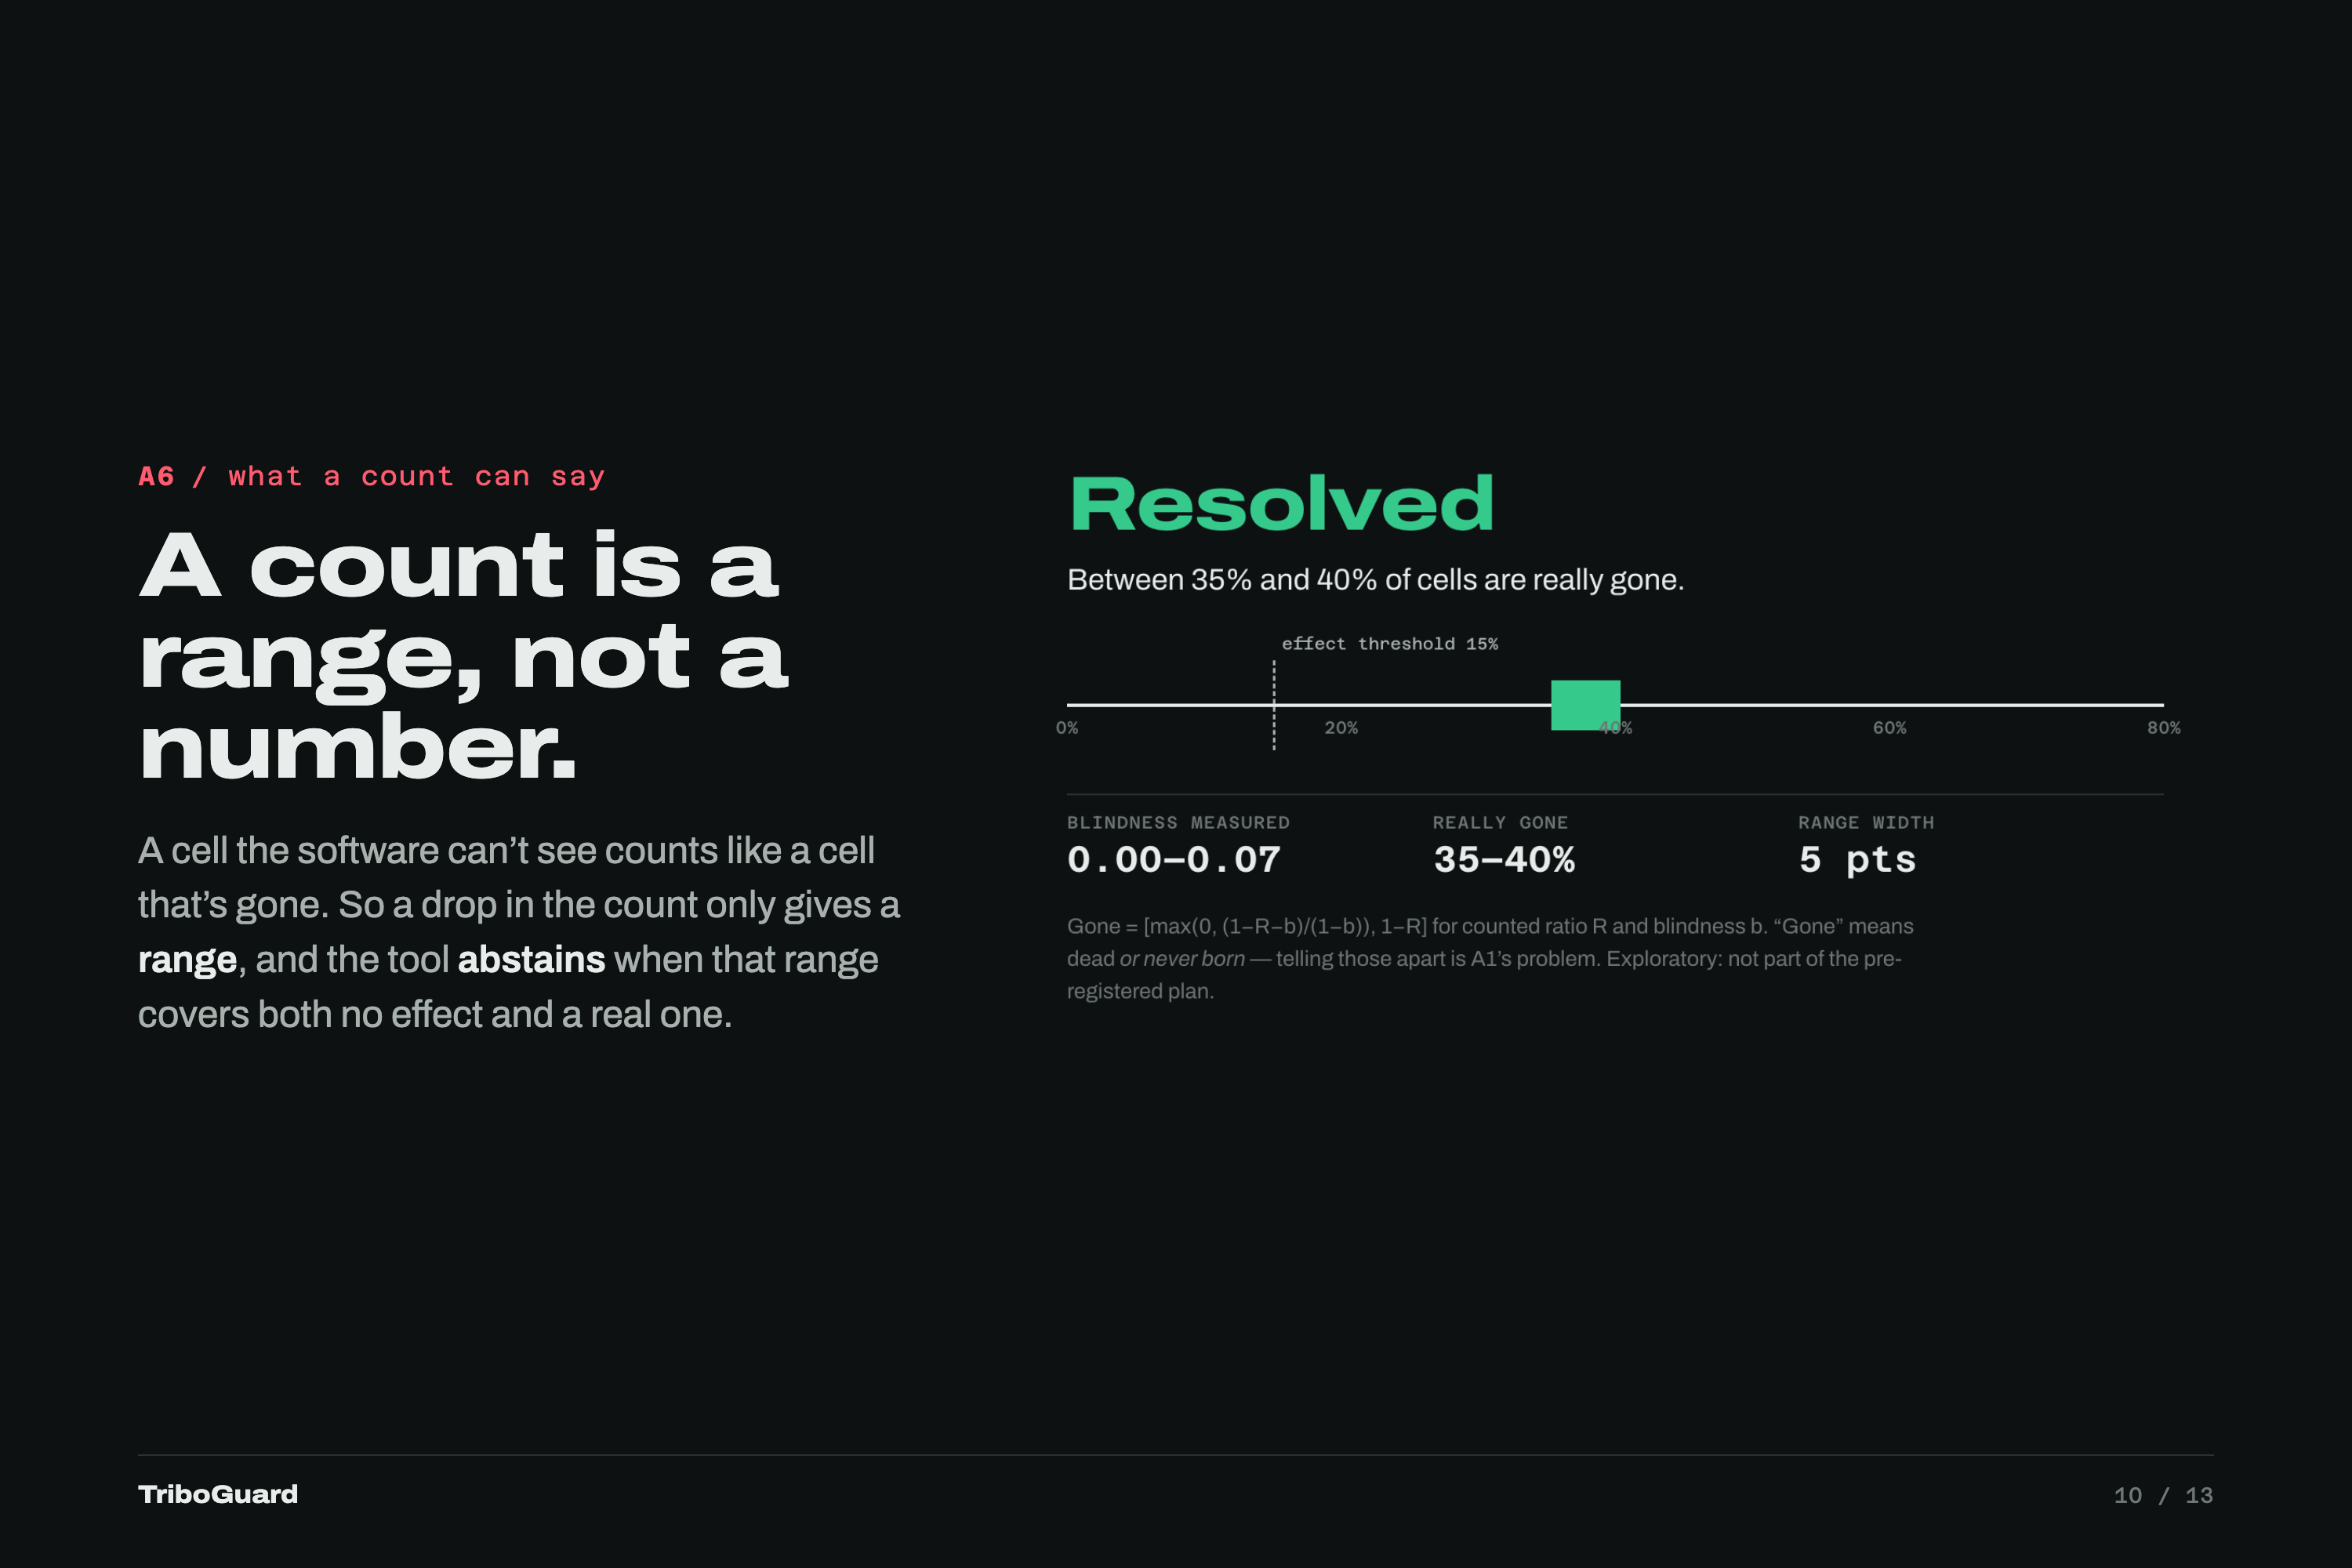
A cell the software can't see counts like a cell that's gone. So a count only gives a range, and the tool abstains when it is inconclusive.
-
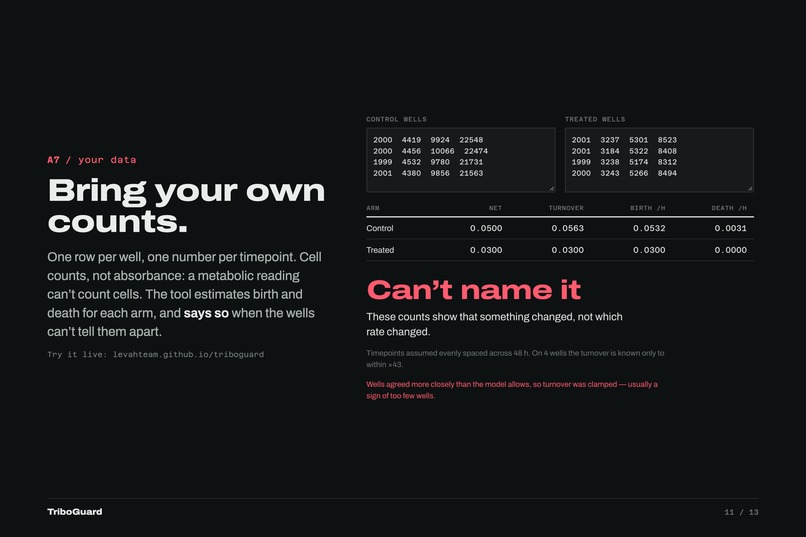
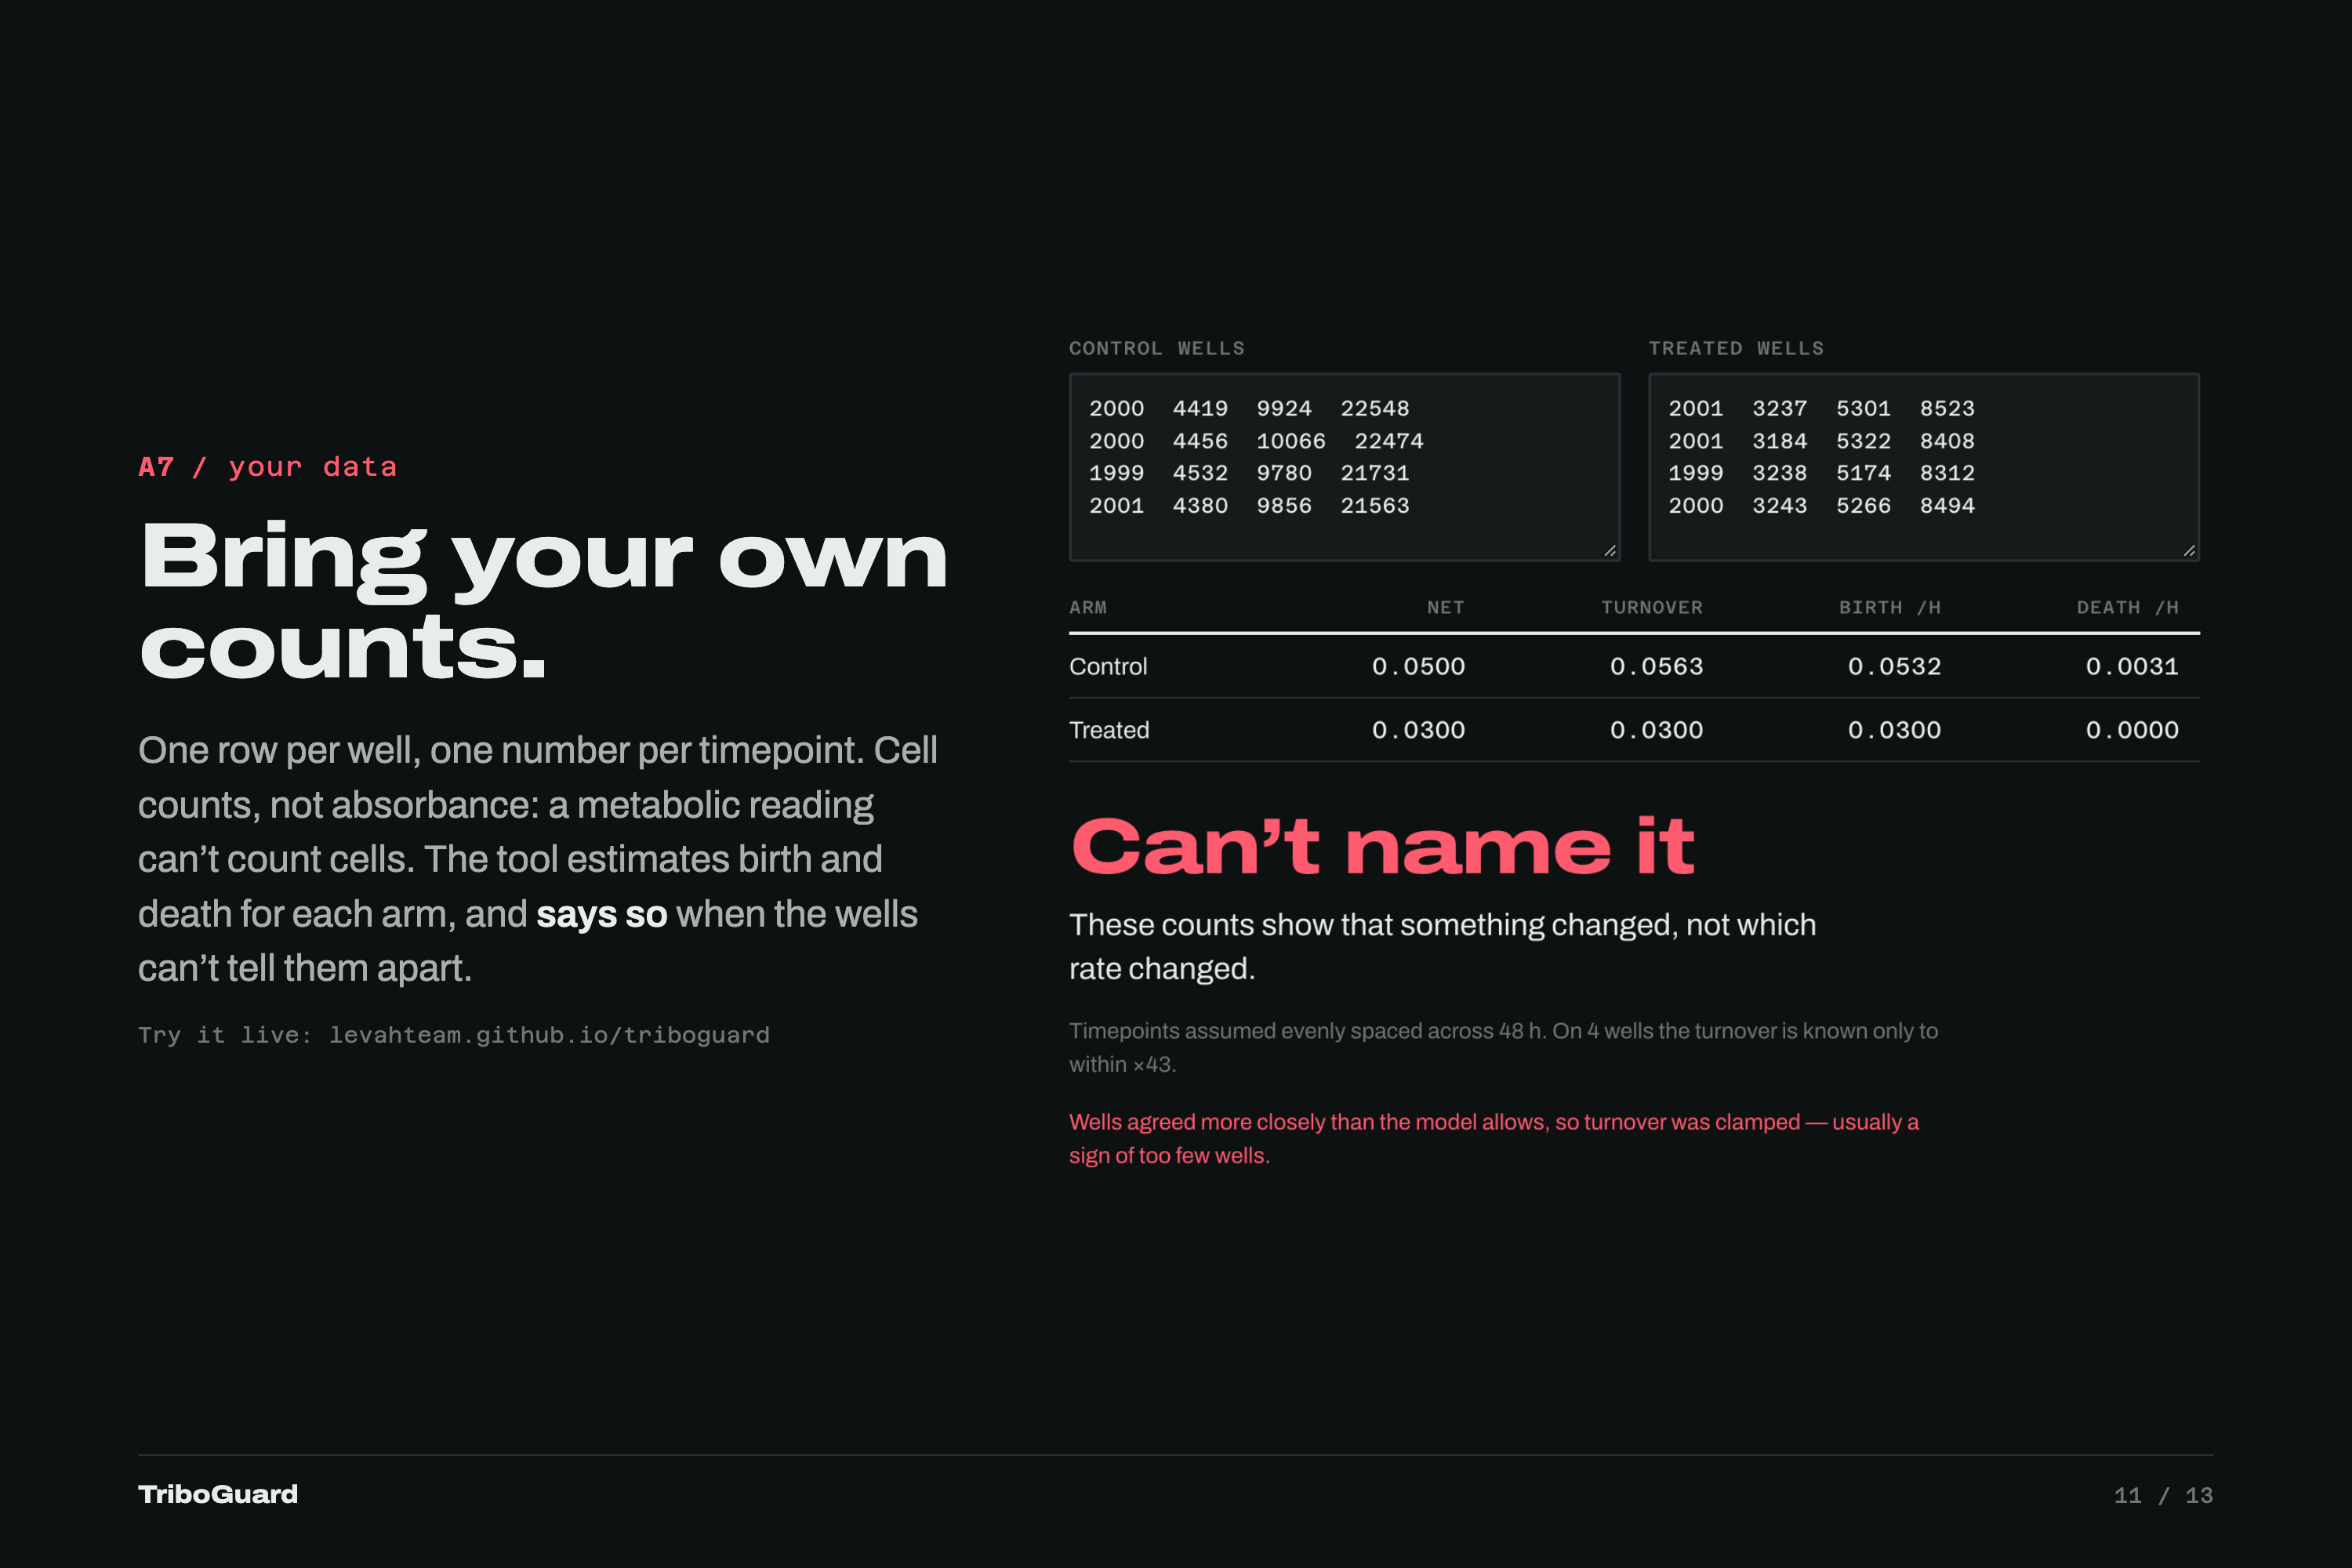
Paste cell counts per well and the tool estimates birth and death rates, or says so when the wells can't tell which rate changed.
-
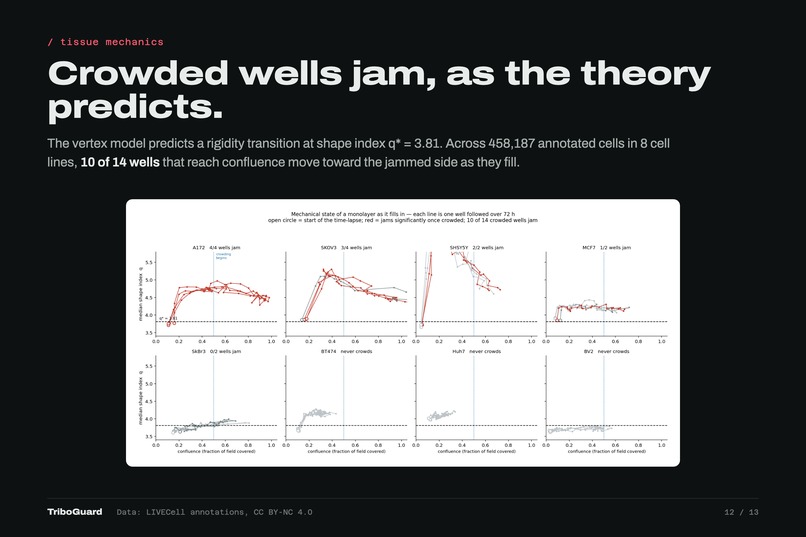
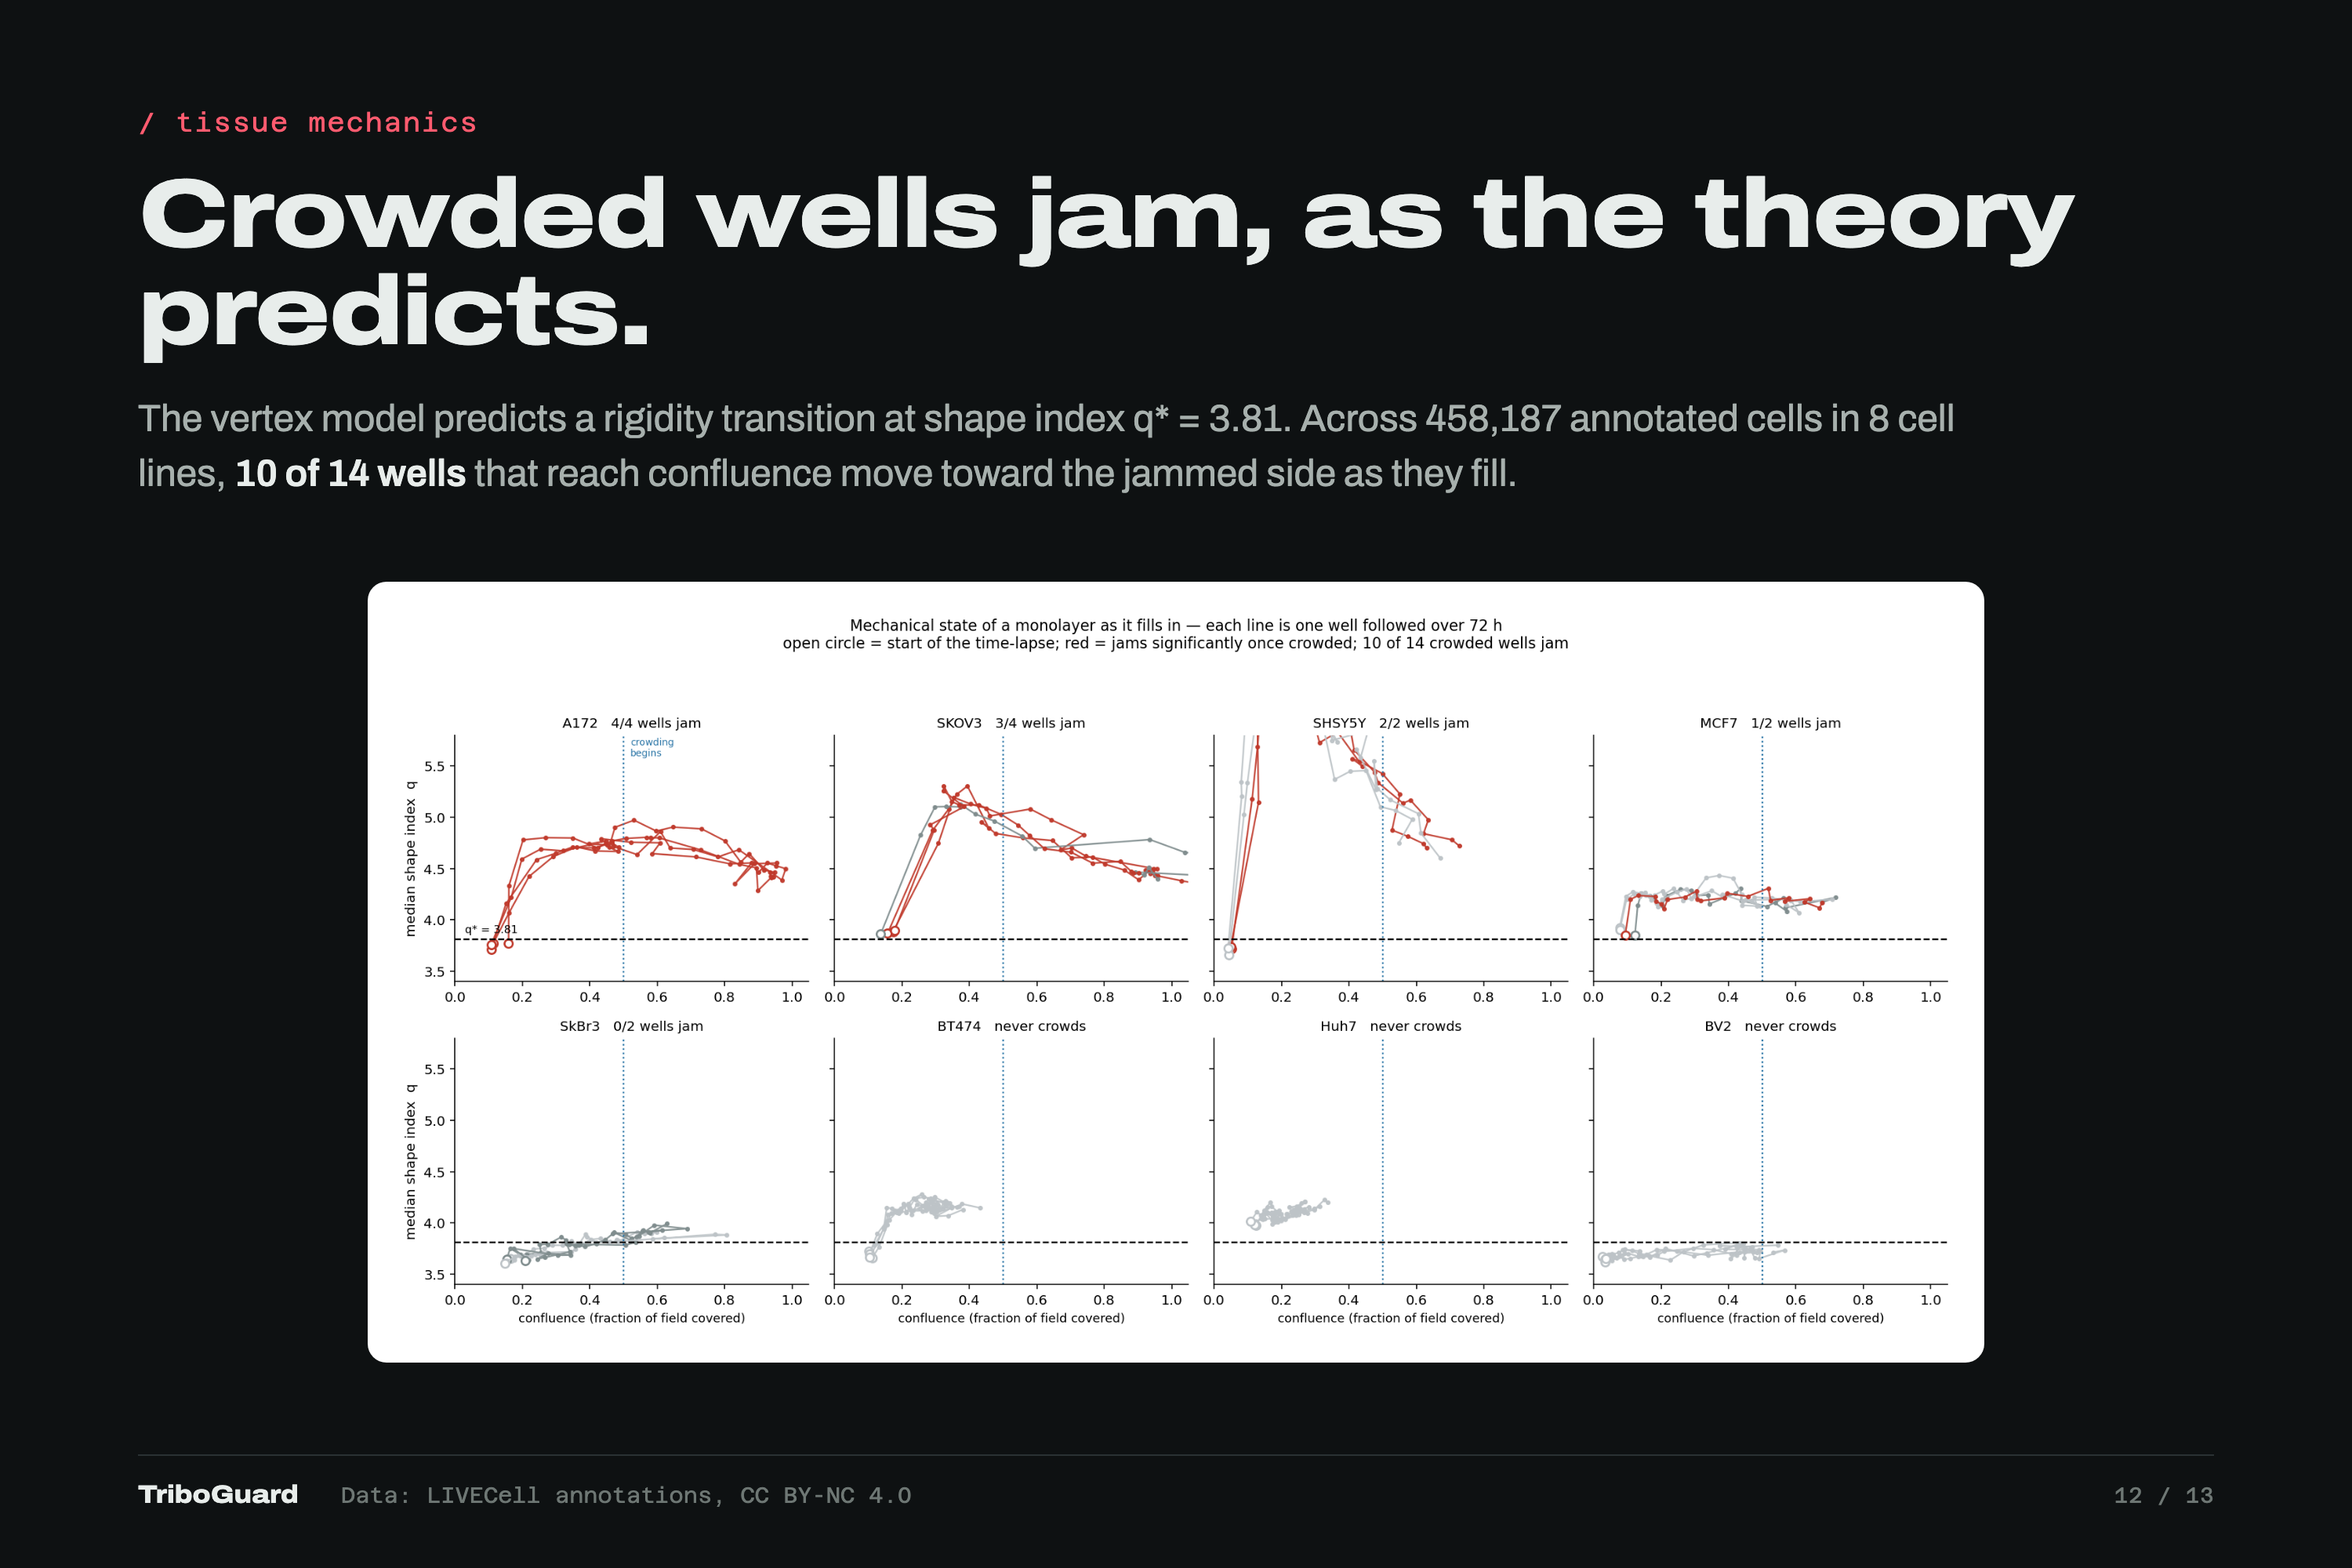
Crowded wells jam as theory predicts: across 458,187 cells in 8 cell lines, 10 of 14 wells reaching confluence move toward the jammed state.
-
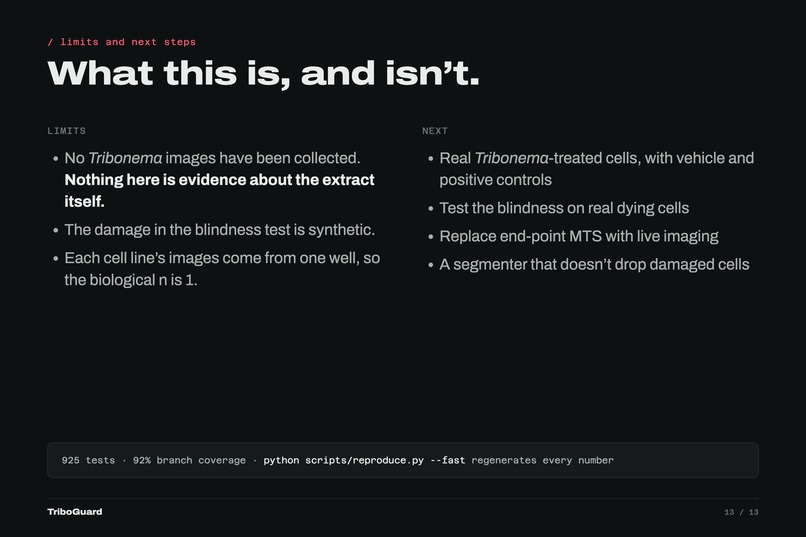
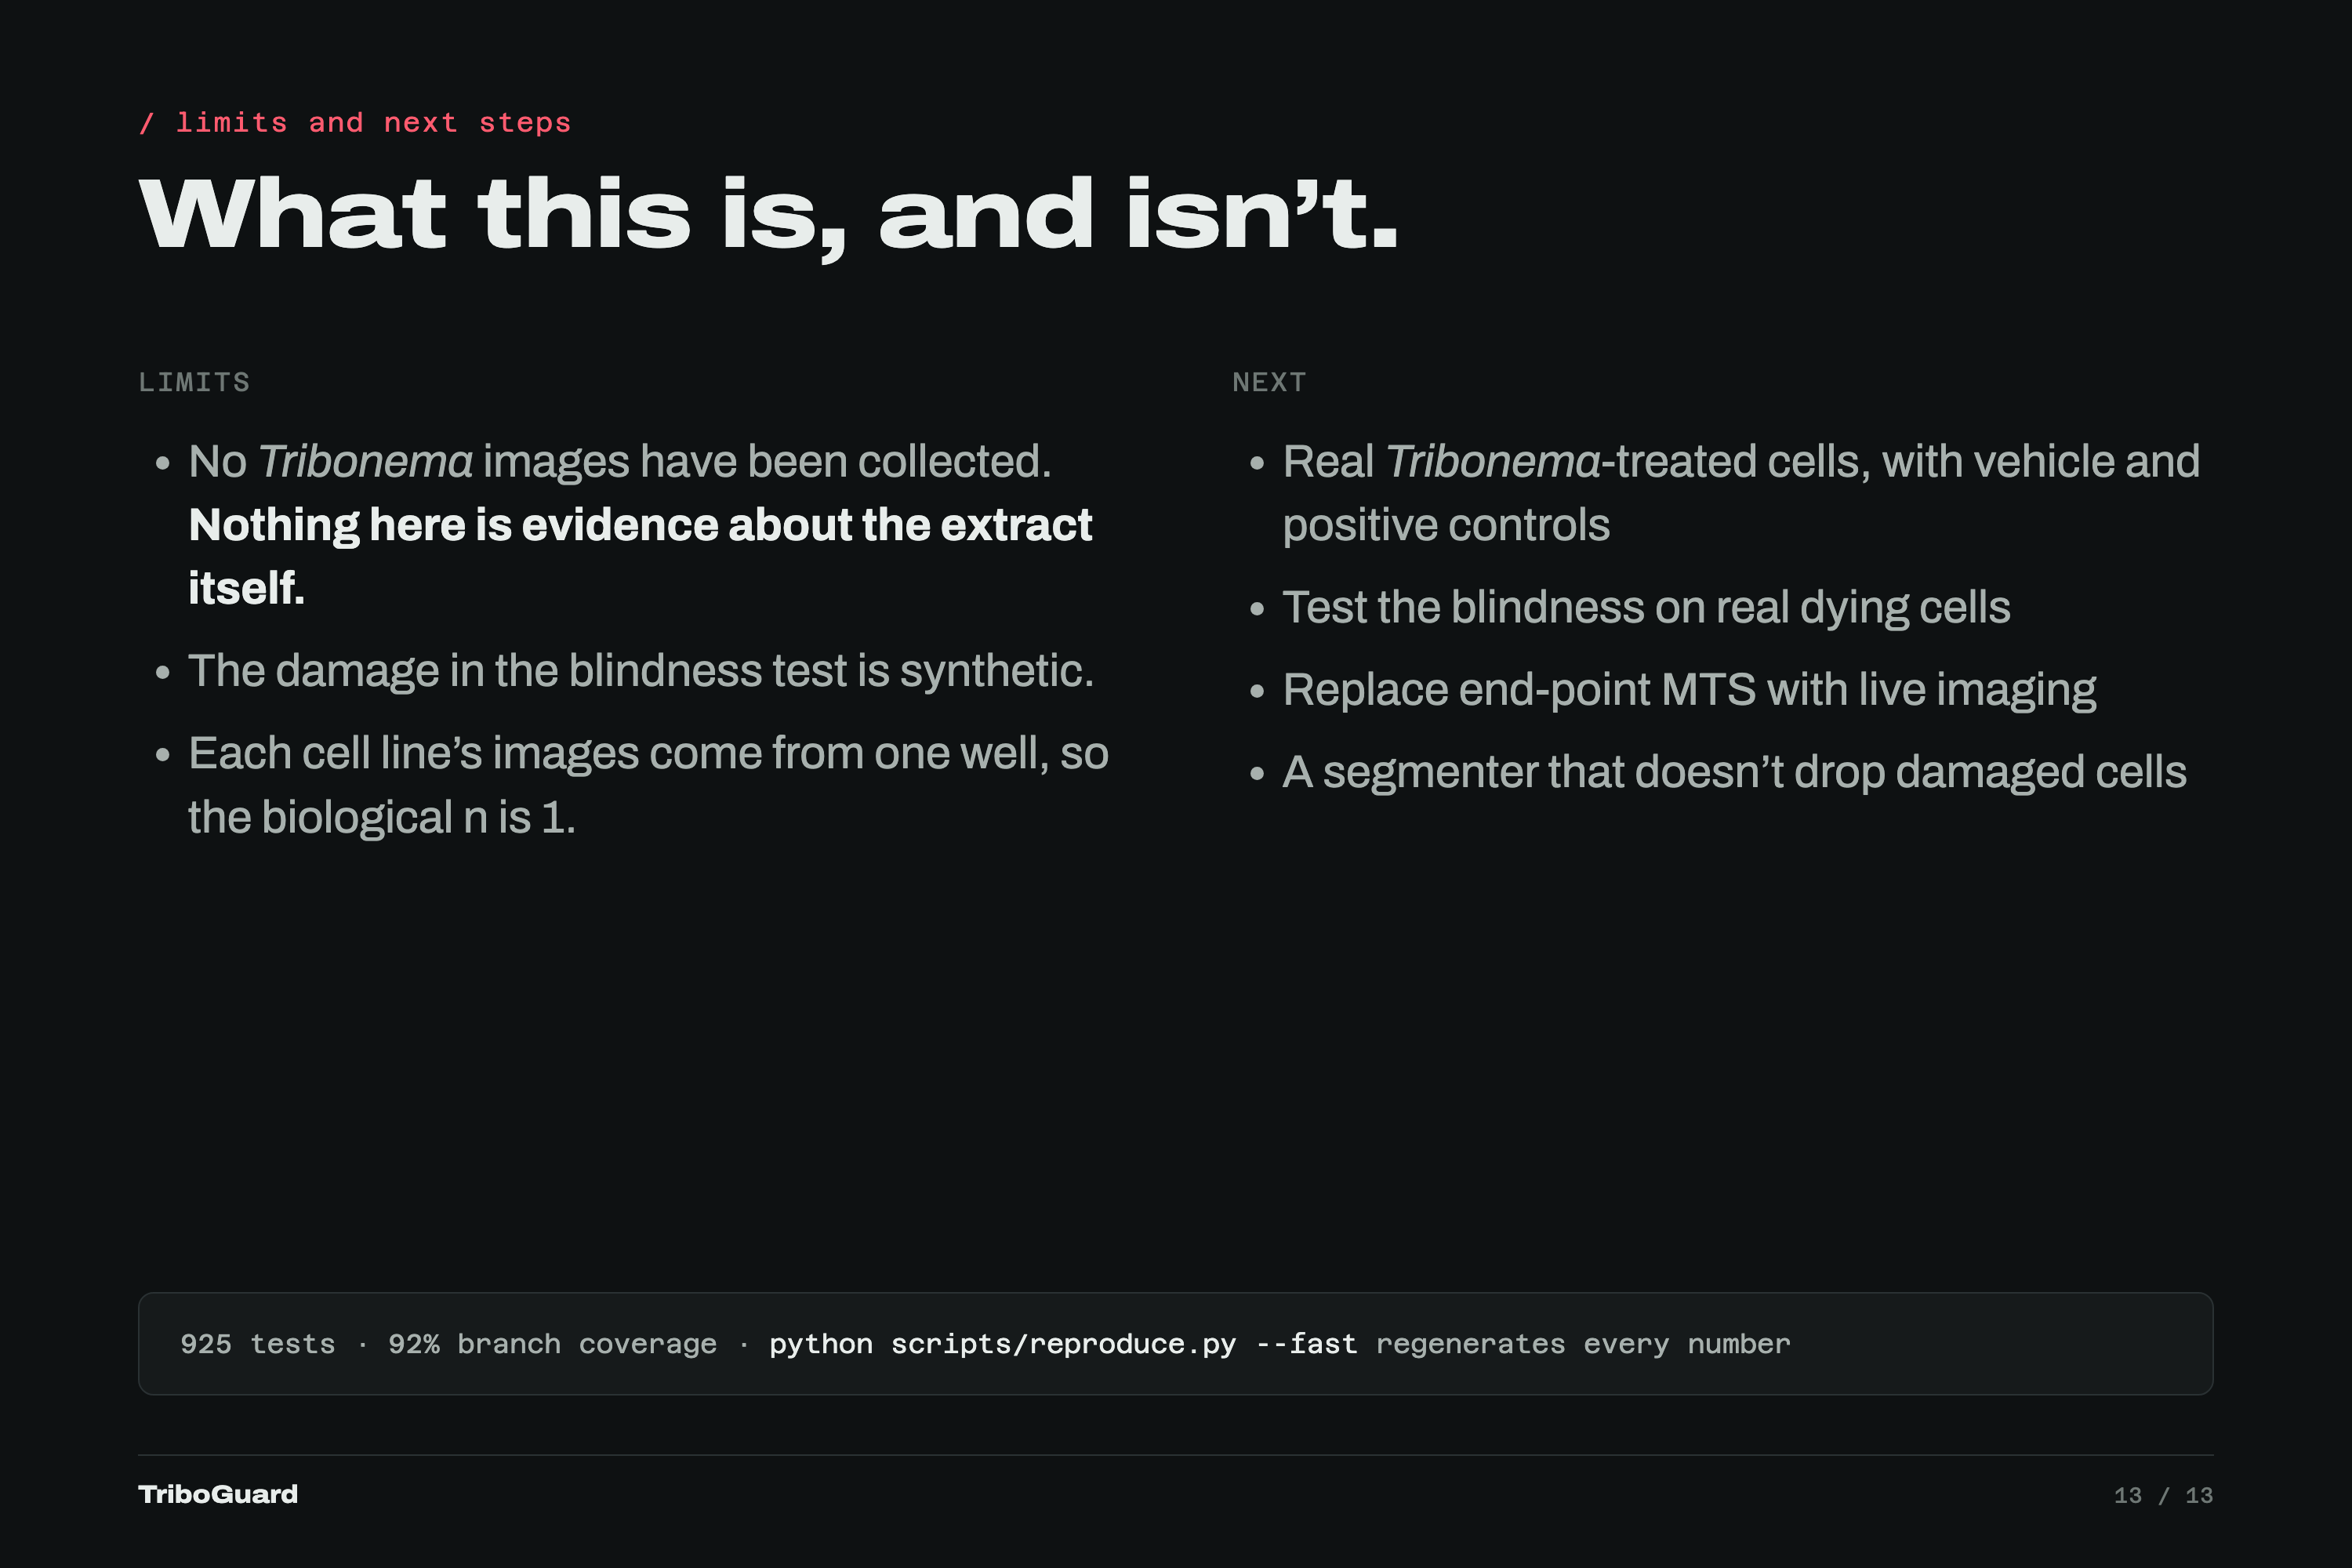
No Tribonema images yet, the damage is synthetic, and each line is one well. Next: real treated cells, live imaging, and a better segmenter.
TriboVision AI
Helping researchers learn what an experiment can truly prove before a promising result becomes an expensive mistake.
Inspiration
The most dangerous error in research is not always one that crashes the software. Sometimes it produces a believable number.
Misleading cell-viability results can consume scarce time and funding. They may also lead to unnecessary follow-up, including animal studies.
A 2022 student study reported that an extract of Tribonema, a freshwater yellow-green alga, reduced the MTS viability signal of RAW264.7 cells by 40%, spared normal lymphocytes, and caused a specific kind of cell death. I originally set out to build a microscope pipeline that could test those claims using new images.
Before collecting any images, I asked a more basic question:
Which conclusions could the original experimental design support at all?
That question changed the direction of the project.
What it does
TriboVision AI has two connected parts: TriboGuard examines what an experimental design can support, while the vision pipeline turns phase-contrast images into quantitative measurements.
TriboGuard checks what an assay can distinguish
In the endpoint MTS setup analyzed here, the plate reader reports one aggregate signal per well. That signal alone cannot distinguish between cells being killed and cells growing more slowly.
Under a simple birth-death model with independent cells, constant rates, and a signal proportional to cell number, cells divide at rate b and die at rate d. The expected cell count depends only on the difference between those rates:
$$ \mathbb{E}[N(t)] = N_0 e^{(b-d)t} $$
This means cell killing and slowed division can produce the same average curve.
Variation between replicate wells contains additional information because it depends on the sum of the two rates:
$$ \operatorname{Var}[N(t)] = N_0 \frac{b+d}{b-d} \left( \exp\big(2(b-d)t\big) - \exp\big((b-d)t\big) \right) $$
The mean alone cannot identify both rates. When replicate-level variation and the model assumptions are adequate, TriboGuard computes the rates or ranges compatible with the observations. If the available data cannot separate the possible mechanisms, the tool shows which explanations remain and suggests an additional measurement that could help resolve them.
Under the tool's stated assumptions and using the measurements reported in the 2022 study, two of seven evaluated conclusions were identifiable from the design. A no-killing simulation also reproduced the reported pattern. Slowed division alone produced a 40% reduction in the modeled RAW264.7 signal without reducing the modeled signal for non-dividing lymphocytes. This does not establish what happened biologically. It shows that the original design did not rule out an alternative explanation.
The vision pipeline analyzes cell images
The second part of TriboVision AI turns phase-contrast images into measurements. It includes:
- A U-Net semantic segmenter trained on the public LIVECell dataset
- Cell-shape measurements
- Dose-response fitting
- A test of whether cell shape tracks viability
- Comparisons between cell-shape trends and a vertex-model prediction
The shape index is calculated as:
$$ q = \frac{P}{\sqrt{A}} $$
The analysis compares population trends with the model-associated reference value:
$$ q^{\star} \approx 3.81 $$
Shape index is a model-motivated proxy. It is not a direct measurement of stiffness or tissue jamming. The current U-Net also produces semantic masks, so reliable per-cell biological interpretation will require better instance separation.
No real Tribonema images have been collected yet. Nothing in this project shows whether the extract kills cells. TriboVision AI provides tools for testing that question more rigorously.
Why it matters
Misleading results can consume months of work before researchers discover that the original experiment could not answer the question being asked. TriboGuard moves one important check to the beginning. At that stage, improving a design may require only a few additional wells.
TriboGuard is free, open source, and runs locally in a modern web browser without an installation or dedicated server. A student or small laboratory can use it on an ordinary laptop. This access matters most in communities where research funding and specialized computing resources are limited. It may be especially useful for groups screening locally sourced plant or algae extracts with the same kinds of viability assays that inspired this project.
I have not yet shown that TriboGuard changes decisions in real laboratories. My next step is to pilot it with student and university labs, starting in my community. I plan to publish learning materials and document how researchers use the tool to improve their study designs.
My goal is not to tell researchers what result they should obtain. It is to help them understand what their experiment can honestly establish before they invest more time, funding, or biological material.
How I built it
- Python and PyTorch: Two command-line tools,
tribovisionandtriboguard, were developed and trained on a single Apple silicon laptop. - LIVECell: The vision work uses 458,187 hand-outlined cells across eight cell lines.
- Well-separated data splits: I rebuilt the LIVECell split so that no well appears in both training and validation. Every image is also SHA-256 hashed, and training stops if known well overlap or exact duplicate leakage is detected.
- Cellpose baseline: Cellpose serves as an off-the-shelf instance-segmentation comparison and was not trained on my data.
- Statistical modeling: TriboGuard uses the closed-form chi-squared distribution of a sample variance. Under user-provided cost assumptions, it compares possible follow-up measurements and suggests the lowest-cost option.
- Browser implementation: The interactive site uses TypeScript, React, Tailwind, and Recharts and is deployed on Cloudflare. It runs the same calculations as the Python package in the browser with no backend.
- Cross-implementation checks: Lookup tables are generated from the Python code, and 66 tests ensure that the browser and Python implementations agree. Continuous integration fails if they drift apart.
- Preregistered predictions: Predictions and reporting rules were committed as JSON before the relevant analyses ran.
- Software quality: The project has 925 tests with 92% branch coverage, plus pytest, ruff, mypy, uv, a locked environment, and continuous integration. These checks support software reliability but do not replace scientific validation.
- Reproducibility: Running
python scripts/reproduce.py --fastregenerates every reported number.
Read the preregistration | [Review CI and coverage]https://github.com/LevahTeam/triboguard/actions)
Challenges I ran into
The hardest bugs did not crash anything. They produced wrong numbers that looked believable.
A model that appeared to fail
An early model scored 0.68 Dice during training and 0.001 during validation. The same checkpoint scored 0.739 in training mode. BatchNorm's running statistics had not stabilized at a batch size of 2 to 4, so the model predicted background everywhere in evaluation mode. Replacing BatchNorm with GroupNorm raised the validation Dice to 0.951. A test now checks that the two modes agree.
Silent data corruption
In my Apple silicon training environment, masks became NaN during a nonblocking transfer from unpinned memory while the model outputs remained finite. Training still completed and reported a plausible score. Disabling that transfer path removed the failure, and I added a finite-value test to catch it if it returns.
Leaky validation data
In the dataset version I analyzed, the official LIVECell training and validation files shared wells across 22 acquisition groups. I rebuilt the split so that a well could appear on only one side.
A flattering baseline
I first compared my model with a classical Otsu threshold that scored 0.425 Dice. However, the frames were 59% cell, and labeling every pixel as cell already scored 0.710. That was the honest baseline. On the well-separated semantic-segmentation split, my U-Net scored 0.951 Dice.
The instance score was only 0.046. Even a perfect semantic mask reached only 0.168 after the same instance-conversion step. This identifies a limitation in that representation and post-processing pipeline. More training alone will not solve it.
Hypotheses that did not survive
I preregistered two explanations for why the shape-index result varied by cell line. One focused on cell size, and the other focused on biological spread. Both were refuted by the next cell line. A signal-to-noise explanation held up and predicted the observed correlation across 12 cell-line and method combinations at Spearman $\rho = 0.930$.
Each failure became a test, a documented withdrawn claim, or a preregistered rule so that the same mistake would be harder to repeat.
Accomplishments that I am proud of
- A prospectively confirmed prediction: Before measuring three of four cell lines, I predicted that segmenters would miss synthetically damaged cells. The prediction held in all three held-out cell lines. In a synthetic-damage benchmark using 34,129 hand-outlined cells, Cellpose detected 85% to 97% of undamaged cells and no more than 5% of damaged cells in the same images. This result has not yet been validated on experimentally dying cells.
- Shape analysis at scale: I analyzed 458,187 annotated cells across eight cell lines. In 10 of the 14 wells that reached confluence, the population shape index moved in the direction predicted by the selected vertex-model comparison. This is a comparison with a model-derived proxy, not a direct mechanical measurement.
- Concrete design estimates: In the modeled scenario, three wells per condition constrained the birth-to-death split only to within a factor of about 146. Reaching a factor of two required about 66 wells.
- A written record of withdrawn claims: Claims that failed proper testing are documented rather than deleted.
What I learned
- Beat the trivial baseline, not the convenient one. A weak comparison can make a model look far better than it is.
- An average can hide what matters. In this model, information about the mechanism also appears in variation between wells.
- Write predictions down before seeing the result. That includes deciding how either outcome will be reported.
- Count independent samples honestly. Sixty images turned out to represent 33 fields of view from one well on one plate, so the biological sample size was one.
- Read the source material closely. ATCC classifies RAW264.7 as a macrophage/monocyte line, so describing it as a general mouse leukemia model would overstate what results from that line can show.
- Treat believable numbers as hypotheses, not guarantees. Tests, baselines, and reproducible analyses matter most when nothing appears to be broken.
What is next
- Validate the damage-detection result using experimentally dying cells, since the current damage experiments are synthetic.
- Collect real Tribonema images with vehicle controls, positive controls, and an independent viability measurement.
- Separate experiments by plate and day so that biological replication is honest.
- Replace endpoint MTS measurements with live imaging.
- Build an instance segmenter that does not discard the damaged cells that may contain the most important evidence.
- Pilot TriboGuard with student and university laboratories in my community.
- Publish tutorials and record what pilot users change in their experimental designs.
- Expand access internationally after the local pilot establishes what support researchers need.
TriboGuard began with one student study and one uncomfortable question: What can this experiment truly prove? I want that question to become easier for any researcher to ask before a promising result becomes an expensive mistake. By making rigorous design checks accessible to students and small laboratories, I hope to help build a scientific community where small budgets and bold ideas can create miracles.


Log in or sign up for Devpost to join the conversation.