-
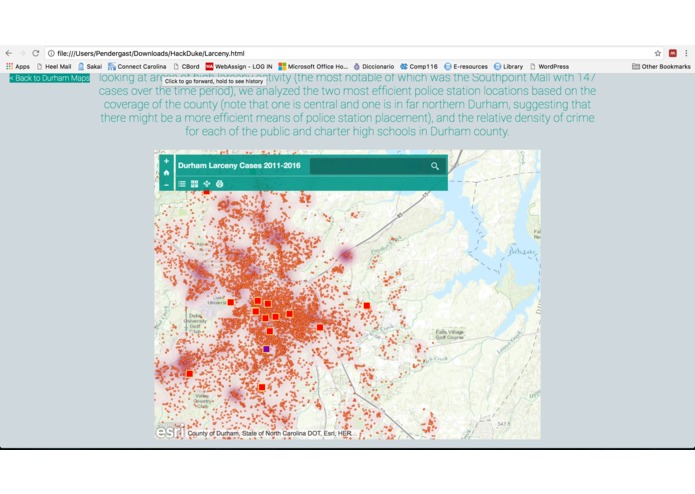
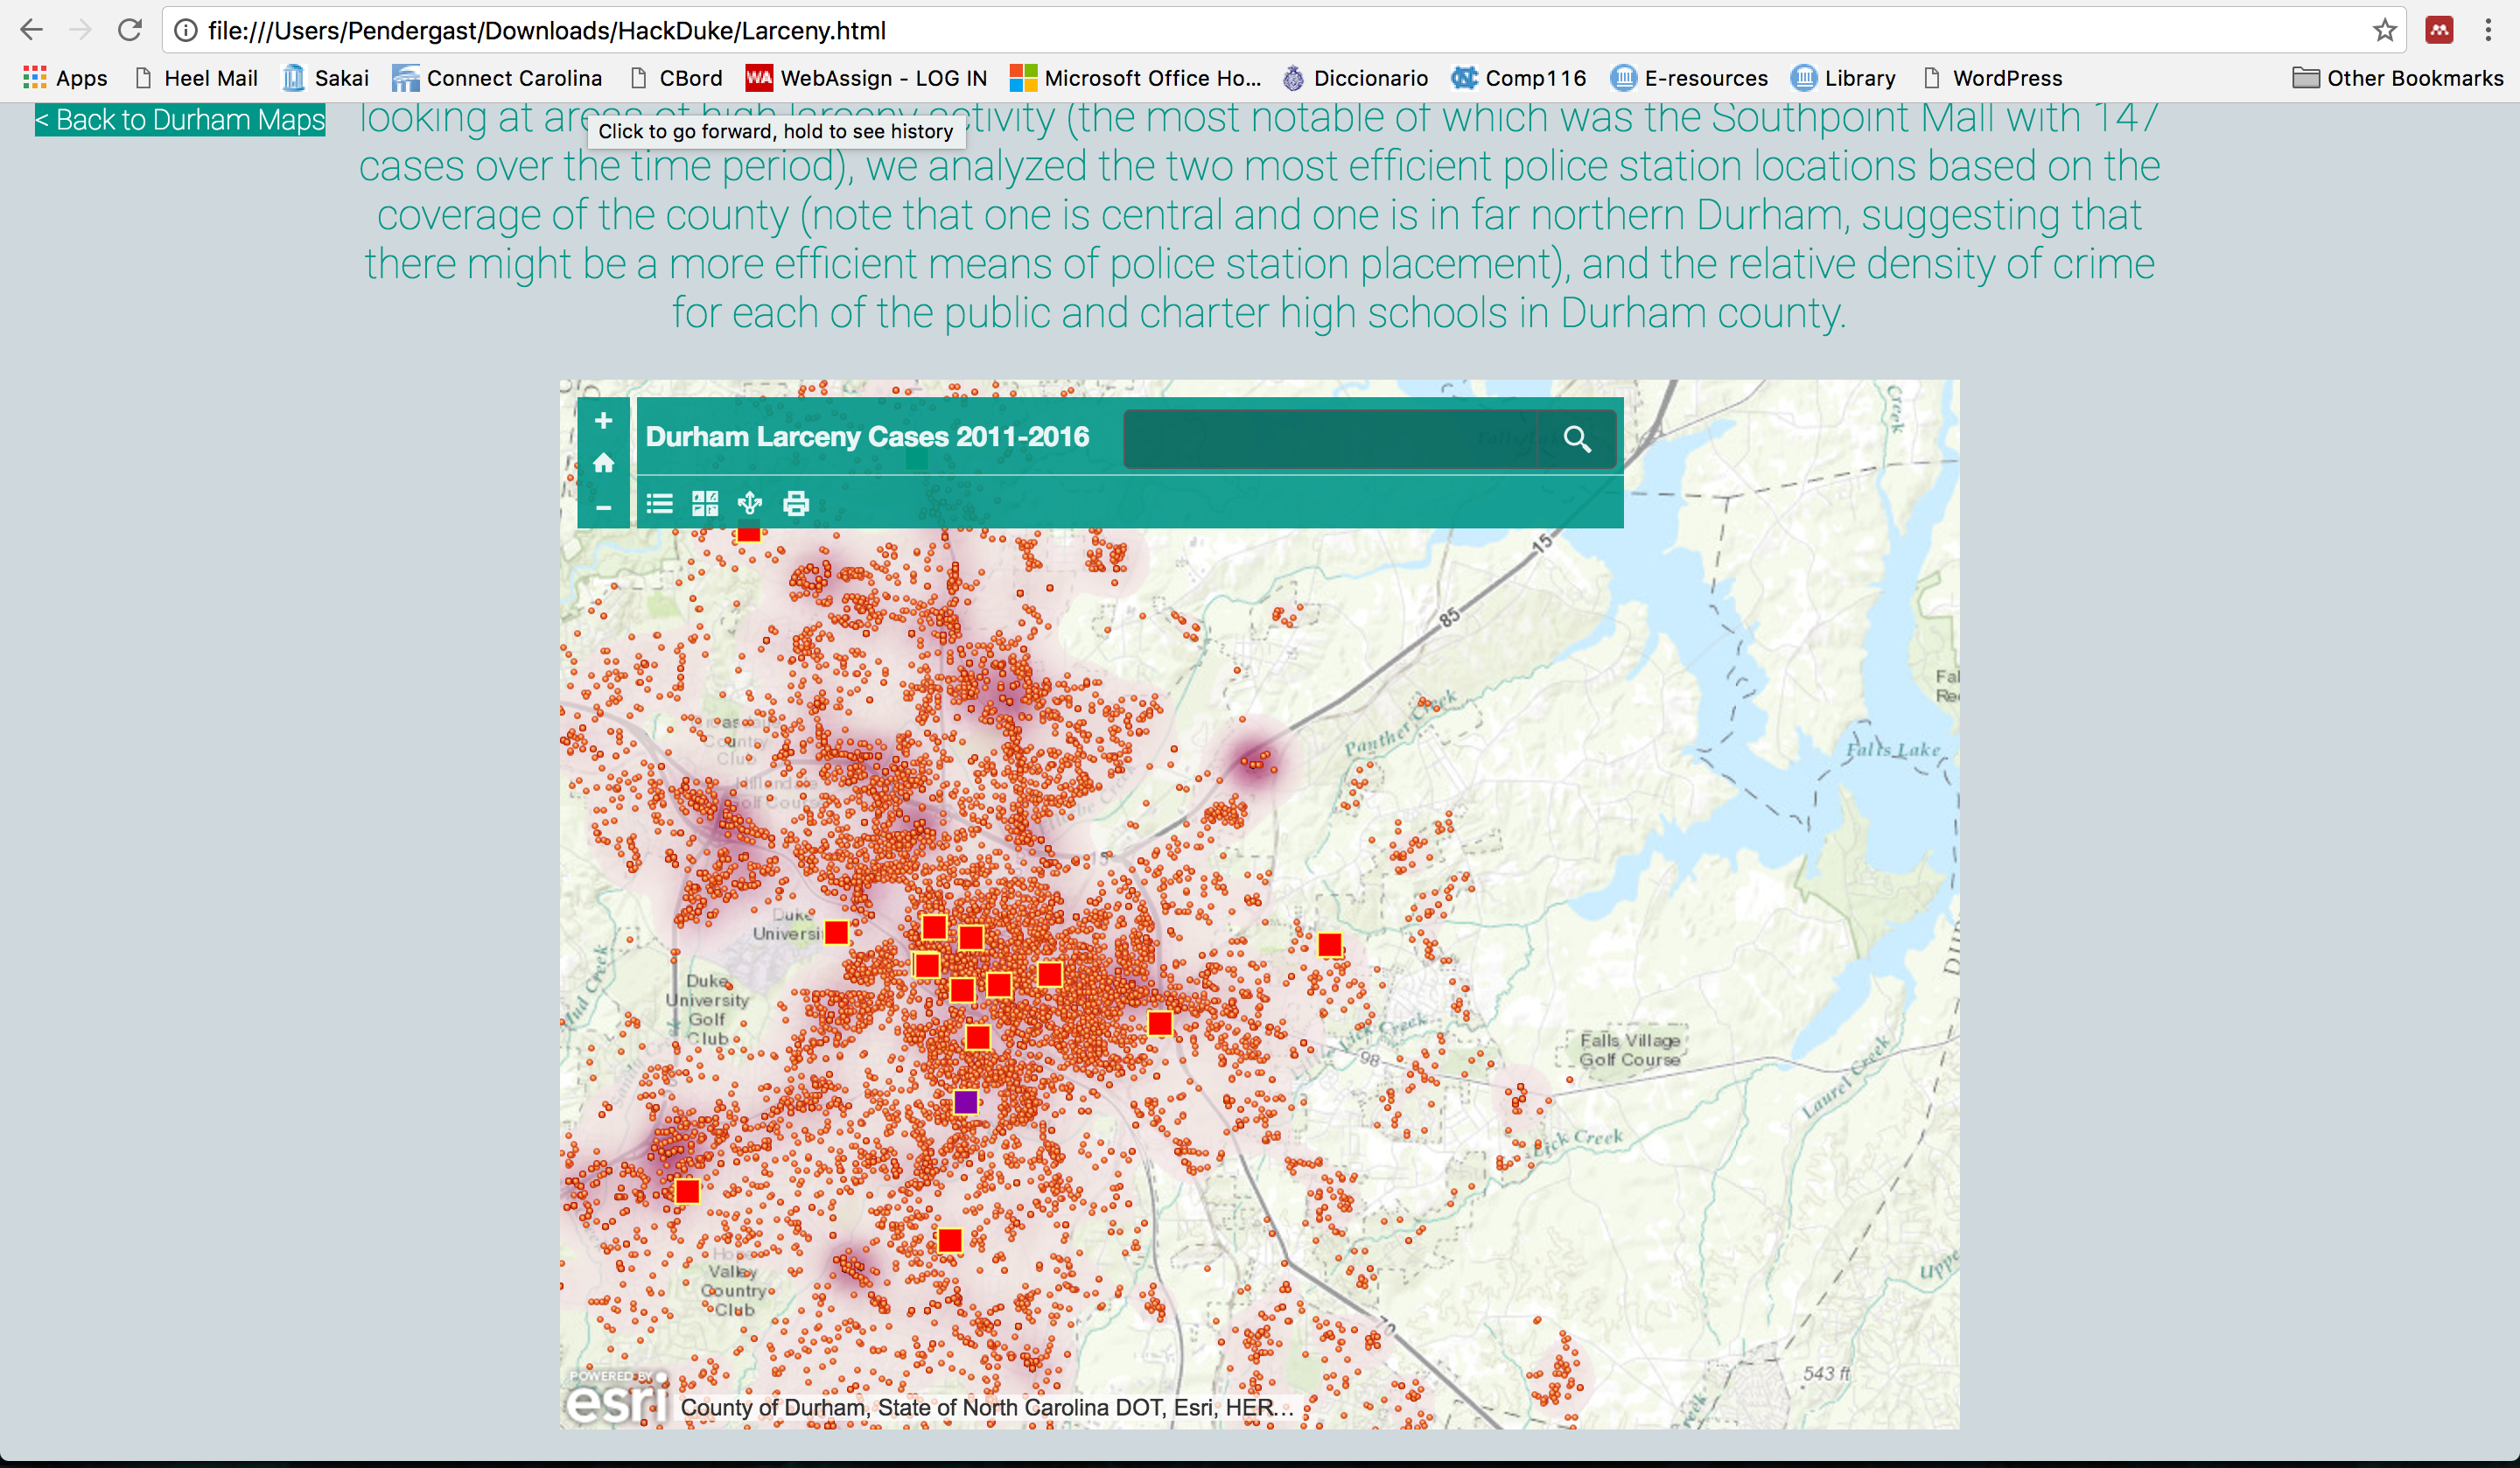
A Screenshot of Durham Larceny Case Data
Inspiration
We wanted to help the local community in the most efficient way possible by analyzing trends and patterns with reference to crime data and important community data in order to develop a screenshot of the Durham area.
What it does
Using ArcGIS technology on the ESRI platform, we were able to create a tool that can visualize the intersectionality of multiple data points over a geographical region.
With the analysis of local crime, education, and city data we were able to extrapolate and optimize key locations around the Triangle such as Police Stations, Churches, and Fire Stations using this intuitive and powerful tool.
We decided to portray these data through these graphs not to suggest definitive solutions to the issue of resource misallocation within Durham county, but rather to demonstrate the reality that even the most basic of public services and resources inherently show bias towards different communities, thereby suggesting that more concrete answers must be developed in the future to address the issues of social inequality.
How to Use
To use the web application, download the folder as a zip file from google drive, extract and run MainPage.html in Chrome.
How we built it
We developed multiple sets of data after which we ran coordinates for crimes, buildings, and other data points through the esri platform to develop interactive map platforms through which the user can explore the various elements of intersectionality with reference to the Durham area.
Challenges we ran into
One issue we ran into was the parsing of data into a usable form, particularly as we attempted to expand the range of our website to the Chapel Hill and Raleigh Areas.
Accomplishments that we're proud of
One particular accomplishment of which we are proud is the learning and utilization of the esri API with dynamic data points to demonstrate the background of intersectionality of social elements.
What we learned
Throughout the process, we learned primarily how to utilize the esri API platform, css implementation of HTML and Javascript, and the parsing of large databases utilizing python. Furthermore, we were able to flesh out our skills at web developing by creating a robust user interface in terms of map interactivity and general aesthetic.
What's next for Triangle Public Data
Moving forward, we intend to host the website externally and expand the data to include information for the Chapel Hill and Raleigh areas.
Log in or sign up for Devpost to join the conversation.