-
-
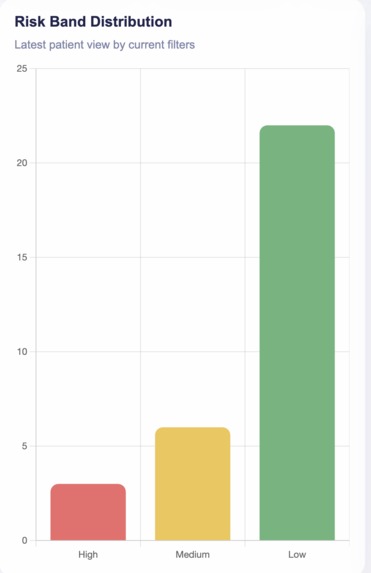
Risk Distribution
-
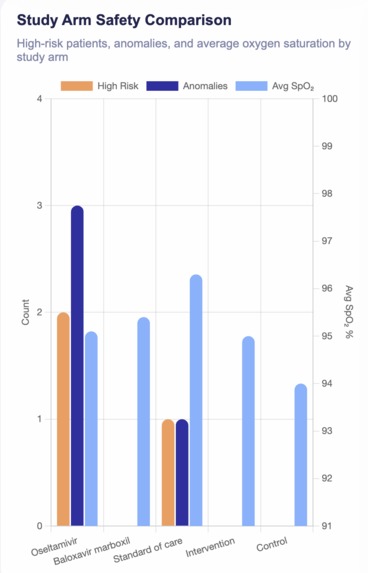
Drugs Safety Comparison
-
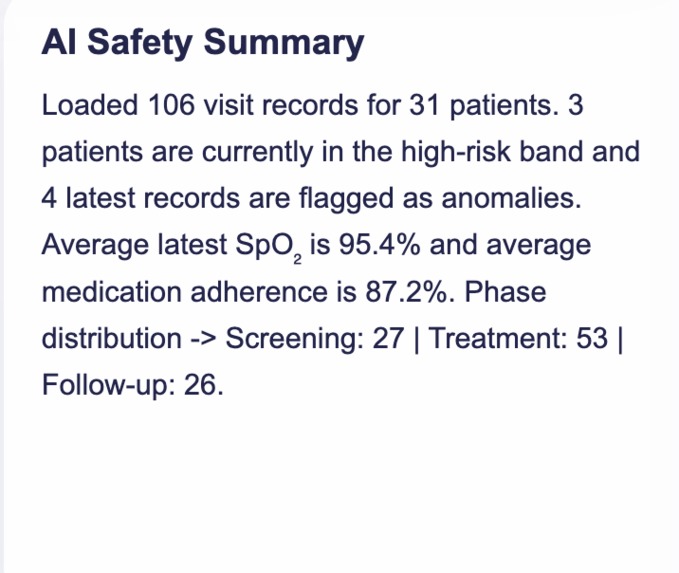
AI Summarizer for entire dataset
-
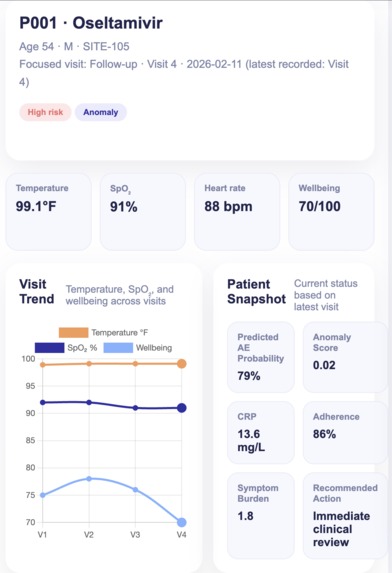
Dashboard
-
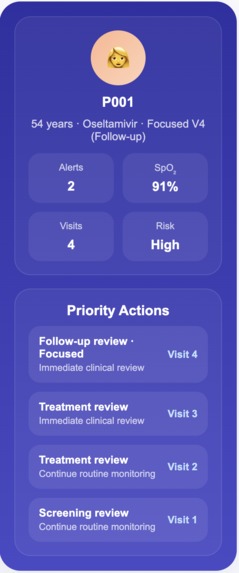
Patient Info
-
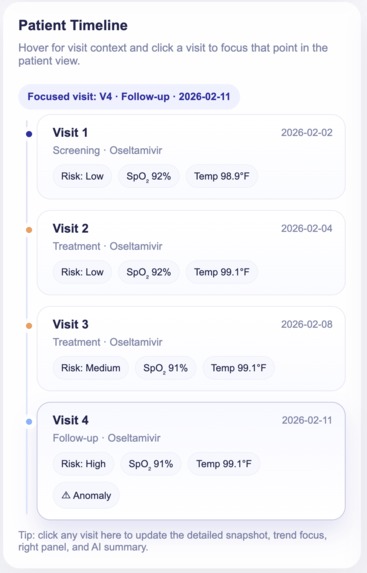
Visit Timeline for Patient
-
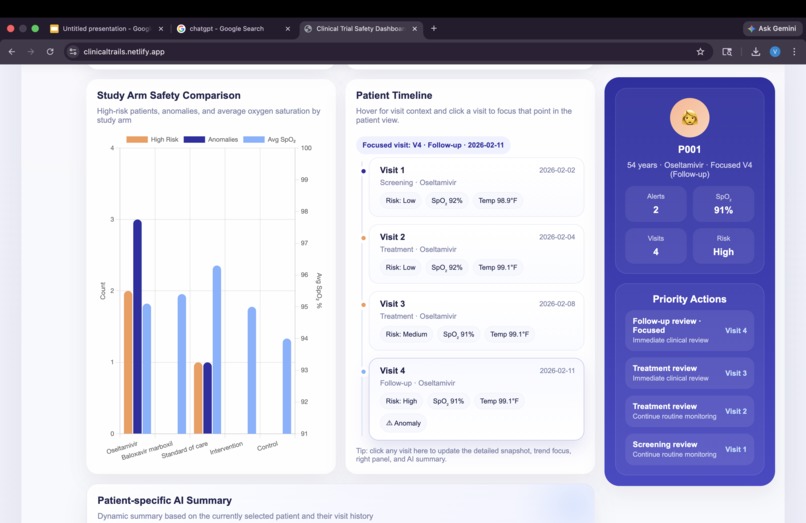
Overall Look


Clinical trials generate massive amounts of patient data across multiple visits, including vitals, lab results, and symptoms. However, researchers often struggle to quickly identify safety risks and evaluate drug efficacy due to fragmented and complex datasets. It turns data into decisions and decisions into action We created a complete pipeline: Data → Processing → ML → Visualization → AI Insights Few issues we ran into: Handling messy and incomplete clinical data Integrating multiple data types (vitals, lab, symptoms) Designing a UI that is both simple and informative Built a full end-to-end working system (not just a concept) Successfully integrated: ML + anomaly detection + LLM Designed a clean, interactive dashboard What we learned: Importance of data quality in healthcare systems How to combine AI + visualization for real-world impact Building systems that are interpretable, not just accurate What's next for TrialGuard Real-time integration with clinical trial databases (EHR systems) Mobile-friendly dashboard for clinicians Advanced predictive models for early risk detection
Built With
- css
- dashboards
- eda
- flask
- html
- javascript
- llm
- ml
- python
- visualizations
