🌟 Inspiration
TrendTrackr was inspired by a passion for open-source and the desire to uncover hidden stories behind GitHub activity. GitHub is a vibrant community where millions of developers come together to create, share, and innovate. We wanted to build a solution that could help us understand these dynamics: which repositories are trending, which languages are growing, and who are the top contributors driving innovation. With the power of Microsoft Fabric and Azure services, we set out to build a comprehensive analytics tool to provide insights into the evolving ecosystem of GitHub.
📚 What We Learned
This journey taught us many lessons in data engineering, cloud services, and the power of real-time analytics:
- We mastered the integration of GitHub Actions for automated, real-time data collection, exploring how to seamlessly fetch GitHub events.
- Leveraging Azure Data Factory and Dataflow Gen2 for efficient ETL (Extract, Transform, Load) operations helped us understand how to bring agility and reliability to our data pipeline.
- We explored Microsoft Fabric Notebooks for deeper data analysis, crafting SQL queries that converted raw event data into actionable insights.
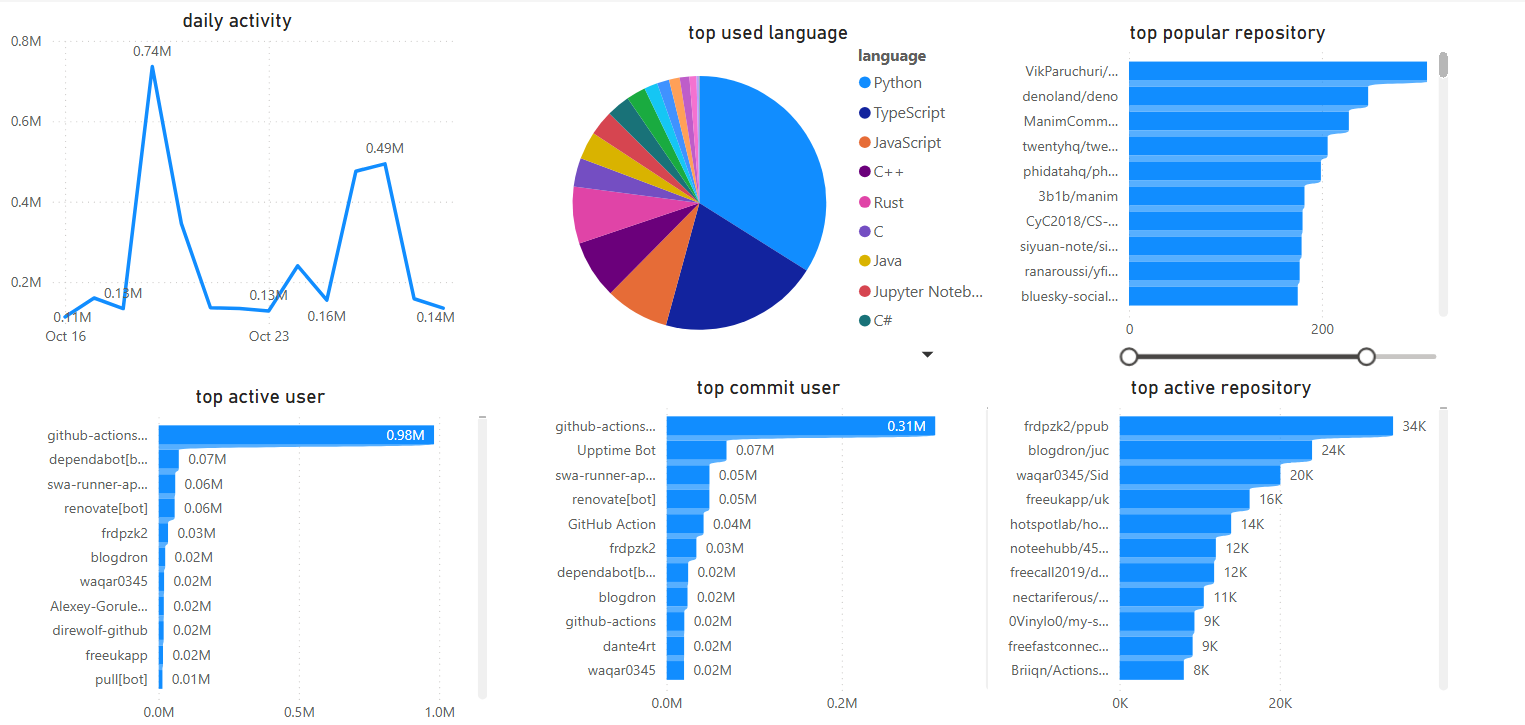
- Finally, Power BI became our visual storytelling tool, where we learned how to make data come alive for end-users, enabling everyone to see the story behind the code.
🛠 How We Built It
Data Collection:
- GitHub Actions were configured to collect GitHub event data, such as pushes, pull requests, and trending repositories, on an hourly basis.
- The raw data was loaded into Azure PostgreSQL, providing a structured and reliable foundation for the analysis to come.
Data Synchronization and Preprocessing:
- We set up an Azure Data Factory pipeline, using Dataflow Gen2, to extract data from PostgreSQL and load it into Microsoft Fabric Lakehouse.
- In this step, we cleaned and transformed the data—removing noise and ensuring consistency—so that the subsequent analysis would be meaningful and reliable.
Data Analysis:
- The processed data was analyzed using a Microsoft Fabric Notebook. Here, we explored the rich activity data, including:
- Identifying event trends and seeing how community activity changed over time.
- Understanding top contributors who are making a difference in open-source projects.
- Examining repository activity, language popularity, and commit patterns.
- The analysis results were saved back into the Lakehouse, ready for further visualization.
- The processed data was analyzed using a Microsoft Fabric Notebook. Here, we explored the rich activity data, including:
Visualization and Reporting:
- Using Power BI, we connected to the Lakehouse to create intuitive and interactive dashboards.
- These dashboards transformed raw data into a visual story, making it easy to see which repositories are trending, which languages are gaining popularity, and how contributions evolve over time.
⚡ Challenges We Faced
Data Synchronization:
- Synchronizing data efficiently across Azure PostgreSQL, Data Lake Storage, and the Lakehouse was a complex but rewarding challenge. Setting up Azure Data Factory and Dataflow Gen2 required careful orchestration to ensure data consistency.
Real-Time Processing:
- Handling real-time data updates involved balancing between near-real-time ingestion and analysis. This required smart scheduling of GitHub Actions and Azure Data Factory Pipelines to keep everything synchronized.
Visualizing Complex Data:
- The challenge of making GitHub event data understandable and insightful for different audiences required thoughtful design in Power BI. We worked on selecting meaningful metrics, creating clear visual elements, and ensuring our insights were both accessible and impactful.
🏆 Accomplishments We’re Proud Of
End-to-End Automation:
- Successfully integrated an automated workflow using GitHub Actions, Azure Data Factory, and Microsoft Fabric to keep data up-to-date without manual intervention.
Real-Time Data Insights:
- We achieved near-real-time data collection and analysis, providing up-to-date insights into GitHub activity on an hourly basis.
Interactive Power BI Dashboards:
- Created dynamic Power BI dashboards that provided stakeholders with a comprehensive view of GitHub trends—enabling effective decision-making based on clear visual data.
Data Consolidation Across Sources:
- Managed to consolidate multiple data sources into a single Lakehouse structure, enabling consistent and reliable analysis across diverse data points, such as push events and trending repositories.
🚀 Conclusion
TrendTrackr showcases the powerful possibilities of analyzing GitHub event data, providing insights into community engagement, repository growth, and technology trends. By integrating Microsoft Fabric, Azure services, and Power BI, we created an end-to-end solution that turns GitHub activity into valuable insights.
Through this project, we learned not just about technology, but about the people behind open source—those who contribute, collaborate, and innovate. We hope TrendTrackr will be a stepping stone for more advanced analyses and inspire others to explore data-driven insights in the open-source community.
📈 Future Directions
- Expand Data Sources: Integrate additional data sources such as GitHub Issues and Discussions to gain a more holistic understanding of community activity.
- Machine Learning Integration: Use Azure's machine learning capabilities to build predictive models that can forecast trends in open-source projects.
- Community Dashboards: Build public dashboards that provide insights to developers about the projects they care about the most.
We invite you to explore TrendTrackr, see the insights for yourself, and even contribute to its future development. Together, we can make the world of open-source more transparent and insightful for all.
Built With
- azure
- fabric
- githubaction
- githubapis
- javascript
- postgresql
- powerbi
- pyspark
- python


Log in or sign up for Devpost to join the conversation.