Inspiration
As a college student, I saw how much of my free time went to streaming apps and how little I really knew about how I watched things. Streaming services keep that information, but they don't often show it to users in a useful way.
What it does
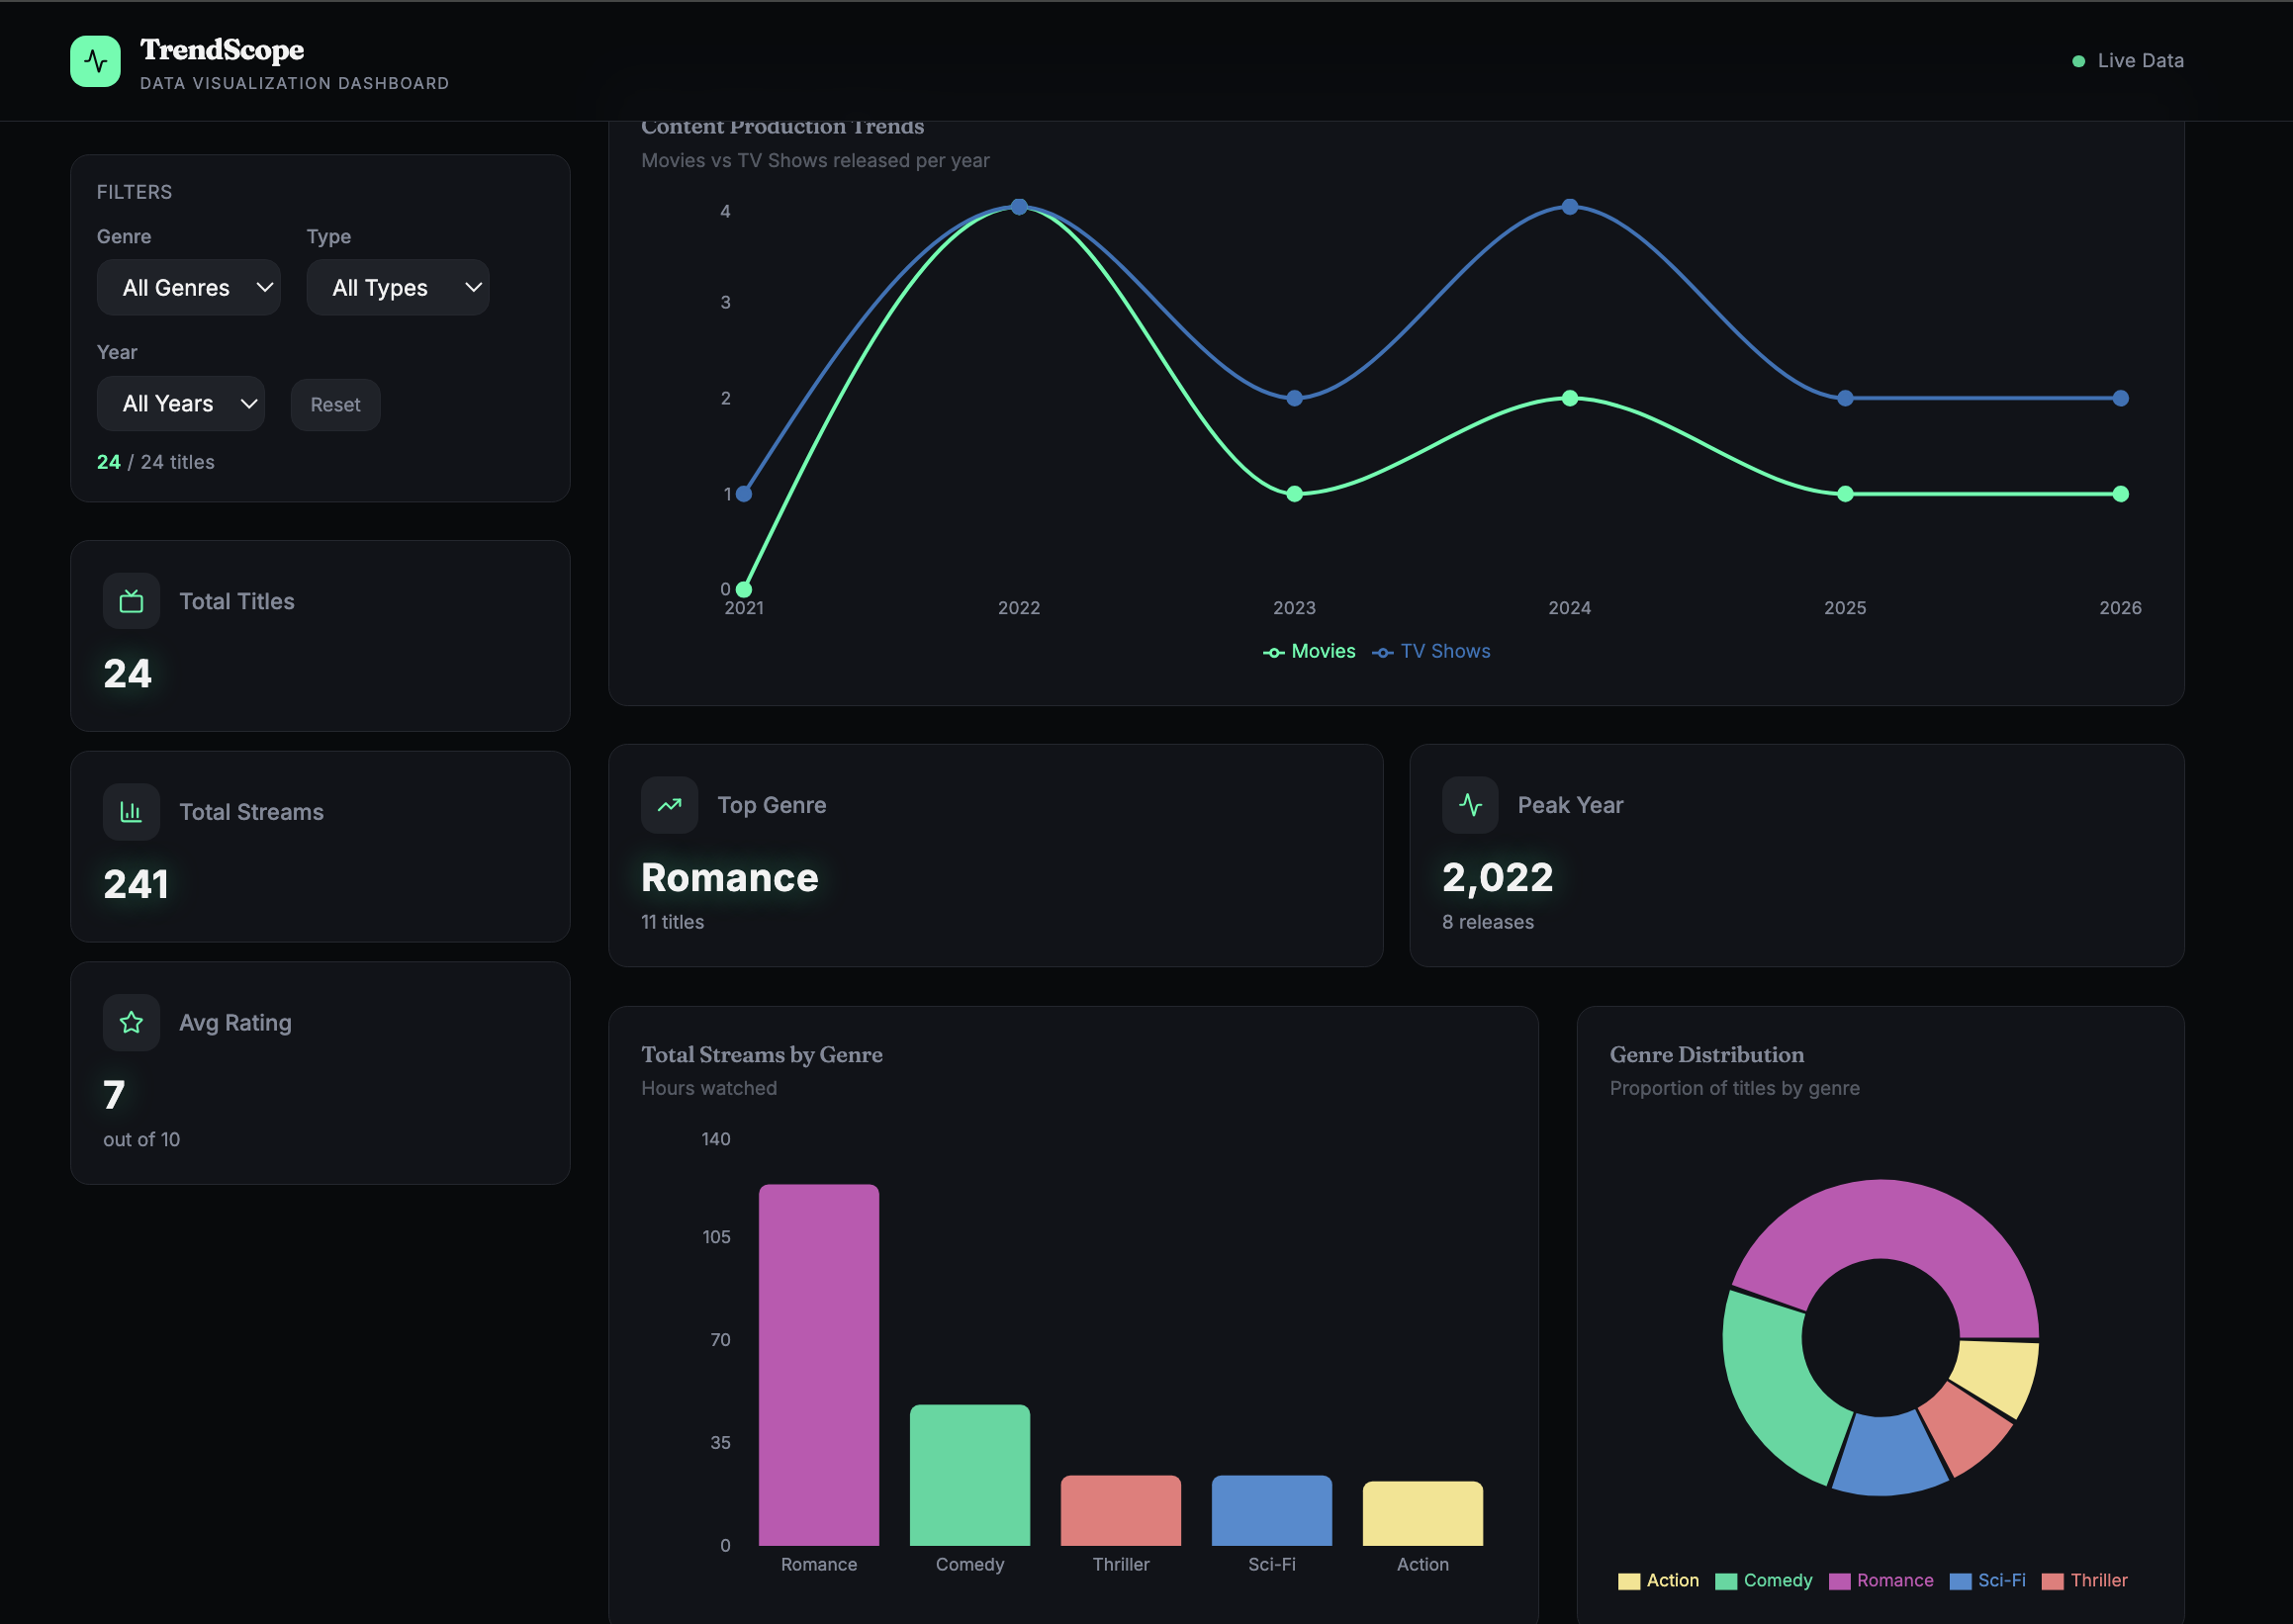
TrendScope is a dashboard for personal streaming analytics. It shows you exactly where your attention is going by showing you your viewing habits, such as the total number of titles watched, streams, hours per genre, regional breakdowns, and trend lines over time. You can use filters to break down the data by time range and category, which makes it easy to see patterns in what you really watch versus what you think you watch.
How I built it
- Frontend: React 18 + Vite 5 with TypeScript
- Styling: Tailwind CSS v3 with a custom semantic design token system, plus shadcn/ui components
- Data visualization: Recharts for the bar, pie, line, and regional charts
- Routing & state: React Router and TanStack Query
- Design system: Custom HSL-based color tokens, a refined typography pairing, and a simplified background to keep the focus on the data ## Challenges I ran into
- Making a look that isn't generic: It took a few tries with color, font, and background treatments to get rid of the default "AI dashboard" look.
- Color semantics for genres: Choosing easy-to-read, complimenting colors that worked for both bar and pie charts without clashing (light red for Thriller, pastel yellow for Action, etc.).
- Getting the data to the right size: The first numbers didn't seem real for a college student, so I changed the totals and per-genre stats to make them seem real.
- Reusability of components: Making the InsightCard, chart, and filter components flexible enough to be used again without worrying about style issues. ## Accomplishments that I'm proud of
- Design system with a consistent, customized design system that uses only semantic tokens; no hard-coded colors at all.
- Various types of charts that have a shared visual language.
- Dashboard design with an editorial and personal touch, instead of being too corporate.
- Modular components for better extendibility. ## What I learned
- How to design a real design token system with HSL variables instead of leaning on Tailwind defaults.
- Practical Recharts customization
- How small typography and color choices dramatically change a product's perceived quality.
- The value of iterating on UI in tight feedback loops rather than over-designing upfront.
What's next for TrendScope
- Real integrations of Netflix, Spotify, YouTube, and Prime Video watching history
- AI-driven recommendations (e.g., "You've watched 40% more thrillers during finals week")
- Comparison with your peers (e.g., "See how your habits compare to your friends'")
- Setting goals related to time spent on the platform and genre balance
- Mobile application with weekly digest notifications
Built With
- css
- html
- react
- recharts
- tailwind
- typescript
- vite
