Case 2
Trending Engine
Inspiration
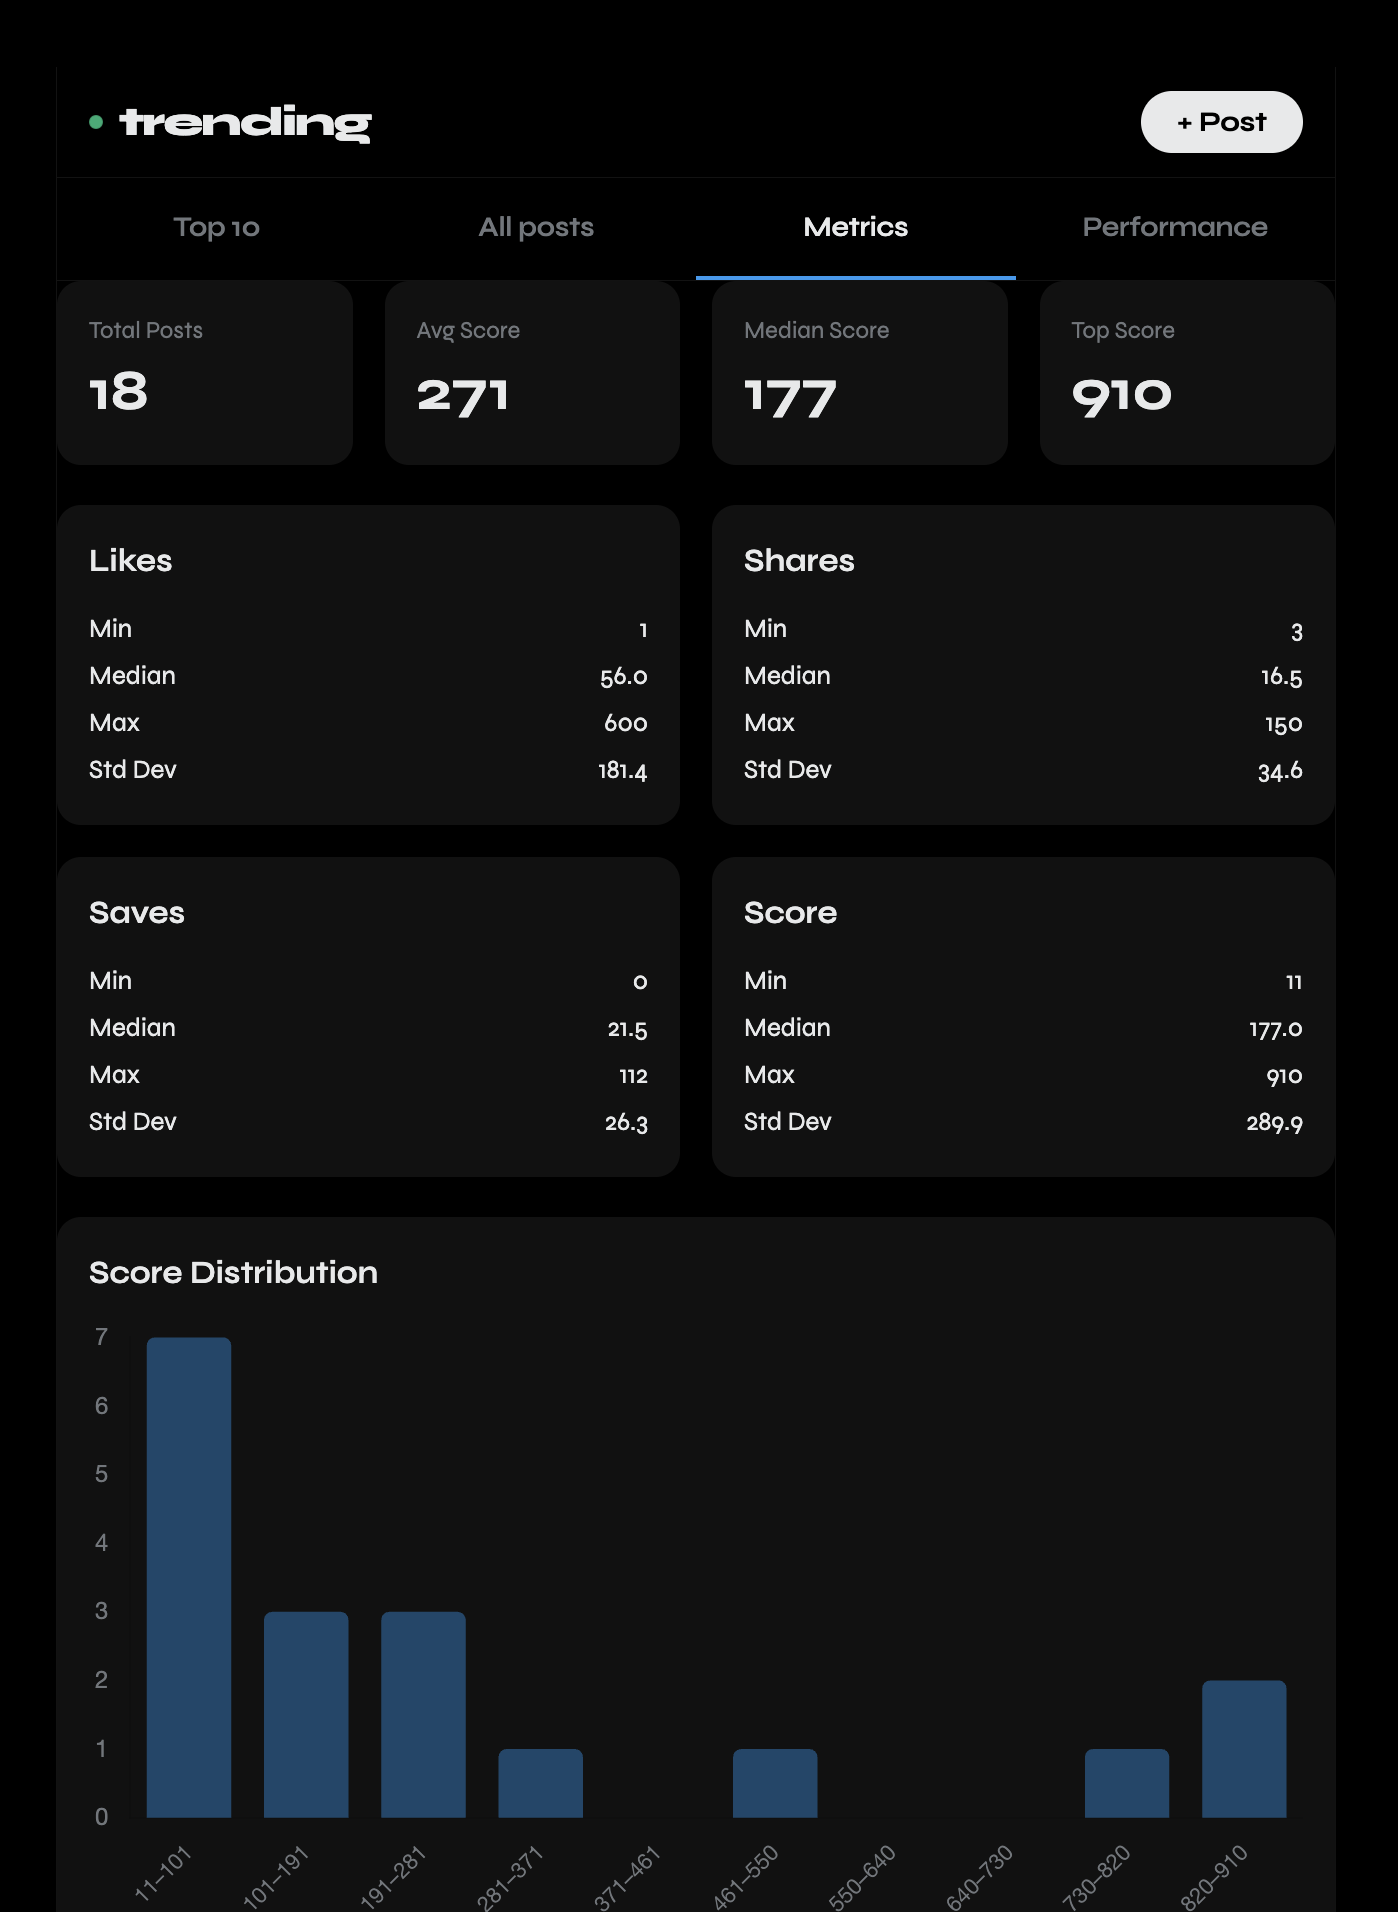
Most “trending” feeds feel like black boxes, you see results, but not why something is trending. We wanted to build a system that doesn’t just rank content, but also explains the underlying patterns using real statistics.
How we built it
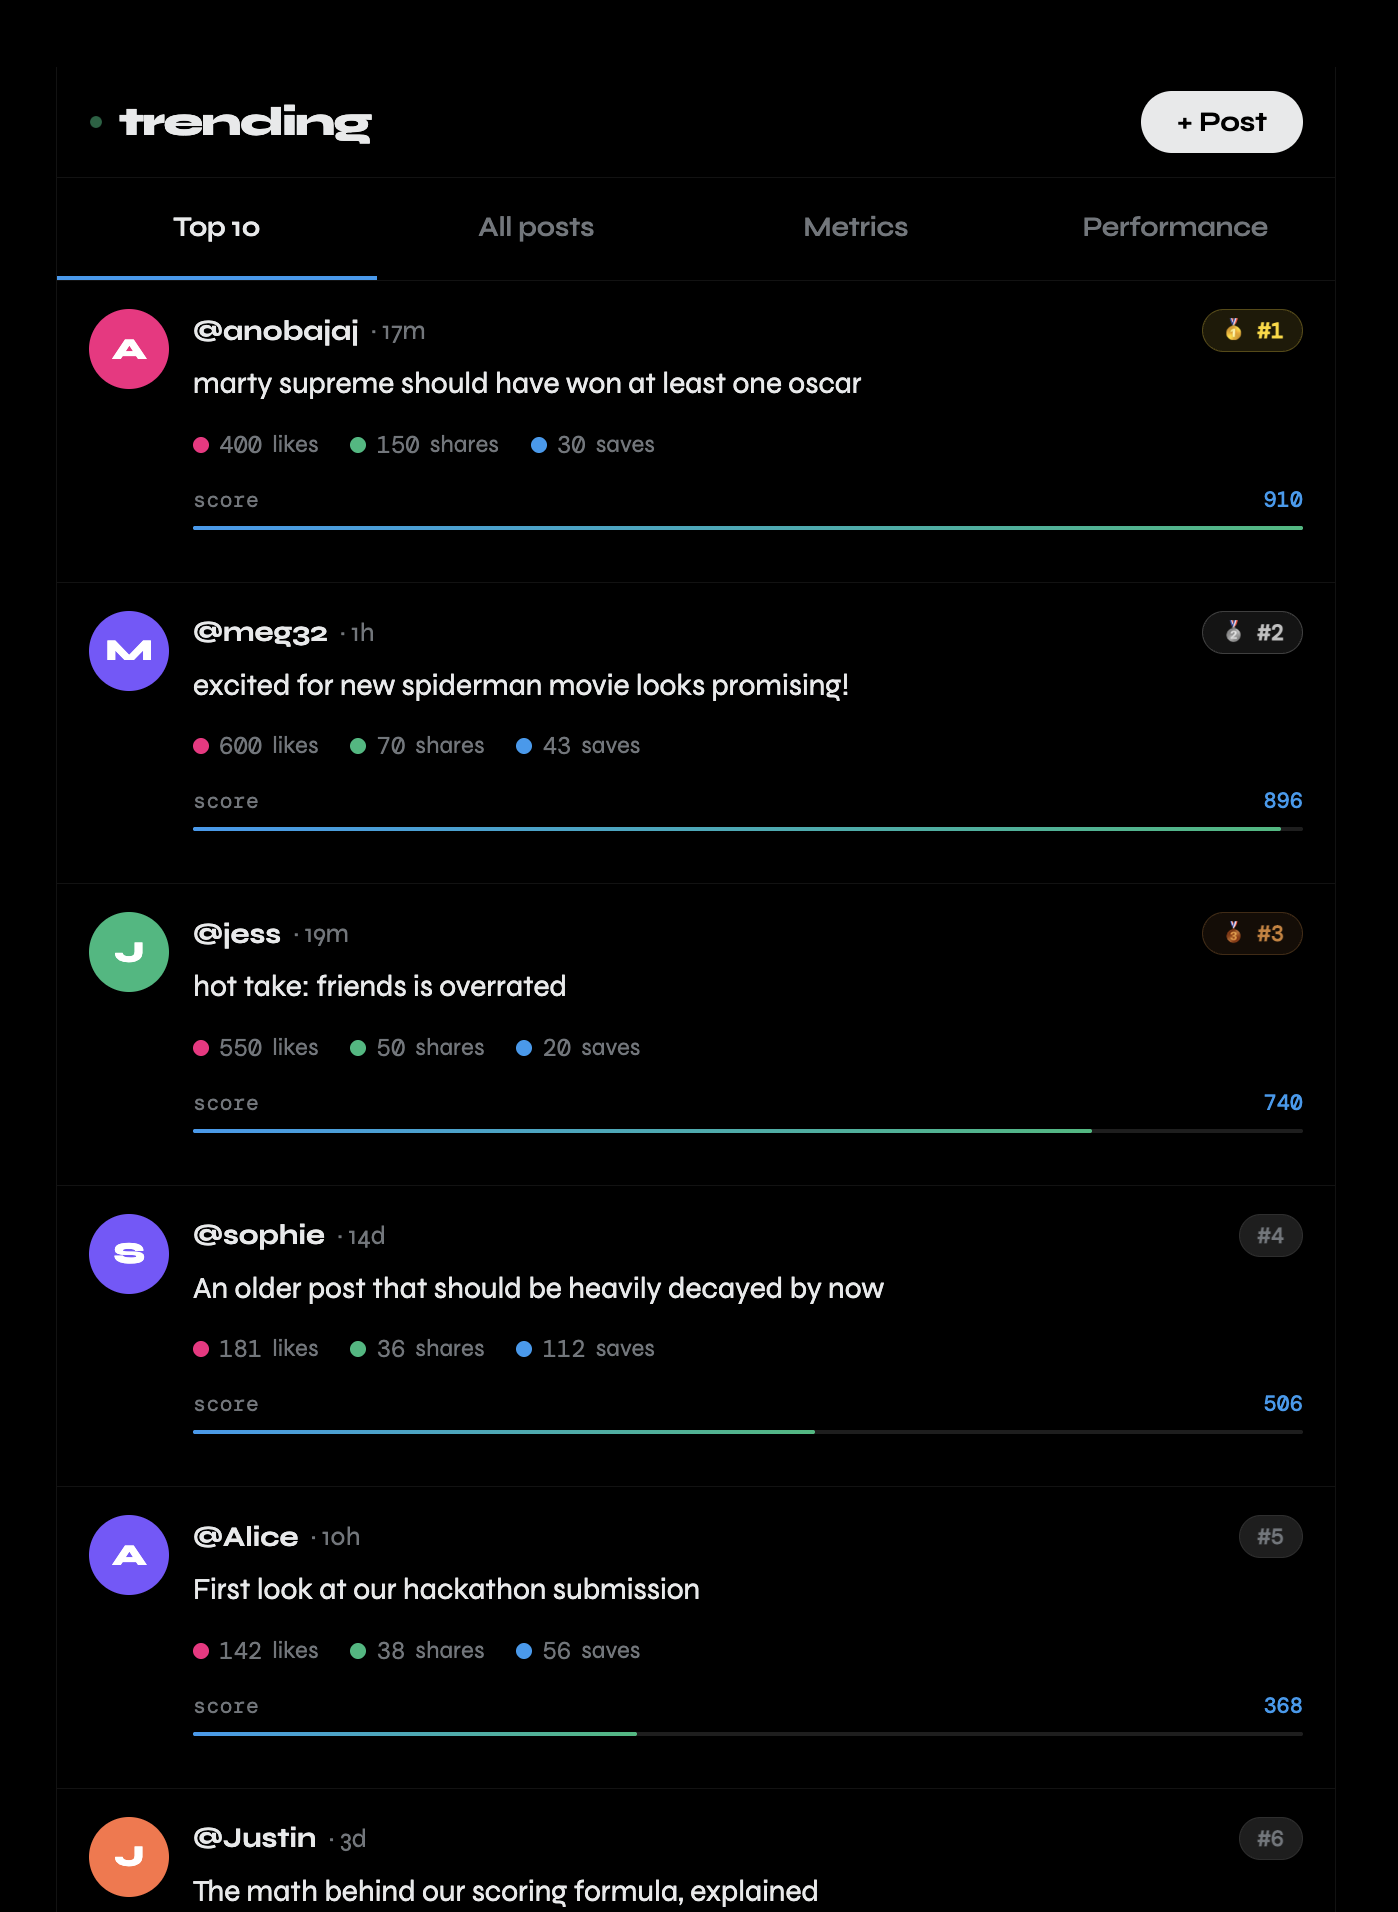
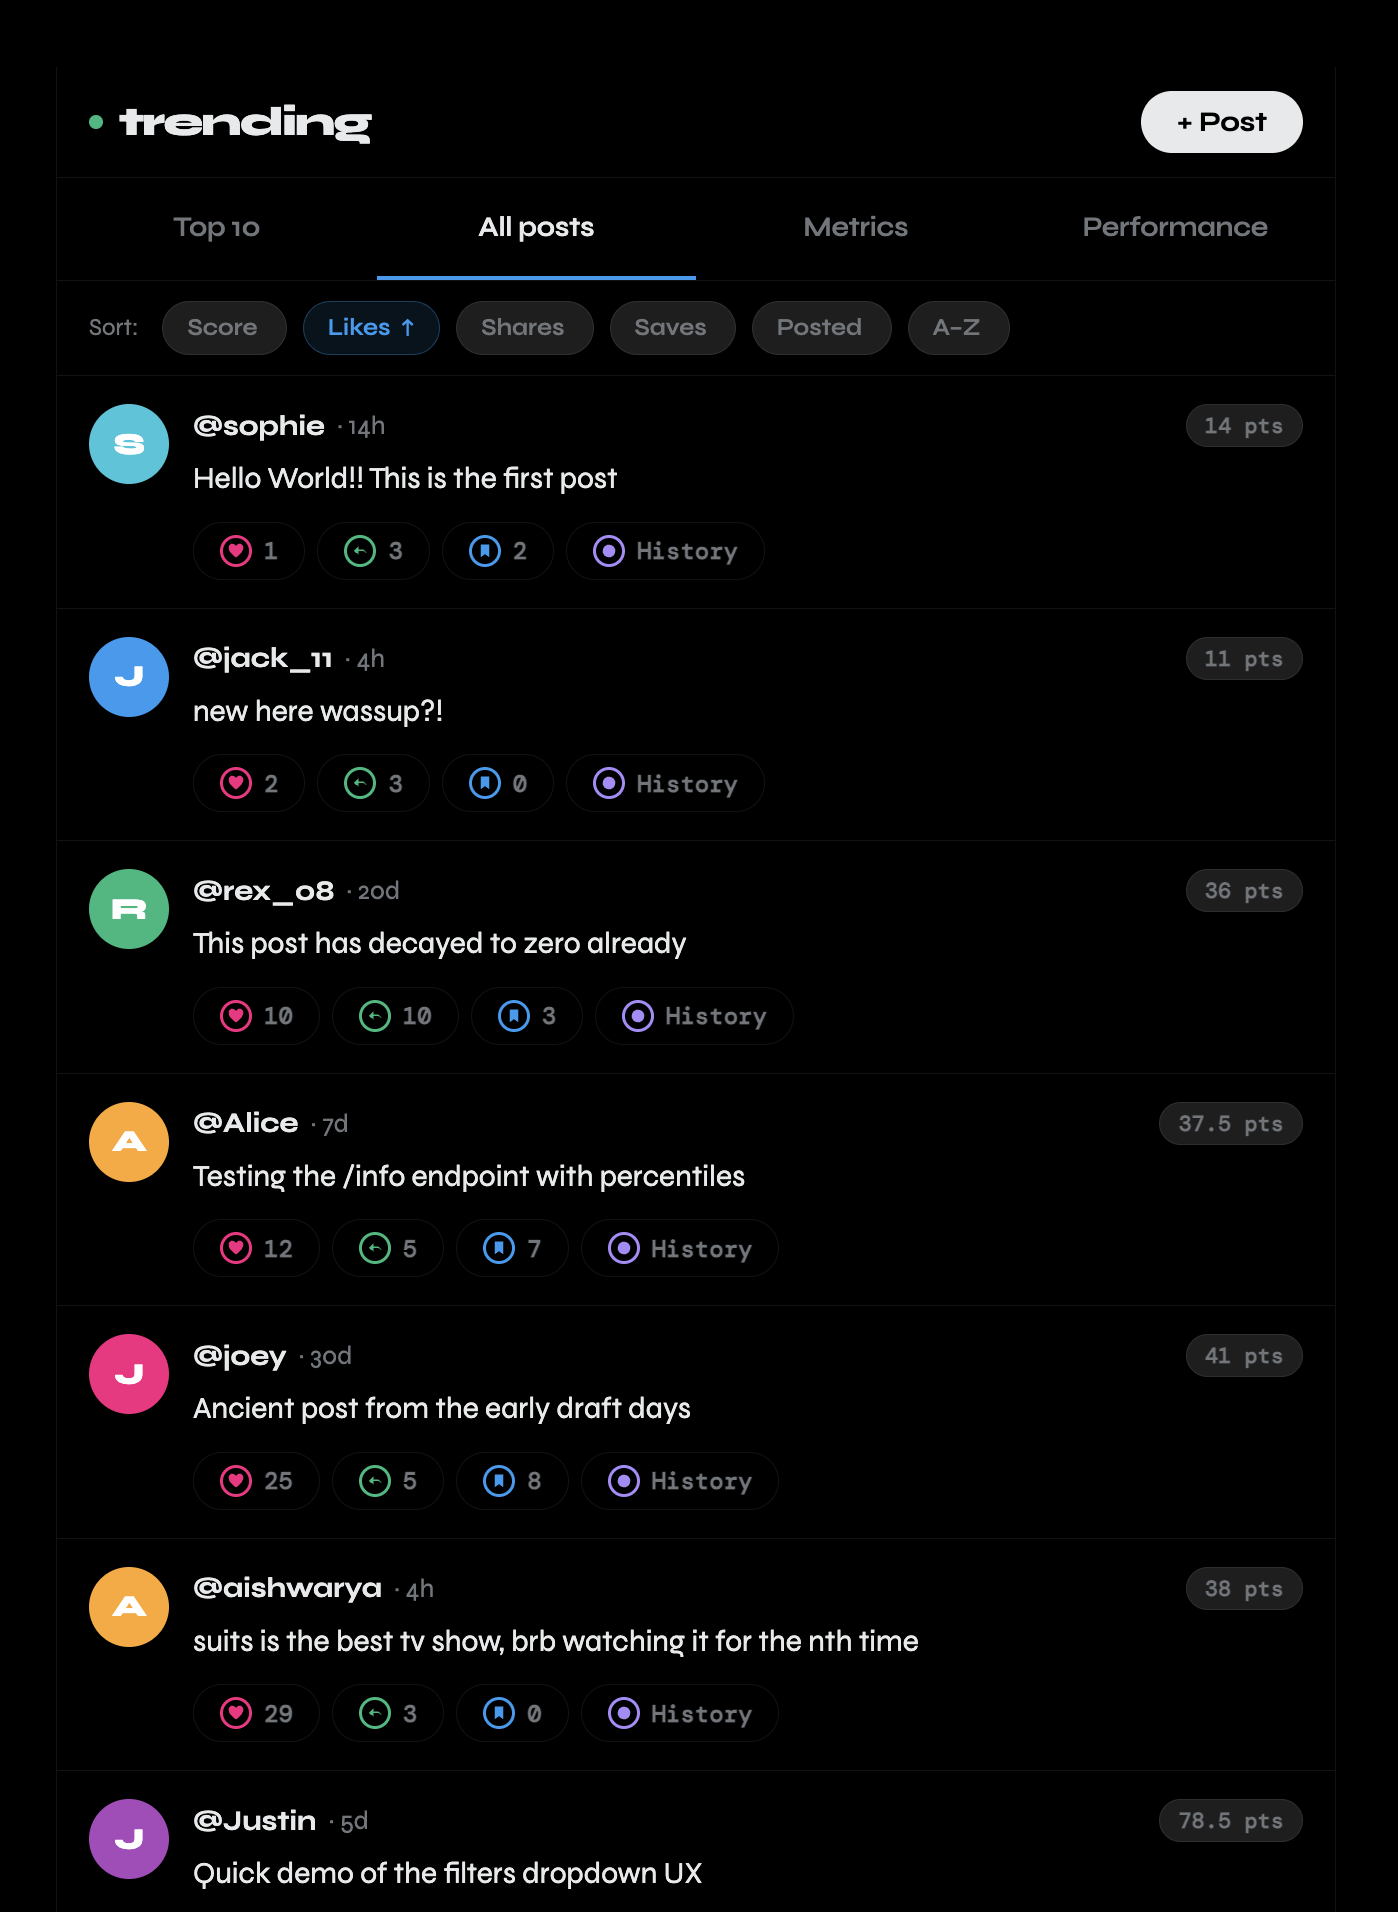
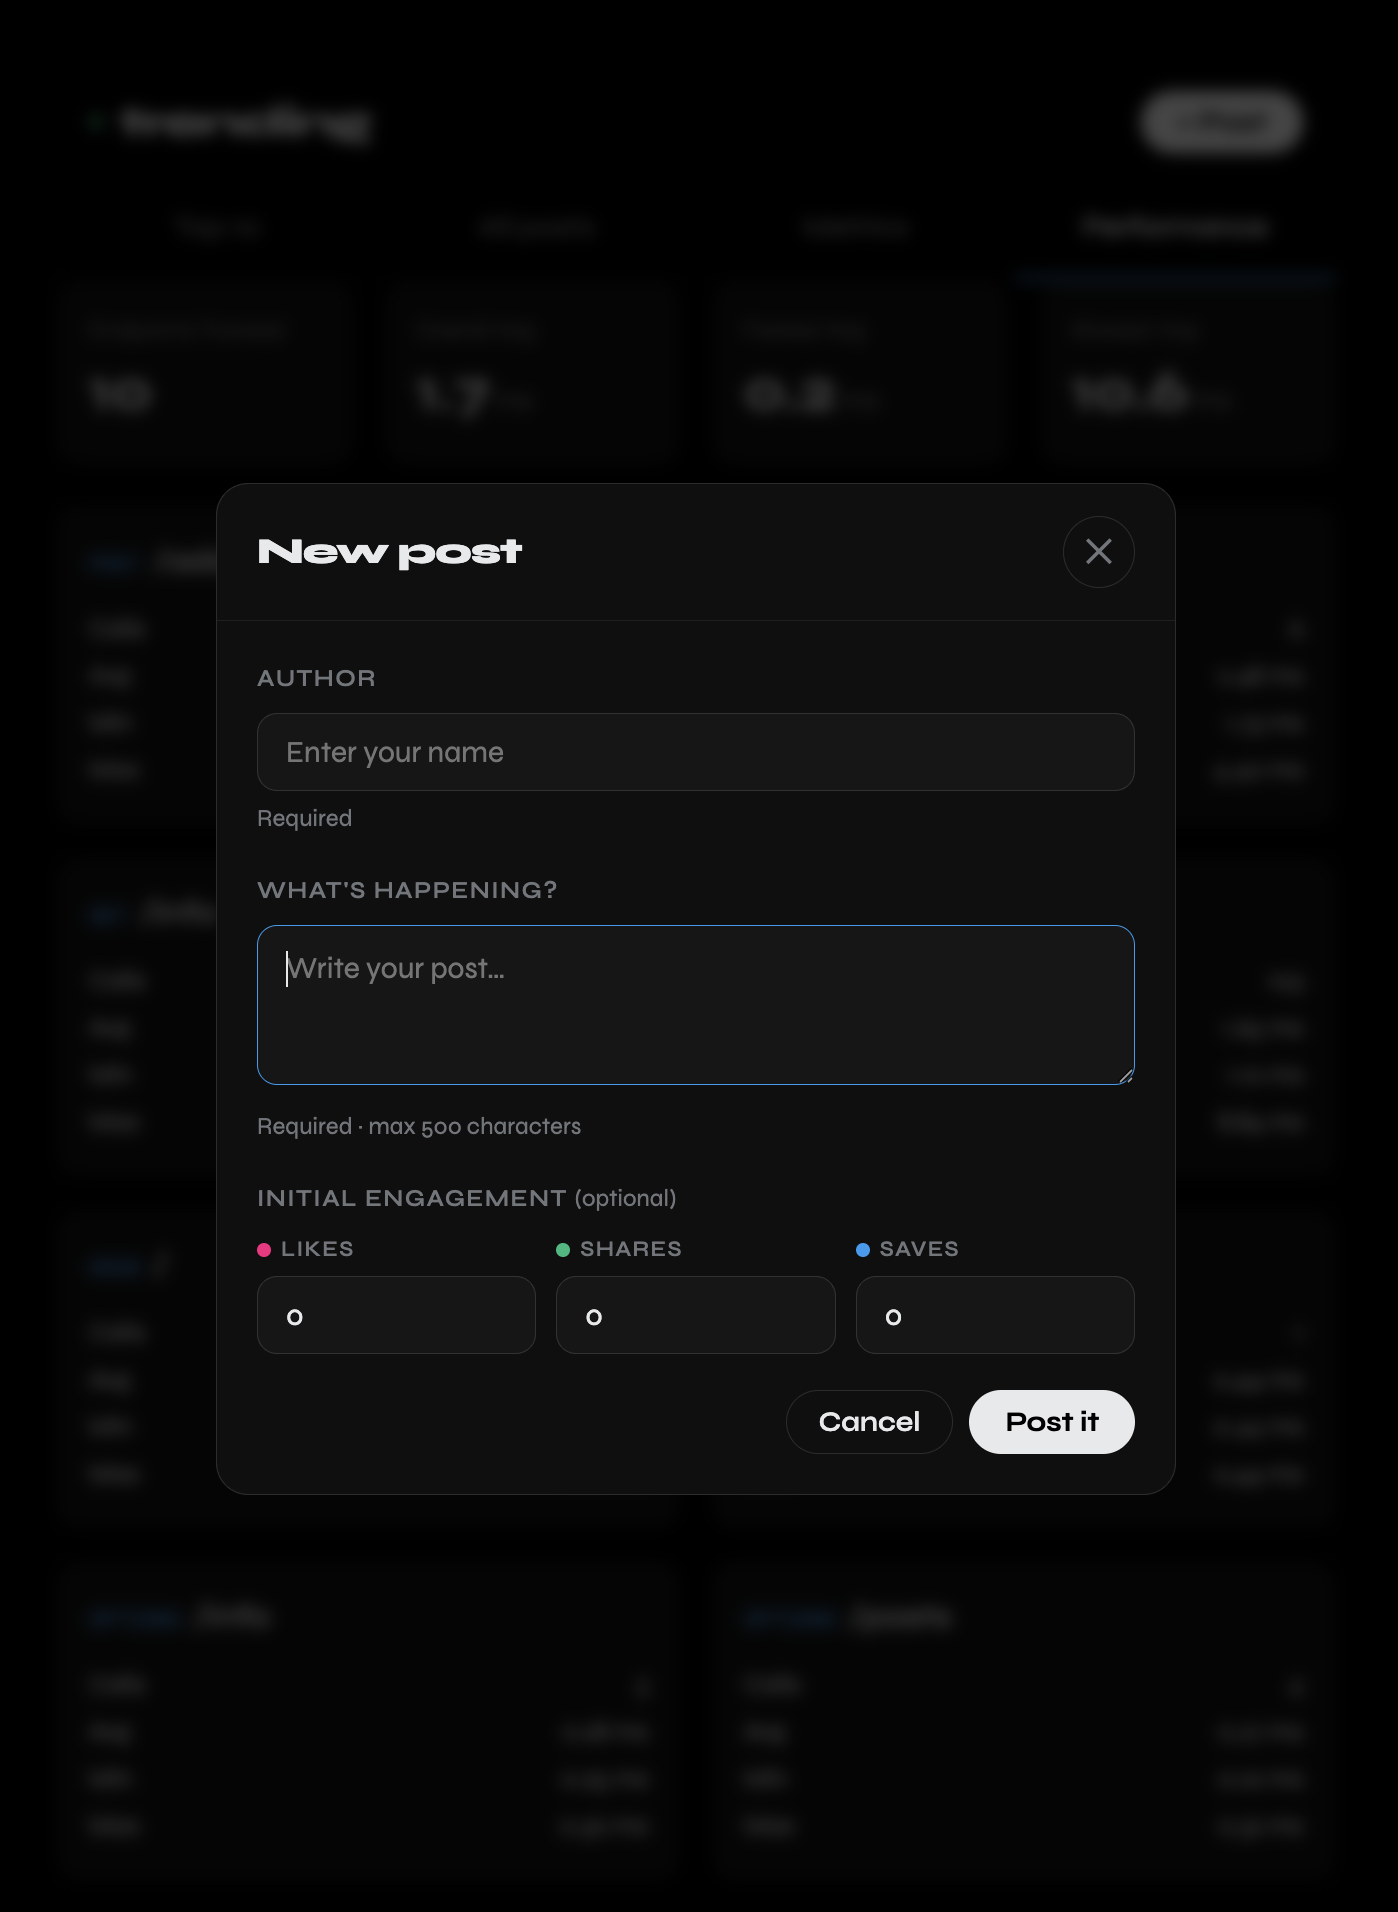
We designed a lightweight backend using FastAPI with SQLite to handle posts, engagement signals, and scoring logic. The frontend is a clean vanilla JS dashboard that renders leaderboards, sorting, and a stats tab with distribution insights and charts. A decayed scoring function ensures recency is factored into rankings:
$$ score = (likes + 2 \cdot shares + 1.5 \cdot saves) \cdot e^{-\lambda t} $$
What we learned
- How to design a ranking system that balances engagement and recency
- Translating raw data into meaningful insights (median vs mean, variance, outliers)
- Building a clean separation between API, data layer, and UI
Challenges
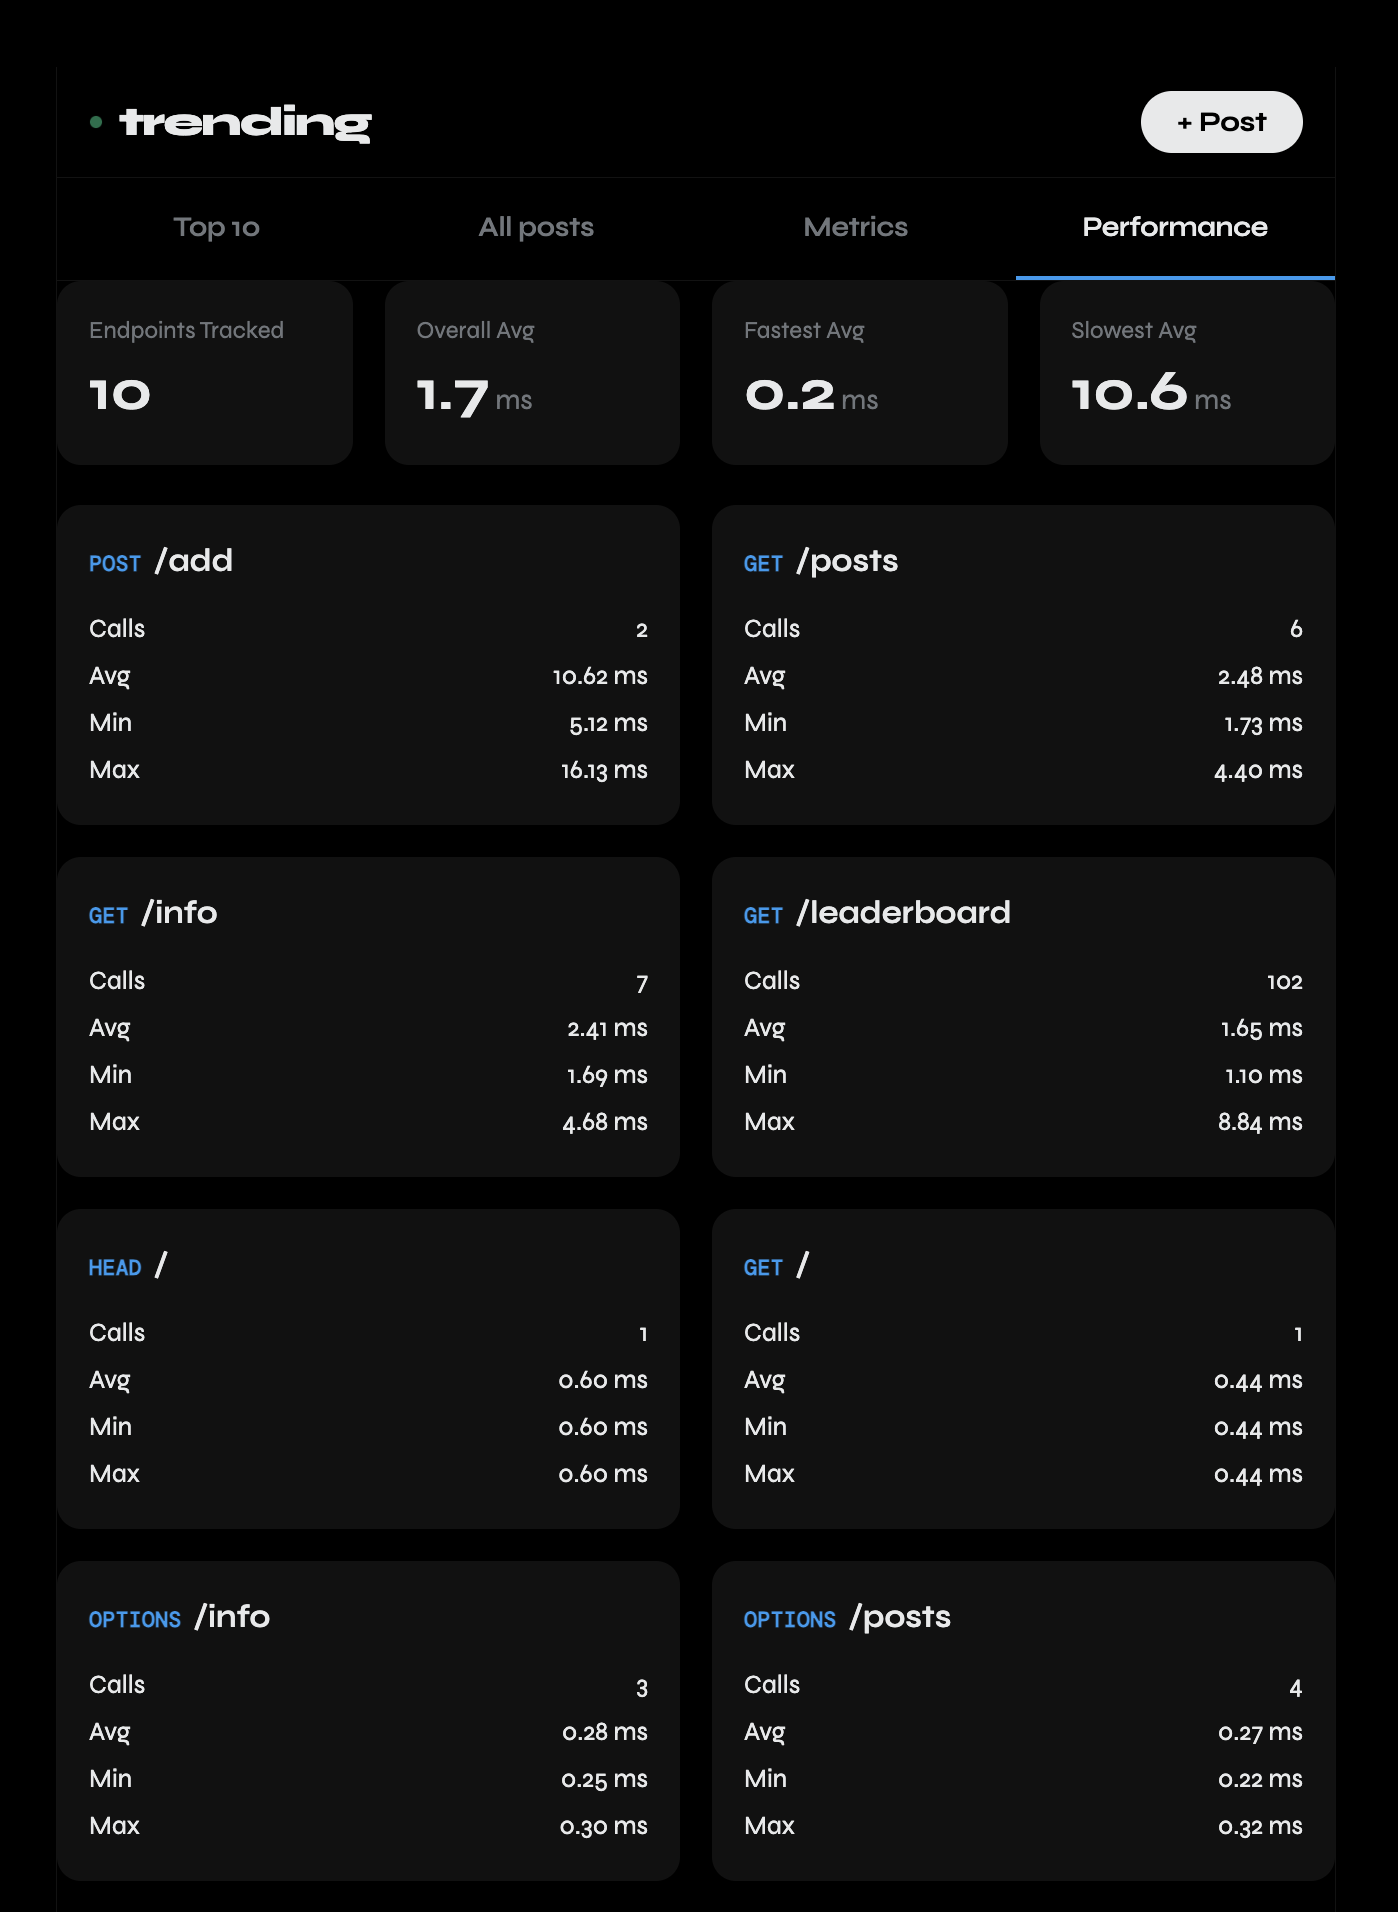
- Avoiding naive implementations (like constant polling and inefficient queries)
- Handling skewed data where a few viral posts dominate metrics
- Turning raw statistics into intuitive, useful visualizations instead of just numbers
Outcome
The result is not just a leaderboard, but a mini analytics engine that reveals how content actually performs, highlighting consistency, volatility, and true “trendiness.”
Built With
- docker
- fastapi
- javascript
- sqlite


Log in or sign up for Devpost to join the conversation.